Fig. A.4
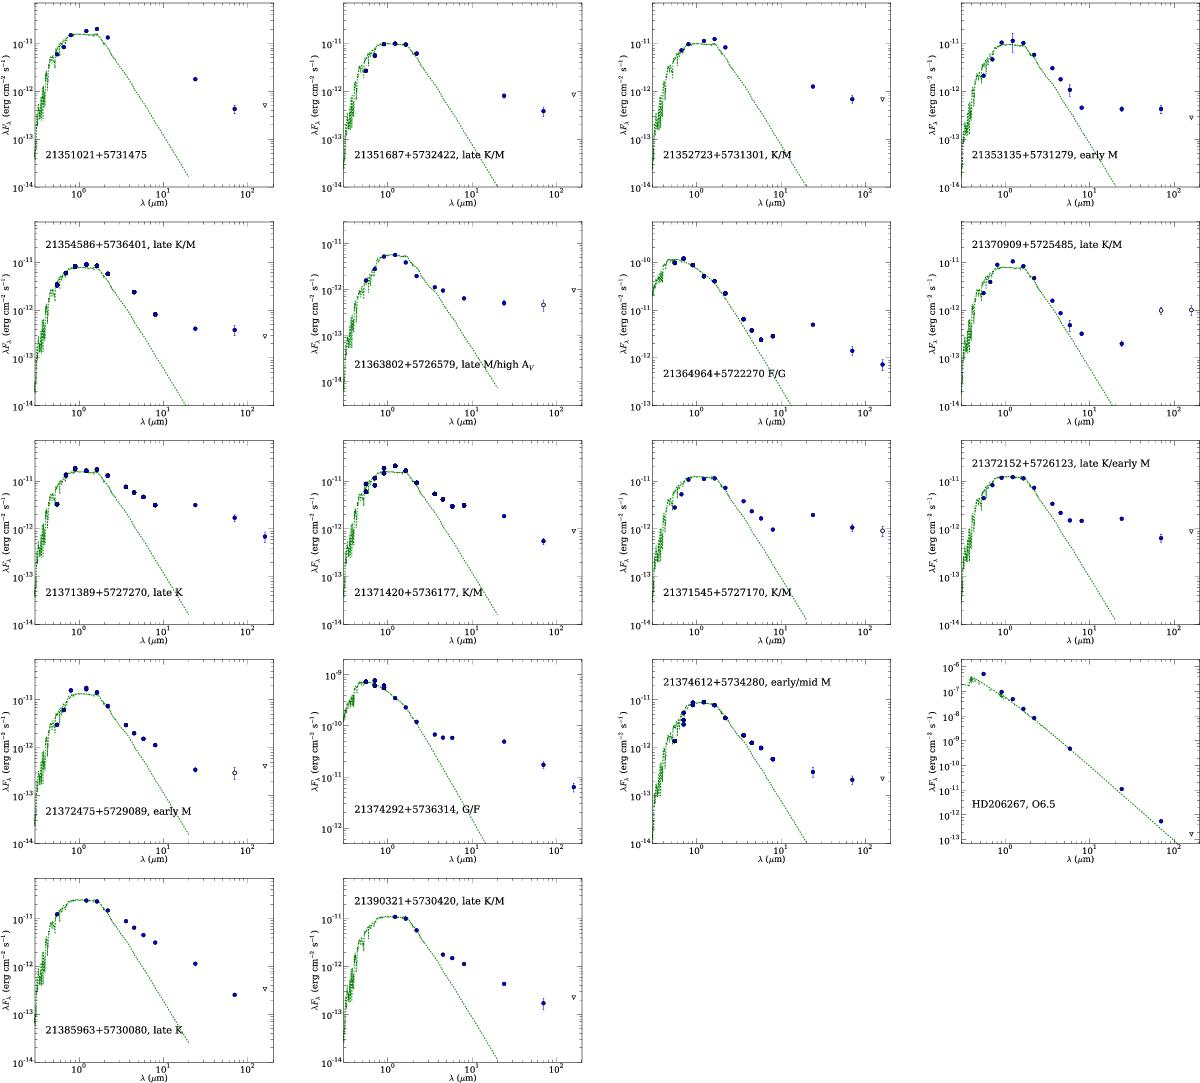
SEDs of objects without optical confirmation (see Table A.2) detected with Herschel. Available optical, Spitzer (IRAC/MIPS photometry and IRS spectra), and WISE, data are shown as filled dots. Errorbars are shown (although they are often smaller than the symbols). Upper limits are marked as inverted open triangles. Marginal detections (close to 3σ or affected by nebulosity) are marked as open circles. A photospheric MARCS model is displayed for comparison. Approximate spectral types (except for HD 206267 are estimated from the comparison with the MARCS model, assuming the typical cluster extinctions.
Current usage metrics show cumulative count of Article Views (full-text article views including HTML views, PDF and ePub downloads, according to the available data) and Abstracts Views on Vision4Press platform.
Data correspond to usage on the plateform after 2015. The current usage metrics is available 48-96 hours after online publication and is updated daily on week days.
Initial download of the metrics may take a while.