| Issue |
A&A
Volume 572, December 2014
|
|
|---|---|---|
| Article Number | A9 | |
| Number of page(s) | 24 | |
| Section | Interstellar and circumstellar matter | |
| DOI | https://doi.org/10.1051/0004-6361/201424166 | |
| Published online | 18 November 2014 | |
Online material
Appendix A: Supplementary material
Table A.1 provides molecular/atomic information about the lines observed in the WILL program.
Table A.2 shows the observing log of PACS observations including observations identifications (OBSID), observation day (OD), date of observation, total integration time, and pointed coordinates (RA, Dec).
Table A.3 informs about which lines are detected toward the Perseus sources. The full list of line fluxes for all WILL sources including Perseus will be tabulated in the forthcoming paper (Karska et al., in prep.).
Table A.4 summarizes observed and modeled line ratios used in the Analysis section.
Figures A.1 and A.2 show line and continuum maps around 179.5 μm for all the Perseus sources in the WILL program.
Figure A.3 show maps in the H2O 423−312 line at 78.74 μm, OH 84.6 μm, and CO 29−28 at 90.16 μm for Per1, Per5, Per9, and Per20, all of which show bright line emission and centrally peaked continuum. The lines are chosen to be located close in the wavelength so that the variations in the PSF does not introduce significant changes in the emission extent.
Log of PACS observations.
Line detections toward our Perseus sources.
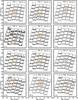 |
Fig. A.1
PACS spectral maps in the H2O 212−101 line at 179.527 μm. Wavelengths in microns are translated to the velocity scale on the X-axis using laboratory wavelengths of the species and cover the range from − 600 to 600 km s-1. The Y-axis shows fluxes normalized to the spaxel with the brightest line on the map in a range − 0.2 to 1.2. The orange contours show continuum emission at 30%, 50%, 70%, and 90% of the peak value written in the bottom left corner of each map. |
| Open with DEXTER | |
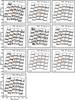 |
Fig. A.2
Same as Fig. A.1 but for the remaining sources. |
| Open with DEXTER | |
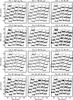 |
Fig. A.3
PACS spectral maps in the H2O 423−312 line at 78.74 μm, the OH line at 84.6 μm, and the CO 29−28 line at 90.16 μm for a few sources with bright line emission and centrally peaked continuum. The x-axis range covers −450 to 450 km s-1 and the y-axis range covers −0.2 to 1.2, with line emission normalized to the emission in the brightest spaxel. |
| Open with DEXTER | |
Observed and model line ratios based on Kaufman & Neufeld (1996).
Appendix B: Correlations with source parameters
Figure B.1 shows selected H2O-to-CO line ratios as a function of source physical parameters (bolometric luminosity, temperature, and envelope mass). Lack of correlation is seen in all cases.
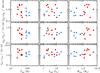 |
Fig. B.1
H2O-to-CO line ratios and, from left to right, bolometric temperature, bolometric luminosity, and envelope mass. The ratios are calculated using lines at nearby wavelengths for which the same, limited to the central spaxel, extraction region is considered. Shown are line ratios of the H2O 212 − 101 line at 179 μm and CO 16−15 at 163 μm (top), the H2O 404 − 313 and CO 21−20 lines at about 125 μm (middle), and the H2O 221 − 110 and CO 24−23 lines at about 108 μm (bottom). Red and blue symbols correspond to sources with Tbol ≤ 70 and >70 K, respectively. Black crosses are drawn for the sources with detections of CO 29−28 line. |
| Open with DEXTER | |
© ESO, 2014
Current usage metrics show cumulative count of Article Views (full-text article views including HTML views, PDF and ePub downloads, according to the available data) and Abstracts Views on Vision4Press platform.
Data correspond to usage on the plateform after 2015. The current usage metrics is available 48-96 hours after online publication and is updated daily on week days.
Initial download of the metrics may take a while.