Fig. A.3
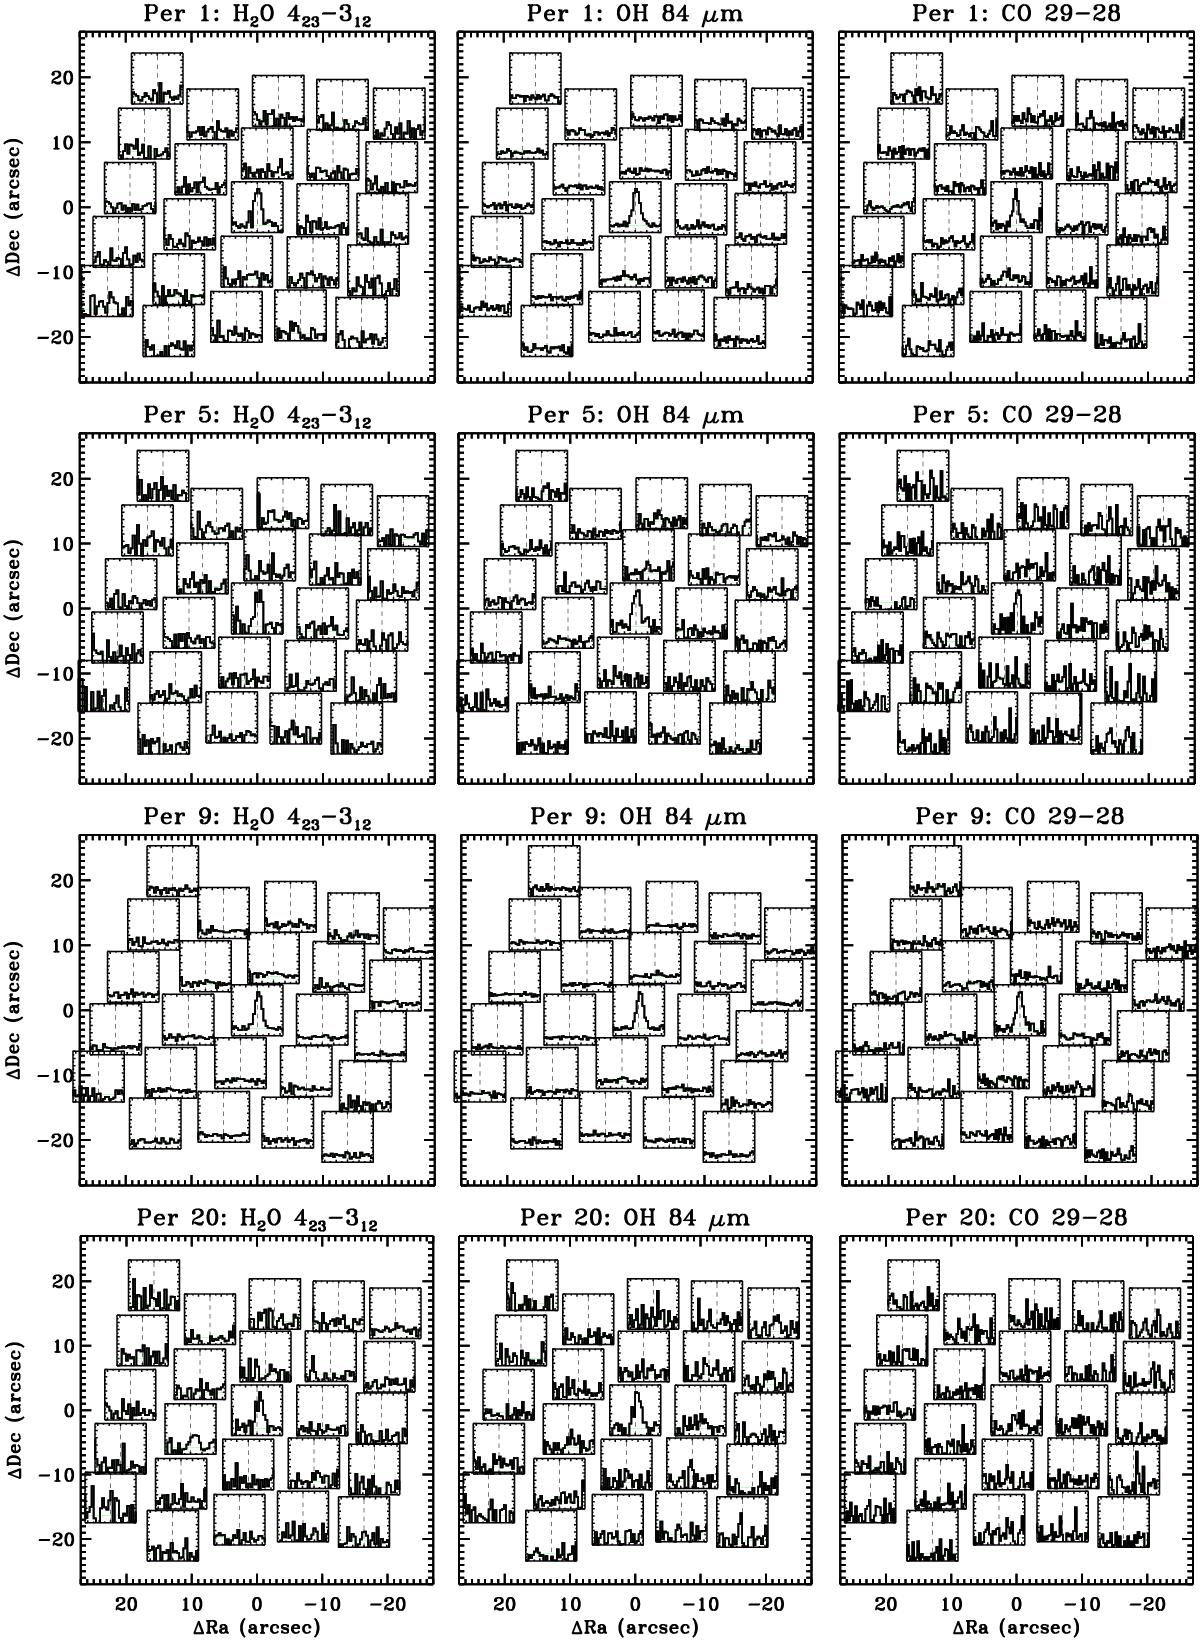
PACS spectral maps in the H2O 423−312 line at 78.74 μm, the OH line at 84.6 μm, and the CO 29−28 line at 90.16 μm for a few sources with bright line emission and centrally peaked continuum. The x-axis range covers −450 to 450 km s-1 and the y-axis range covers −0.2 to 1.2, with line emission normalized to the emission in the brightest spaxel.
Current usage metrics show cumulative count of Article Views (full-text article views including HTML views, PDF and ePub downloads, according to the available data) and Abstracts Views on Vision4Press platform.
Data correspond to usage on the plateform after 2015. The current usage metrics is available 48-96 hours after online publication and is updated daily on week days.
Initial download of the metrics may take a while.