Fig. A.1
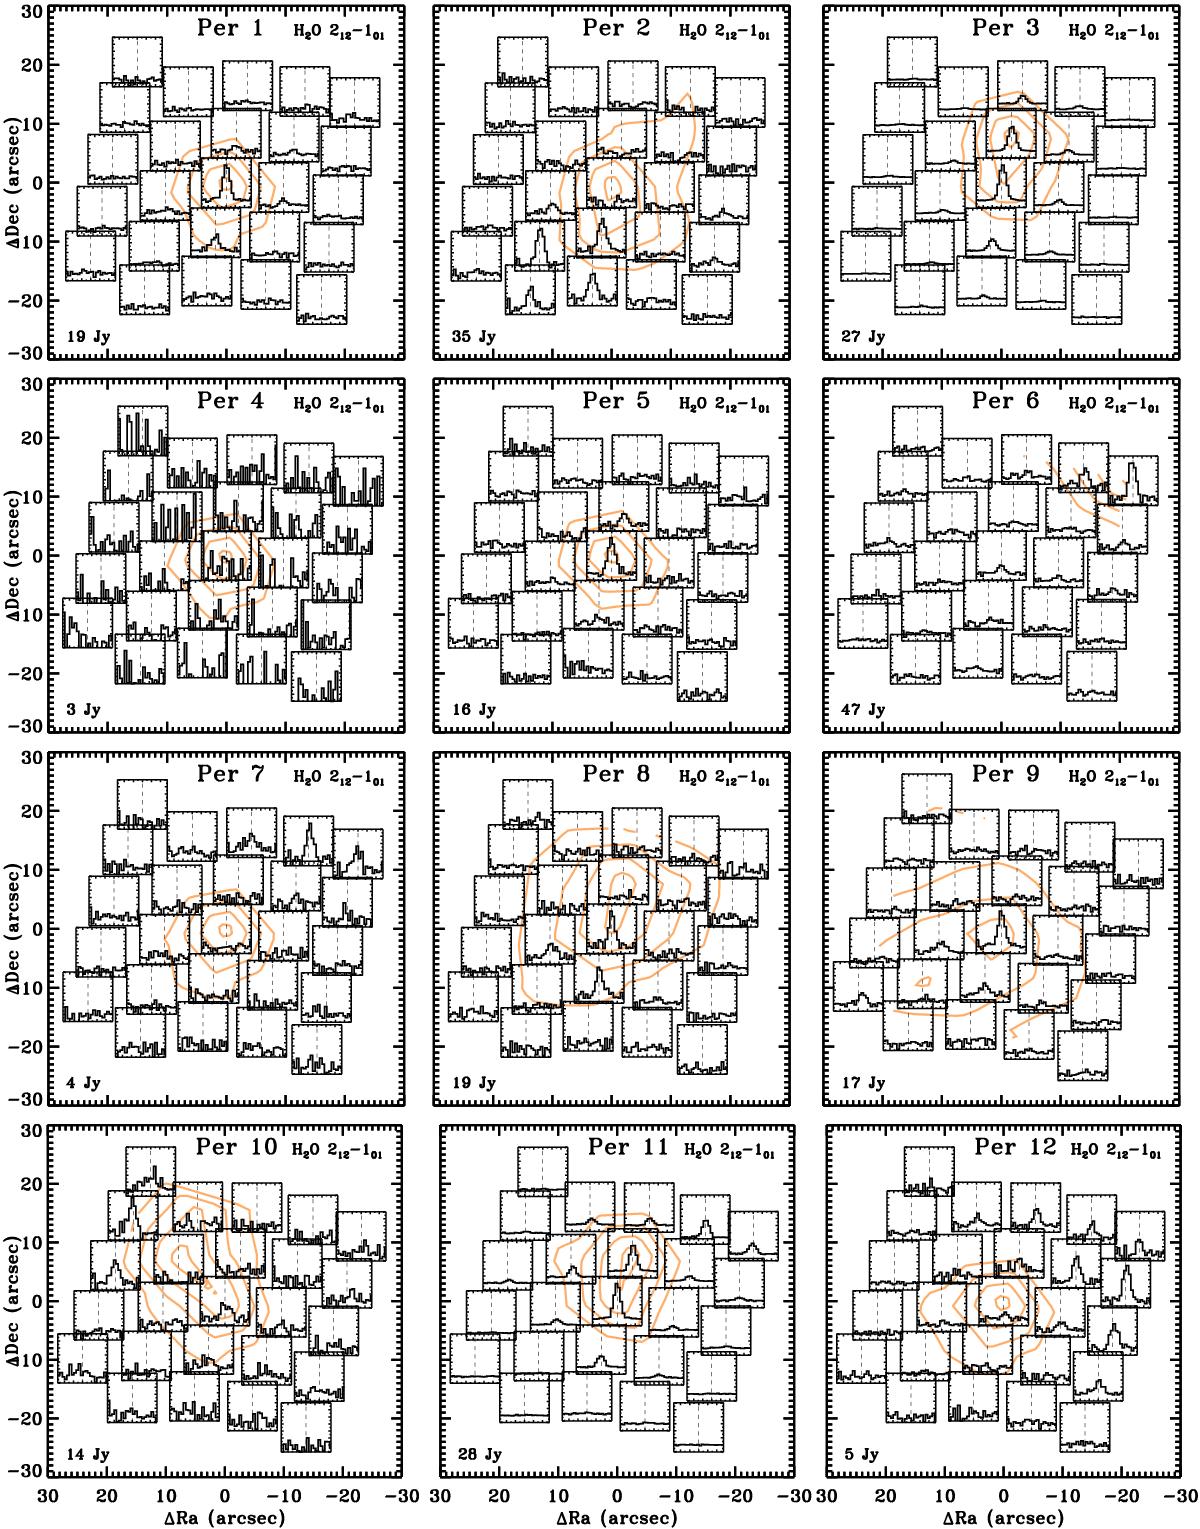
PACS spectral maps in the H2O 212−101 line at 179.527 μm. Wavelengths in microns are translated to the velocity scale on the X-axis using laboratory wavelengths of the species and cover the range from − 600 to 600 km s-1. The Y-axis shows fluxes normalized to the spaxel with the brightest line on the map in a range − 0.2 to 1.2. The orange contours show continuum emission at 30%, 50%, 70%, and 90% of the peak value written in the bottom left corner of each map.
Current usage metrics show cumulative count of Article Views (full-text article views including HTML views, PDF and ePub downloads, according to the available data) and Abstracts Views on Vision4Press platform.
Data correspond to usage on the plateform after 2015. The current usage metrics is available 48-96 hours after online publication and is updated daily on week days.
Initial download of the metrics may take a while.