Fig. B.1
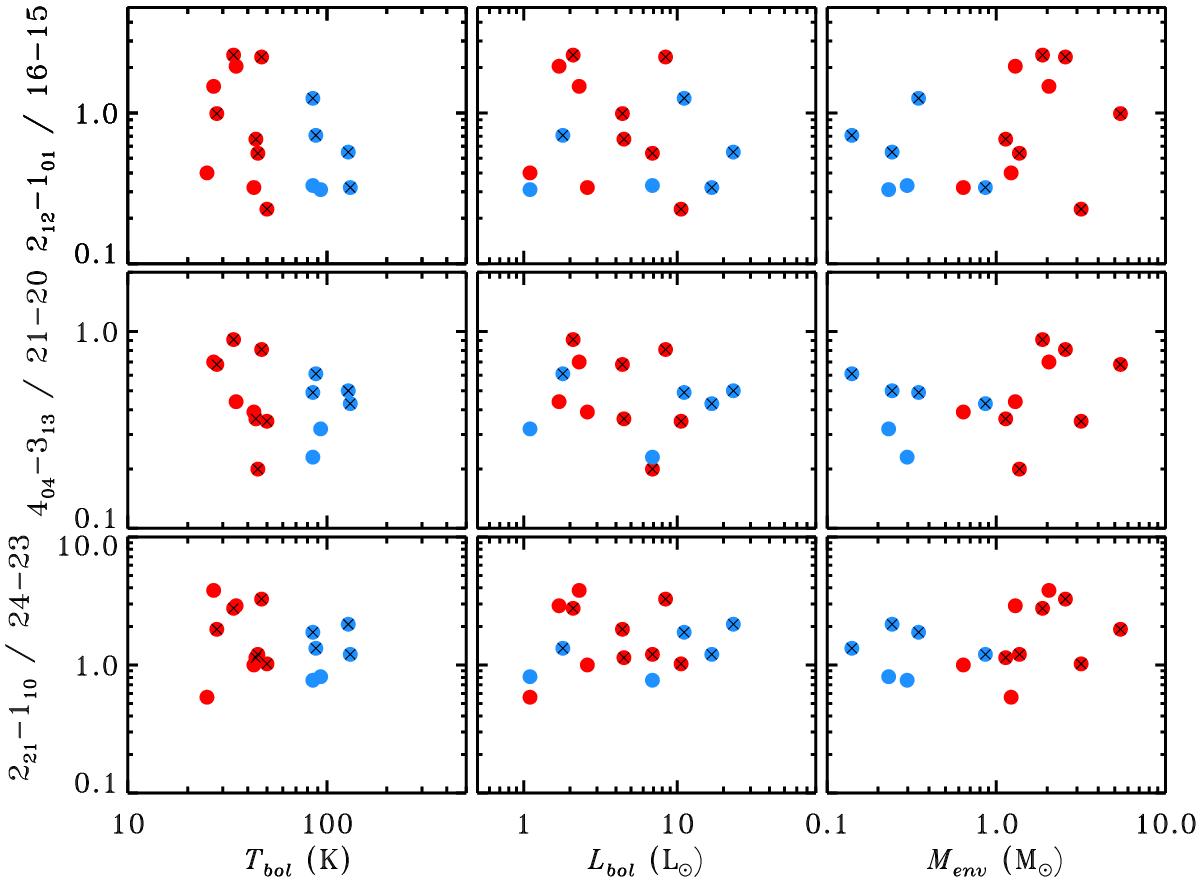
H2O-to-CO line ratios and, from left to right, bolometric temperature, bolometric luminosity, and envelope mass. The ratios are calculated using lines at nearby wavelengths for which the same, limited to the central spaxel, extraction region is considered. Shown are line ratios of the H2O 212 − 101 line at 179 μm and CO 16−15 at 163 μm (top), the H2O 404 − 313 and CO 21−20 lines at about 125 μm (middle), and the H2O 221 − 110 and CO 24−23 lines at about 108 μm (bottom). Red and blue symbols correspond to sources with Tbol ≤ 70 and >70 K, respectively. Black crosses are drawn for the sources with detections of CO 29−28 line.
Current usage metrics show cumulative count of Article Views (full-text article views including HTML views, PDF and ePub downloads, according to the available data) and Abstracts Views on Vision4Press platform.
Data correspond to usage on the plateform after 2015. The current usage metrics is available 48-96 hours after online publication and is updated daily on week days.
Initial download of the metrics may take a while.