| Issue |
A&A
Volume 554, June 2013
|
|
|---|---|---|
| Article Number | A58 | |
| Number of page(s) | 19 | |
| Section | Extragalactic astronomy | |
| DOI | https://doi.org/10.1051/0004-6361/201220669 | |
| Published online | 04 June 2013 | |
Online material
Properties of the galaxy sample.
Appendix A: Dependence of ℳ-Z relation with the SFR: Apperture effects
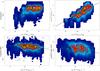 |
Fig. A.1
Top-right panel: distribution of the oxygen abundance along the stellar mass for the ~50,000 simulated aperture measurements, as described in the text. The contours indicate the same encircled fraction of object than in precendent figures (e.g., Fig. 5). The solid yellow circles indicate the average abundances for consecutive bins of 0.2 dex in stellar mass. Only those binned values with a significant number of objects are shown. Top-left panel: distribution of the integrated star-formation rate along the stellar mass for the simulated galaxies. Contours and symbols represent the same as in previous panel. The solid line shows the regression line between the two parameters. Bottom-left panel: Distribution of the differential oxygen abundance with respect to the derived ℳ-Z relation along the SFR for the simulated galaxies, when only the aperture effect is considered. Bottom-right panel: distribution of the differential oxygen abundance with respect to the derived ℳ-Z relation along the SFR for the simulated galaxies, when both the aperture effect and the evolution of the ℳ-Z relation with redshift is taken into account. In both panels the contours and sybmols represent similar concepts like in previous figures and panels. The solid line shows the best derived fit using a simple linear regression method. |
| Open with DEXTER | |
We showed in the main text our results of the study of a possible dependence of the ℳ-Z relation with the SFR. Using the IFS data provided by the CALIFA survey, we were able to derive the ℳ-Z relation with abundances unaffected by aperture effects. In a similar way we derived the complete integrated SFR for these galaxies. In contrast to previous results in the literature (e.g. Mannucci et al. 2010; Lara-López et al. 2010), we found no secondary dependence of the abundance with the SFR once we considered the dependence of these parameters with the mass. The only similar result found in the literature where no dependence on the SFR is described used a sample of integrated spectra taken using drift-scan observations (e.g. Hughes et al. 2013). In summary, when the biases due to aperture are minimized, the dependence on the SFR seems to disappear.
It is beyond the scope of this article to explain why other studies found a correlation that we cannot reproduce, in particular when we used a less biased and more detailed estimate of the considered quantities. However, as a sanity check and to provide a suitable explanation, we performed a test of the aperture effects. The oxygen abundance and the SFR are potentially affected by this aperture effect. However, the stellar mass is the less affected, in particular if only photometric data are considered. With CALIFA we are in the unique situation of being able to reproduce the aperture effects present in single aperture observations by simulating the considered apertures and re-analyzing the corresponding simulated spectra.
It is important to use a sample as our starting dataset for the simulations of which we know a priori that it does not show any secondary correlation between the abundance and the SFR when the dependency with the mass is removed. That way we can be sure that the induced correlation was not present as an input ingredient of the simulation.
For each galaxy in our dataset with well-defined characteristic oxygen abundance, we extracted a set of aperture spectra centred on the peak emission of the galaxy and with consecutive apertures corresponding to the distance of each of the detectedH ii regions from our catalog. This ensures that there is a clear change in the ionization conditions between consecutive apertures. Each of these aperture spectra corresponds to the same galaxy observed at different redshifts. To be consistent with the redshift ranges adopted in Mannucci et al. (2010) and Lara-López et al. (2010), we restricted our apertures to diameters larger than 12″. This roughly corresponds to the projected size of a SDSS fiber at the lower redshift adopted by this study (z ~ 0.07). After extracting the spectra, we repeated the same analysis as we performed for the individualH ii regions, described in Sect. 3.1, deriving the oxygen abundance and integrated SFR. Together with the integrated stellar masses, we had with ~ 2500 individual simulations of the three quantities analyzed in this study.
Finally, we performed a Monte-Carlo simulation to take into account possible effects of the noise in the overall process. For each of the three considered quantities 20 individual realizations were derived, taking into account the corresponding propagated errors (including also those of the stellar masses). We obtained with ~ 50 000 simulated aperture biased quantities.
Figure A.1 shows the results of this simulation. In the top-left panel we show the derived ℳ-Z relation for the simulated
spectra. As expected, it follows the observed relation presented in Fig. 4.This result was previously shown by Rosales-Ortega et al. (2012), who reproduced the global ℳ-Z from the local one (derived from the abundance gradients), based purely on simulated galaxies. However, a more detailed comparison shows that although both relations are very similar, there are slightly differences: (i) the asymptotic oxygen abundance for large masses is ~ 0.05 dex larger in the simulated relation and (ii) the dispersion of oxygen abundances along the average value is higher (σlog (O/H) ~ 0.1 dex, similar to the one reported by T04). Both results are expected: (1) we are including more central estimates of the abundance for the same range of masses. In the center of the galaxies the abundance is larger than in the outer parts by ~ 0.1 dex (e.g. Sánchez et al. 2012b). Thus, the net effect is an increase of the upper envelope of the abundance; (2) we are including measurements of different abundances for the same mass range because we enlarge the covered area of the galaxy, simulating the effect of the redshift. Therefore, the dispersion at a certain mass range is increased.
Figure A.1, top-right panel, shows the distribution of the simulated SFRs along the stellar masses. As expected, we reproduce the relation between the two quantities in a similar way as described in Fig. 4. The main differences are that (1) the dispersion is slightly higher: σlog (SFR) ~ ~ 0.35 dex, compared to σlog (SFR) ~ 0.18 dex; (2) there is a tail to lower values of the SFR at a given mass. This is in particular evident for the low-mass range of the figure (M ~ 109.5 M⊙). Again, these effects are clearly explained by the aperture bias, since at a given mass we are sampling areas of lower integrated SFR than the real one (i.e., the central regions), which is an upper limit.
Finally, we derived the differential oxygen abundance with respect to the considered ℳ-Z relation for the simulated data. We aimed to determine whether there is any correlation with the SFR, following the analysis in Sect. 3.3. Figure A.1, bottom-left panel shows the distribution of these two parameters. There is a clear correlation (r = 0.92) in a similar sense as described in Mannucci et al. (2010) and Lara-López et al. (2010), i.e., galaxies with lower SFR seem to be more metal poor. After applying this correlation, we recovered the initial dispersion of the ℳ-Z relation described for our original dataset (σΔlog (O/H) ~ 0.07 dex), a decrease similar to the one reported by these two authors. The dependence of the SFR is Δlog (O/H) ∝ − 0.1 log (SFR), just slightly weaker than the linear term of Eq. (2) in Mannucci et al. (2010), − 0.14 dex/log (SFR), or the combination of Eqs. (3) and (4) of the same authors.
To investigate this problem in more detail, we included in our simulation the reported ℳ-Z evolution with redshift as described in Moustakas et al. (2011). To do this, we determined which redshift corresponds to each of the simulated apertures and applied the described correction to the corresponding derived abundance. Results are shown in Fig. A.1, bottom-right panel. Taking into account the possible redshift dependence, the new differential oxygen abundance depends more strongly on the SFR, Δlog (O/H) ∝ − 0.2log (SFR).
Although this is a very simplistic simulation, based on a reduced number of input galaxies, in general we have shown that aperture effects, together with other evolutionary properties of galaxies, may induce the secondary correlations between the ℳ-Z and the SFR that we were unable to reproduce using our IFS data.
© ESO, 2013
Current usage metrics show cumulative count of Article Views (full-text article views including HTML views, PDF and ePub downloads, according to the available data) and Abstracts Views on Vision4Press platform.
Data correspond to usage on the plateform after 2015. The current usage metrics is available 48-96 hours after online publication and is updated daily on week days.
Initial download of the metrics may take a while.