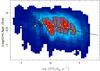
Fig. A.1
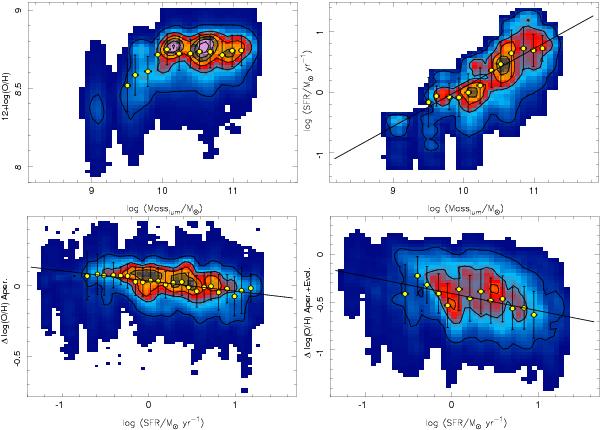
Top-right panel: distribution of the oxygen abundance along the stellar mass for the ~50,000 simulated aperture measurements, as described in the text. The contours indicate the same encircled fraction of object than in precendent figures (e.g., Fig. 5). The solid yellow circles indicate the average abundances for consecutive bins of 0.2 dex in stellar mass. Only those binned values with a significant number of objects are shown. Top-left panel: distribution of the integrated star-formation rate along the stellar mass for the simulated galaxies. Contours and symbols represent the same as in previous panel. The solid line shows the regression line between the two parameters. Bottom-left panel: Distribution of the differential oxygen abundance with respect to the derived ℳ-Z relation along the SFR for the simulated galaxies, when only the aperture effect is considered. Bottom-right panel: distribution of the differential oxygen abundance with respect to the derived ℳ-Z relation along the SFR for the simulated galaxies, when both the aperture effect and the evolution of the ℳ-Z relation with redshift is taken into account. In both panels the contours and sybmols represent similar concepts like in previous figures and panels. The solid line shows the best derived fit using a simple linear regression method.
Current usage metrics show cumulative count of Article Views (full-text article views including HTML views, PDF and ePub downloads, according to the available data) and Abstracts Views on Vision4Press platform.
Data correspond to usage on the plateform after 2015. The current usage metrics is available 48-96 hours after online publication and is updated daily on week days.
Initial download of the metrics may take a while.