| Issue |
A&A
Volume 543, July 2012
|
|
|---|---|---|
| Article Number | A147 | |
| Number of page(s) | 7 | |
| Section | Stellar structure and evolution | |
| DOI | https://doi.org/10.1051/0004-6361/201118516 | |
| Published online | 13 July 2012 | |
Online material
Appendix A: Optical loading of XMM observations
Optical loading occurs because the EPIC detectors have a non-zero response to optical photons (Lumb 2000). Thus, optical photons from a source may generate electrons that would be confused with the charge clouds generated by X-ray photons. For moderately bright optical sources, the net effect is to increase the apparent energy of detected X-ray events. For bright sources, the optical photons that bombard single or adjacent pixels may register as pseudo X-ray events. Three optical blocking filters (thin, medium, and thick) can be employed to reduce optical loading. The limiting magnitude for each blocking filter depends on the spectrum of the source, with redder sources suffering more from optical loading (Lumb 2000). EPIC-pn slew observations are performed in full frame mode (frame time 0.07 s) with the medium optical blocking filter, and hence, for visually bright and red sources, e.g. AGB stars, optical loading represents a potential problem. The medium filter is expected to prevent optical contamination from point sources brighter than V = 6–9 mag depending on the color of the source.
To evaluate the likelihood of optical loading for the AGB stars in Table A.1, their visual light curves were investigated. Three of the objects found in the XMM slew survey are semi-regular variables (SRb) and one is a Mira (M). All vary up to several magnitudes in the optical during one period. Validated data from the American Association of Variable Star Observers (AAVSO) was used to estimate the visual magnitude of the objects at the time of the X-ray observations. Most of the data available are visual data, i.e. obtained by comparing the brightness of the source to nearby comparison stars by eye. This data has been proven to be accurate within 0.1 mag (Lawson et al. 1990; Moon et al. 2008). To estimate the visual magnitude, V, at the time of the X-ray observation, a low order polynomial was fitted (using least-square minimization) to the light curve within ± 30 d of the XMMSS observations. The results are given in Table A.1 together with the standard deviation, ΔV. Three of the AGB stars are brighter than the optical loading limit of the medium optical blocking filter. Only R Leo is fainter.
Visual magnitudes, V, with standard deviation errors, ΔV, at the time of the XMMSS X-ray observation, from the AAVSO archive.
Lumb (2000) calculates V-band zero magnitude spectral energy distributions (SEDs) for a range of spectral types and convolves the SEDs with a model of the detector/optical blocking filter optical response. With appropriate scaling by the observed source V-band magnitude, these estimates are used to determine the potential optical contamination. Using the estimated V-band magnitudes, the scaled optical flux (photons pixel-1 frame-1) for each detected source is estimated and presented in Table A.1. Lumb (2000) did not consider SEDs representative of AGB stars, thus, the range determined from the M0 and M8 spectral type calculations in Lumb (2000) should be considered as a crude estimate. The observed objects are likely redder and the optical flux is possibly even higher than estimated from these calculations. If each optically-generated electron contributes a charge of 3.6 eV, then a single-pixel pseudo X-ray event of 0.15 keV would be generated from a scaled optical flux of 42 photons pixel-1 frame-1.
Individually, the brightest stars with V-band magnitudes ~6 have predicted optical fluxes (>42 photons pixel-1 frame-1) that are consistent with optically-generated pseudo X-ray events. This suspicion is further confirmed by the energy spectrum for single (pattern 0) and double events (patterns 1 − 4) depicted in Fig. A.1. These spectra demonstrate that the single pixel events peak at ~0.15 keV, while the double events peak around 0.3 keV, or twice that of the single events. This behavior is consistent with both piled-up X-ray photons from a high-rate source of soft X-ray photons, and the optically-generated electron clouds of a visually bright source. However, few X-ray sources are as sharply peaked as that of W Cyg at the energy resolution of XMM/EPIC, thus the absence of a continuum casts doubt on the veracity of the detected X-ray events. Comparison with the slew detection of the high-rate, soft, X-ray emitting WD, HZ 43 (see Fig. A.1, Slew Survey Source: XMMSL1 J131621.7+290553, ObsID: 9083100004, Obs. Date: 2004-06-23), confirms this suspicion. The single events in the authentic X-ray source associated with HZ 43 appear at higher energies, whereas the pseudo events vanish. We therefore conclude that the XMM slew sources associated with our sample objects are due entirely to optical loading by the visually bright red AGB stars.
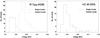 |
Fig. A.1
Energy distributions of the slew survey-detected sources of the AGB star W Cyg and WD HZ 43. Single events (pattern number 0, solid lines) are the most reliable events in an XMM X-ray source, while double events (pattern numbers 1−4, dashed lines) are events with charge spread over two pixels. The distribution of single and double events in HZ 43 is the expected distribution for a soft and bright X-ray source, whereas the distributions exhibited by W Cyg and the other AGB stars detected in the slew survey (L2 Pup, R Dor, and R Leo), are indicative of optical loading from these bright red stars. |
| Open with DEXTER | |
A.1. Origin of the X-ray emission detected from SS Vir
The detection of SS Vir is highly suspect because it falls on the edge of the FOV, in a region that is normally discarded from science-quality data products, but which may be exposed. The background-subtracted count rate of SS Vir is 4.8 ± 1.3 counts ks-1 in the 0.2 − 2 keV energy range. The soft spectrum of the source is similar to that seen from the slew sources, thus, as described above, the possibility of optical loading of the SS Vir observation must be investigated. The visual magnitude determined from the AAVSO observations of SS Vir at the time of the XMM observation (see Table A.1) suggests SS Vir was clearly bright enough to cause optical loading in the thin optical blocking filter observation. The energy distributions of the high-quality and bad events do not display the high-energy tails seen in the optically loaded slew sources (e.g. Fig. A.1); however, the detector optical loading response for bright, red optical sources in this region of the detector is unknown.
Appendix B: Hydrogen column densities estimated from 21 cm-observations
We have compared the results of the equation given by Kastner & Soker (2004a) (their Eq. (1)) to estimates from measurements of the 21 cm-emission of atomic hydrogen around AGB stars (Gérard & Le Bertre 2006; Matthews et al. 2011) by calculating the hydrogen column densities from the estimated mass and extent of the emission, assuming an r-2-density distribution (Fig. B.1). Some sources will be missing at the low NH end of the plot because in low-temperature, high-mass-loss rate AGB stars most of the gas will be in molecular form. Both estimates have substantial uncertainties, and although there is a large scatter around the one-to-one-correlation, there is no indication that the equation systematically overestimates the hydrogen column density as suggested by Kastner & Soker (2004a).
 |
Fig. B.1
Hydrogen column densities estimated from 21 cm-observations (Gérard & Le Bertre 2006; Matthews et al. 2011) compared to estimates from the mass-loss rate. |
| Open with DEXTER | |
© ESO, 2012
Current usage metrics show cumulative count of Article Views (full-text article views including HTML views, PDF and ePub downloads, according to the available data) and Abstracts Views on Vision4Press platform.
Data correspond to usage on the plateform after 2015. The current usage metrics is available 48-96 hours after online publication and is updated daily on week days.
Initial download of the metrics may take a while.