| Issue |
A&A
Volume 536, December 2011
Planck early results
|
|
|---|---|---|
| Article Number | A22 | |
| Number of page(s) | 24 | |
| Section | Interstellar and circumstellar matter | |
| DOI | https://doi.org/10.1051/0004-6361/201116481 | |
| Published online | 01 December 2011 | |
Online material
Appendix A: Selected sources, illustration of detection method, source elongation and observational parameters
We list below the main features of the selected fields as known based on previous studies.
S1 lies in a tenuous high-latitude cloud, MCLD 126.5+24.5, located at the border of the Polaris Flare, a large molecular cirrus cloud in the direction of the north celestial pole (Heithausen & Thaddeus 1990), at an estimated distance of 150pc (Bensch et al. 2003). The cloud was first noted from the POSS prints by Lynds (1965) as the small reflection nebula LBN 628. Its cometary globule shape appears similar to what is usually found in active star formation regions, although this nebula is far from any such region. Boden & Heithausen (1993) have studied the gas properties of the densest part of the cloud, observing transition lines of the dense tracors 12CO, 13CO, H2CO, and NH3. The ammonia core (~0.14 pc × 0.07 pc) corresponds to 0.2 M⊙ and a density of 4000 cm-3. Although this density is high compared to the cirrus-like environment, Boden & Heithausen (1993) find that both the cloud and the core are probably gravitationally unbound. The line ratios found are consistent with shocked gas being compressed by the North Celestial Pole Hi loop (Kramer et al. 1998).
S2 is embedded in the tail (~30′ south) of the well-studied cometary globule CG12. This isolated globule is located at high Galactic latitude (l = 316.5°,b = 21.2°), with a 1° long nebular tail nearly perpendicular to the Galactic Plane. Its distance of 550pc has been determined using a photometry-extinction method by Maheswar et al. (2004). Molecular studies using 12CO (van Till et al. 1975; White 1993; Yonekura et al. 1999), C18O (Haikala et al. 2006), H2CO (Goss et al. 1980) and NH3(Bourke et al. 1995) reveal star formation activity, with the presence of a highly collimated bipolar outflow in the head of the cloud. CG12 seems to be a rare example of triggered star formation at relatively large Galactic height (Maheswar et al. 2004).
S3 is located in the constellation of Cassiopeia and has no counterpart in the SIMBAD database. On the sky, the closest Lynds catalogue sources are LDN 1358 and LDN 1355, which are, respectively, at distances of 114 and 118′. These Lynds sources are associated with the Cepheus flare at a distance of 200 ± 50pc (Obayashi et al. 1998; Kauffmann et al. 2008). The Planck detection is associated with an AKARI FIS bright source catalogue source that has a cirrus type spectrum (Yamamura 2008).
S4 is in the Orion region, within a dark cloud that was mapped by Dobashi et al. (2005) in extinction, derived from Digitized Sky Survey images. The source is located six degrees east of the M42 nebula, in the Dobashi et al. cloud 1490, close to its clump P43. It has not been the subject of any dedicated studies, so far. In higher resolution extinction images derived from the colour excess of 2MASS stars, the cloud is seen to reside within a narrow filament. In the Planck data, the filament is clearly visible, but remains unresolved. The source itself is a compact, slightly elongated clump that stands out just as well in the individual Planck frequency maps as in the cold residual map. The Nanten CO data show a peak at the same position, with a line intensity close to 20K km s-1.
S5 is a filamentary structure located near the Vela Molecular Ridge (hereafter VMR), a giant molecular cloud complex in the outer Galaxy. Murphy & May (1991) mapped the VMR in CO, but the mapping did not cover S5. However, Otrupcek et al. (2000) carried out CO observations of the dark cloud DCld 276.9+01.7, with angular extent of 16′ by 3′, and this is interposed on the filament. The detected CO line is rather strong ( K), with a velocity (relative to the local standard of rest) of ~2 km s-1. We derive a kinematic distance for the cloud of ~2 kpc. This is consistent with the distance estimate of the VMR: Liseau et al. (1992) give a photometric distance of (0.7 ± 0.2)kpc for parts A, C and D of the VMR and 2kpc for part B, using the nomenclature established by Murphy & May (1991) and agreeing with their results. Thus we consider it is likely that S5 is part of the VMR. Several studies have been published on the VMR young star-forming region, for example, Olmi et al. (2009) found 141 BLAST cores (starless and proto-stellar) in the Vela-D region.
S6 has been detected in the anti-centre direction (l, b = 176.18, b = −2.11), at a distance estimated to 2kpc using the extinction signature method by Marshall et al. (2006). The filament-shaped core seen with Planck does not coincide with any known object, but is likely associated with the Perseus arm.
S7 has been observed by Ungerechts & Thaddeus (1987) as part of their large CO survey of Perseus, Taurus and Auriga. It is included in their 12th area (see their Table 1), covering 41.8deg2, with a distance of 350pc. For this large region, they estimate a virial mass that is four times higher than the CO mass, showing that this region is out of equilibrium. The Planck source is not associated with any known objects in the SIMBAD database.
S8, S9 and S10 correspond with Herschel SDP sources PCC288, PCC550 and PCC249, respectively. These fields were selected in September 2009 from the cold core detections in the First Light Survey of Planck, in order to perform the first follow-up observations of our Herschel key-program during the Herschel SDP. The fields were mapped with both PACS and SPIRE (with map sizes from 18′ to 50′), and the observations have been described in detail in dedicated papers (Juvela et al. 2010, 2011).
Field S8 is located in Cepheus, at the interface between the Cepheus F molecular cloud (Sargent 1977) and the young stellar group Cep OB3b (Jordi et al. 1996), which is one of the youngest nearby stellar groups. It has been suggestsed that this region could show direct evidence for star formation triggered by the OB association. S9 is an active star formation region close the S140 Hii region. Planck has provided two detections, PCC288-P1 and PCC288-P2 (see Juvela et al. 2010), with the southern source PCC288-P2 being the colder one. The two cores have also been identified in CS J = 1 → 0 mapping of the area by Tafalla et al. (1993). The field S10 is part of the Musca cloud filament, where Planck shows two secure detections of cold cores (T ~ 11 K). The cores have been studied previously in 13CO and C18O by Vilas-Boas et al. (1994).
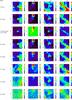 |
Fig. A.1
Multi-band emission maps (in MJy/sr) of the sources S1, S2, S3, and S4. |
| Open with DEXTER | |
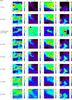 |
Fig. A.2
Multi-band emission maps (in MJy/sr) of the sources S5, S6, S7, and S8. |
| Open with DEXTER | |
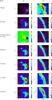 |
Fig. A.3
Multi-band emission maps (in MJy/sr) of the sources S9 and S10. |
| Open with DEXTER | |
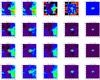 |
Fig. A.4
Illustration of the steps used in the detection and core extraction methods, as applied to source S1. The first column shows the initial surface brightness emission maps in the IRIS and HFI bands. The rows show the process applied to the 100 μm, 857, 545, and 353GHz data, respectively. As described in Paper I, the method follows the following main steps: a “Warm Ref” is built from the IRIS 100 μm map and extrapolated to the Planck bands using the local colour estimated around each pixel of the Planck map (these colour maps are shown in the second column); the “Warm Bkg” map obtained at a given frequency is then removed from the Planck map, revealing the “Cold Residual”; and finally an elliptical Gaussian fit is performed on the colour maps to derive the core size parameters, while aperture photometry is performed on the HFI bands, integrating the signal within the elliptical Gaussian. |
| Open with DEXTER | |
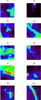 |
Fig. A.5
Comparison of the source elongation with the beam shape determined with the “FEBeCoP” tool (Mitra et al. 2011). The ellipses correspond to the size of the Planck cold clumps derived from the fit; they are plotted at a 2σ level for a better visibility. The dashed circles trace the local beam shape. |
| Open with DEXTER | |
 |
Fig. A.6
Visual extinction maps obtained from 2MASS and the NICER method (cf. Sect. 4.2). The maps are shown at 4.5′ resolution. Contours are drawn at integer values of AV. |
| Open with DEXTER | |
Observational parameters and sensitivity of IRAM observations.
© ESO, 2011
Current usage metrics show cumulative count of Article Views (full-text article views including HTML views, PDF and ePub downloads, according to the available data) and Abstracts Views on Vision4Press platform.
Data correspond to usage on the plateform after 2015. The current usage metrics is available 48-96 hours after online publication and is updated daily on week days.
Initial download of the metrics may take a while.