Fig. A.4
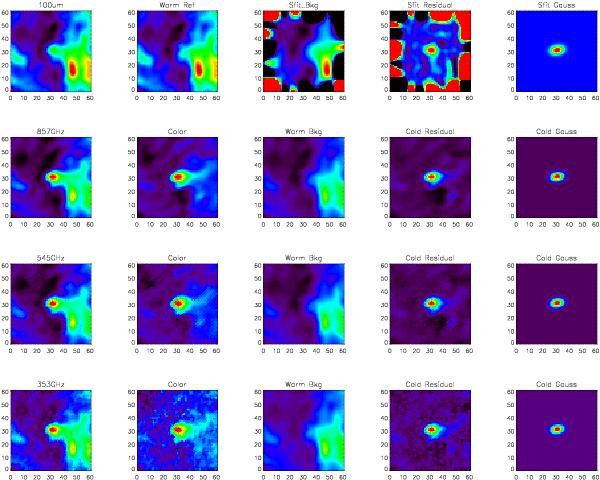
Illustration of the steps used in the detection and core extraction methods, as applied to source S1. The first column shows the initial surface brightness emission maps in the IRIS and HFI bands. The rows show the process applied to the 100 μm, 857, 545, and 353GHz data, respectively. As described in Paper I, the method follows the following main steps: a “Warm Ref” is built from the IRIS 100 μm map and extrapolated to the Planck bands using the local colour estimated around each pixel of the Planck map (these colour maps are shown in the second column); the “Warm Bkg” map obtained at a given frequency is then removed from the Planck map, revealing the “Cold Residual”; and finally an elliptical Gaussian fit is performed on the colour maps to derive the core size parameters, while aperture photometry is performed on the HFI bands, integrating the signal within the elliptical Gaussian.
Current usage metrics show cumulative count of Article Views (full-text article views including HTML views, PDF and ePub downloads, according to the available data) and Abstracts Views on Vision4Press platform.
Data correspond to usage on the plateform after 2015. The current usage metrics is available 48-96 hours after online publication and is updated daily on week days.
Initial download of the metrics may take a while.