Free Access
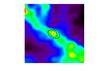
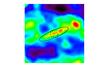
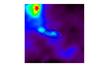
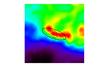
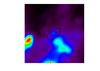
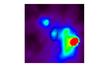
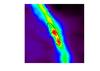
Fig. A.5
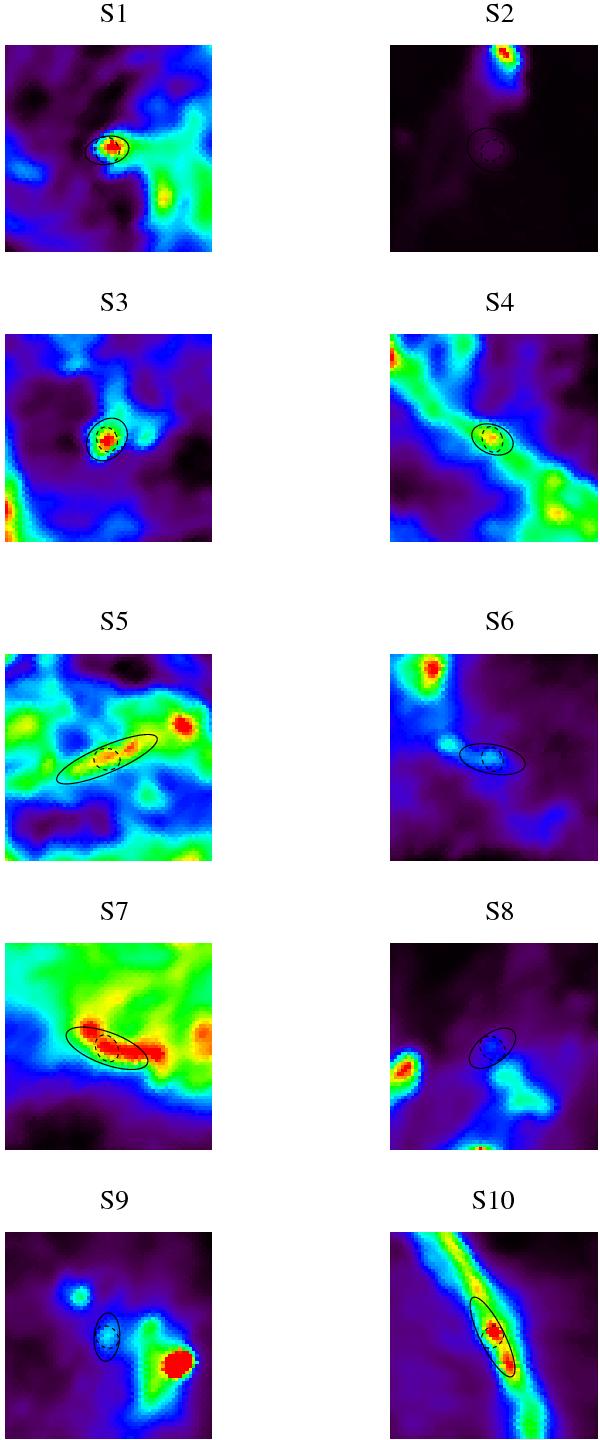
Comparison of the source elongation with the beam shape determined with the “FEBeCoP” tool (Mitra et al. 2011). The ellipses correspond to the size of the Planck cold clumps derived from the fit; they are plotted at a 2σ level for a better visibility. The dashed circles trace the local beam shape.
This figure is made of several images, please see below:
Current usage metrics show cumulative count of Article Views (full-text article views including HTML views, PDF and ePub downloads, according to the available data) and Abstracts Views on Vision4Press platform.
Data correspond to usage on the plateform after 2015. The current usage metrics is available 48-96 hours after online publication and is updated daily on week days.
Initial download of the metrics may take a while.