| Issue |
A&A
Volume 529, May 2011
|
|
|---|---|---|
| Article Number | L6 | |
| Number of page(s) | 9 | |
| Section | Letters | |
| DOI | https://doi.org/10.1051/0004-6361/201116596 | |
| Published online | 13 April 2011 | |
Online material
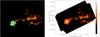 |
Fig. 1
a) Composite 3-color image of IC 5146 (~1.6 deg2 field) produced from our PACS/SPIRE parallel-mode data at 70, 160, 250, 350 and 500 μm. The color coding is such that red = SPIRE 500 μm and 350 μm, green = SPIRE 250 μm and PACS 160 μm, blue = PACS 70 μm. b) SPIRE 250 μm image of IC 5146. |
| Open with DEXTER | |
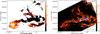 |
Fig. 2
a) Dust temperature map derived from our SPIRE/PACS observations of IC 5146. The resolution corresponds to the 36.9″ HPBW resolution of SPIRE at 500 μm.b) Curvelet component of the column density map of IC 5146 (cf. Fig. 3), in which the areas where the filaments have a mass per unit length higher than half the critical value and are thus likely gravitationally unstable have been highlighted in white. The positions of the 71 YSOs and 45 candidate bound prestellar cores identified with getsources (Men’shchikov et al. 2010) in the Herschel images are overplotted as red stars and blue triangles, respectively. Candidate bound prestellar cores were selected among a larger population of starless cores (see blue triangles in Fig. 3a) on the basis of a comparison of the core masses with local values of the Jeans or Bonnor-Ebert mass (see Sect. 4.1 of Könyves et al. 2010,for details). Note the excellent correspondence between the spatial distribution of the prestellar cores and the supercritical filaments, which agrees with our earlier results in Aquila and Polaris (see Fig. 1 of André et al. 2010). |
| Open with DEXTER | |
Summary of derived parameters for the 27 filaments of IC 5146.
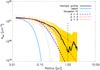 |
Fig. 5
Mean radial column density profile in log-log format of the subcritical filament labeled 14 in Fig. 3b (western side). Given the relatively high dispersion of the radial profile along the filament (shown in yellow), the power-law behavior at large radii is less clear in this subcritical case than for the supercritical filament shown in Fig. 4c. |
| Open with DEXTER | |
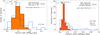 |
Fig. 6
a) Distribution of deconvolved FWHM widths for the 27 filaments of IC 5146 (black solid histogram, filled in orange). These widths have been deconvolved from the 36.9″ HPBW resolution of the column density map (Fig. 3a) used to construct the radial profiles of the filaments. The median width is 0.10 pc and the standard deviation of the distribution is 0.03 pc. The black dotted histogram shows the distribution of deconvolved FWHM widths measured on the SPIRE 250 μm map, which has a factor ~2 better resolution (18.1″ HPBW). This distribution is statistically indistinguishable from the distribution obtained at 36.9″ resolution. The two down-pointing arrows in the upper left mark the resolution limits for the distributions at 36.9″ and 18.1″, i.e., 0.08 pc and 0.04 pc, respectively.For comparison, the blue dashed histogram represents the distribution of central Jeans lengths corresponding to the central column densities of the filaments. b) Distributions of deconvolved FWHM widths for a larger sample of 90 filaments, combining the 27 filaments of IC 5146, 32 filaments in Aquila, and 31 filaments in Polaris, all analyzed in the same way from column density maps with 36.9″ resolution as explained in Sect. 3 and Sect. 4. The black solid histogram, filled in orange, is based on our default distance assumptions: 460 pc for IC 5146, 260 pc for Aquila, and 150 pc for Polaris. This distribution has a median of 0.10 pc and a standard deviation of 0.03 pc. The horizontal double arrow at the upper left shows the range of HPBW resolution limits, going from ~0.03 pc for Polaris to ~0.08 pc for IC 5146.The dotted histogram shows an alternate distribution of deconvolded widths for the same sample of filaments based on other distance assumptions: 950 pc for IC 5146 (see Appendix A), 400 pc for Aquila (see discussion in Bontemps et al. 2010, and the appendix of André et al. 2010), and 150 pc for Polaris. The median value of this alternate distribution is 0.15 pc and the standard deviation is 0.08 pc. For comparison, the blue dashed histogram represents the distribution of central Jeans lengths corresponding to the central column densities of the 90 filaments (independent of distance). |
| Open with DEXTER | |
Appendix A: Effects of distance and dust opacity uncertainties and influence of the viewing angle
There is some ambiguity concerning the distance to IC 5146. The default distance adopted in this paper corresponds to the value of  pc derived from star counts by Lada et al. (1999). However, other studies placed the IC 5146 cloud at a distance of 950 ± 80 pc based on photometry and spectra of late-B stars in the IC 5146 cluster (e.g. Harvey et al. 2008). If the true distance of IC 5146 were ~950 pc instead of ~460 pc, then the widths of the IC 5146 filaments would all be a factor of ~2 larger than the values listed in Col. 6 of Table 1, leading to a median width of 0.2 ± 0.06 pc instead of 0.1 ± 0.03 pc. This would also broaden the distribution of FWHM widths for the combined sample of 90 filaments in IC 5146, Aquila, and Polaris (see dotted histogram in Fig. 6b). As can be seen in Fig. 6b, our main result, i.e. that the typical filament width is ~0.1 pc to within a factor of ~2, would nevertheless remain valid. We also stress that the distance uncertainty has no effect on the shape of the radial column density profiles (Sect. 3.2 and Fig. 4) or on the absence of an anti-correlation between filament width and central column density in Fig. 7.
The following (temperature-independent) dust opacity law was assumed in our analysis of the Herschel data: κν = 0.1 × (ν/1000 GHz)2 cm2/g, where ν denotes frequency and κν is the dust opacity per unit (gas + dust) mass column density. This dust opacity law is very similar to that advocated by Hildebrand (1983) at submillimeter wavelengths, and is consistent with the mean value κ850μ ≈ 0.01 cm2/g derived by Kramer et al. (2003) in IC 5146 from a detailed comparison of their SCUBA 850 μm and 450 μm data with the near-infrared extinction map of Lada et al. (1999). However, Kramer et al. (2003) found evidence of an increase in the dust opacity κ850μ by a factor of ~ 4 when the dust temperature Td decreased from ~ 20 K to ~ 12 K, which they interpreted as the manifestation of dust grain
evolution (e.g. coagulation and formation of ice mantles) in the cold, dense interior of the cloud. The dust temperature map derived from Herschel data (see Fig. 2a) suggests that Td ranges from ~ 11 K to ~ 17 K in the bulk of IC 5146, with the exception of the PDR region associated with the Cocoon Nebula, where Td reaches ~ 30 K. Assuming a linear increase in κν by a factor of 4 when Td decreases from ~ 20 K to ~ 12 K as suggested by the Kramer et al. (2003) study, we estimate that the column density map shown in Fig. 3a is accurate to better than a factor of ~ 2 over most of its extent. The possible dependence of κν on temperature has very little impact on our analysis of the filament profiles. For filament 6, for instance, Td decreases by less than ~ 3 K from the exterior to the interior of the filament (see Fig. 4b), suggesting that κν does not change by more than ~ 40% from large to small radii. The potential effect on the estimated FWHM width, W, and power-law index, p, of the filament profiles is even smaller: W would increase, and p would decrease, by less than ~ 3% and ~ 7%, respectively.
Our Herschel observations only provide information on the projected column density profile 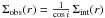 of any given filament, where i is the inclination angle to the plane of the sky and Σint is the intrinsic column density profile of the filament. For a population of randomly oriented filaments with respect to the plane of the sky, the net effect is that Σobsoverestimates Σint by a factor
  on average. This does not affect our analysis of the shape of the radial column density profiles (Sect. 3.2), but implies that the central column densities of the filaments are actually ~ 60% lower on average than the projected values listed in Col. 2 of Table 1. Likewise, the observed masses per unit length (Col. 12 of Table 1) tend to overestimate the true masses per unit length of the filaments by ~ 60% on average. Although systematic, this inclination effect remains less than a factor of 2 and thus has little impact on the classification of observed filaments in thermally subcritical and thermally supercritical filaments.
© ESO, 2011
Current usage metrics show cumulative count of Article Views (full-text article views including HTML views, PDF and ePub downloads, according to the available data) and Abstracts Views on Vision4Press platform.
Data correspond to usage on the plateform after 2015. The current usage metrics is available 48-96 hours after online publication and is updated daily on week days.
Initial download of the metrics may take a while.