Fig. 6
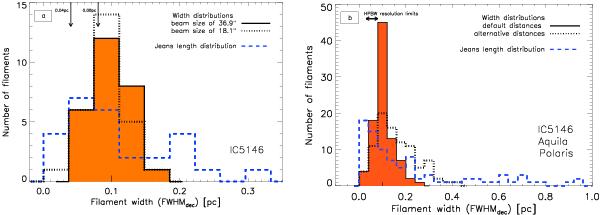
a) Distribution of deconvolved FWHM widths for the 27 filaments of IC 5146 (black solid histogram, filled in orange). These widths have been deconvolved from the 36.9″ HPBW resolution of the column density map (Fig. 3a) used to construct the radial profiles of the filaments. The median width is 0.10 pc and the standard deviation of the distribution is 0.03 pc. The black dotted histogram shows the distribution of deconvolved FWHM widths measured on the SPIRE 250 μm map, which has a factor ~2 better resolution (18.1″ HPBW). This distribution is statistically indistinguishable from the distribution obtained at 36.9″ resolution. The two down-pointing arrows in the upper left mark the resolution limits for the distributions at 36.9″ and 18.1″, i.e., 0.08 pc and 0.04 pc, respectively.For comparison, the blue dashed histogram represents the distribution of central Jeans lengths corresponding to the central column densities of the filaments. b) Distributions of deconvolved FWHM widths for a larger sample of 90 filaments, combining the 27 filaments of IC 5146, 32 filaments in Aquila, and 31 filaments in Polaris, all analyzed in the same way from column density maps with 36.9″ resolution as explained in Sect. 3 and Sect. 4. The black solid histogram, filled in orange, is based on our default distance assumptions: 460 pc for IC 5146, 260 pc for Aquila, and 150 pc for Polaris. This distribution has a median of 0.10 pc and a standard deviation of 0.03 pc. The horizontal double arrow at the upper left shows the range of HPBW resolution limits, going from ~0.03 pc for Polaris to ~0.08 pc for IC 5146.The dotted histogram shows an alternate distribution of deconvolded widths for the same sample of filaments based on other distance assumptions: 950 pc for IC 5146 (see Appendix A), 400 pc for Aquila (see discussion in Bontemps et al. 2010, and the appendix of André et al. 2010), and 150 pc for Polaris. The median value of this alternate distribution is 0.15 pc and the standard deviation is 0.08 pc. For comparison, the blue dashed histogram represents the distribution of central Jeans lengths corresponding to the central column densities of the 90 filaments (independent of distance).
Current usage metrics show cumulative count of Article Views (full-text article views including HTML views, PDF and ePub downloads, according to the available data) and Abstracts Views on Vision4Press platform.
Data correspond to usage on the plateform after 2015. The current usage metrics is available 48-96 hours after online publication and is updated daily on week days.
Initial download of the metrics may take a while.