Fig. 1
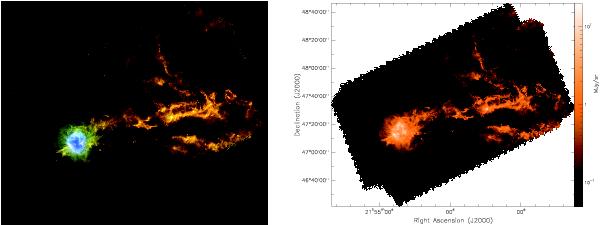
a) Composite 3-color image of IC 5146 (~1.6 deg2 field) produced from our PACS/SPIRE parallel-mode data at 70, 160, 250, 350 and 500 μm. The color coding is such that red = SPIRE 500 μm and 350 μm, green = SPIRE 250 μm and PACS 160 μm, blue = PACS 70 μm. b) SPIRE 250 μm image of IC 5146.
This figure is made of several images, please see below:
Current usage metrics show cumulative count of Article Views (full-text article views including HTML views, PDF and ePub downloads, according to the available data) and Abstracts Views on Vision4Press platform.
Data correspond to usage on the plateform after 2015. The current usage metrics is available 48-96 hours after online publication and is updated daily on week days.
Initial download of the metrics may take a while.