| Issue |
A&A
Volume 528, April 2011
|
|
|---|---|---|
| Article Number | A26 | |
| Number of page(s) | 22 | |
| Section | Interstellar and circumstellar matter | |
| DOI | https://doi.org/10.1051/0004-6361/201015837 | |
| Published online | 22 February 2011 | |
Online material
Appendix A: Density diagnostic
In this section we study the influence of collisional rates on the modeling of the SiO and SiS lines observed in our line survey of Orion. Although most of the emission in Orion arises from regions of high volume density, the intensity of the high-velocity wings apparent in the SiO and SiS line profiles arise from a region, the plateau, in which the density is not enough to thermalize the rotational levels of high dipole moment molecules such as SiO (3.1 D) and SiS (1.73 D). Collisional rates are then needed for each species to derive the physical conditions. For SiO previous calculations by Green and collaborators (Bieniek & Green 1983; Turner et al. 1992; see http://www.giss.nasa.gov/data/mcrates#sio) have provided collisional rates for this molecule and temperatures 20−1500 K. These collisional rates have been recalculated using a new SiO-p-H2 surface by Dayou & Balança (2006). However, no collisional rates were available of SiS until recently: Vincent et al. (2007) and Klos & Lique (2008) have calculated the state-to-state collisional rates for the system SiS-He and SiS-H2, respectively.
We tested the influence of collisional rates on the modeling of the SiO and SiS lines observed in our line survey of Orion. Using the recent rates quoted above we computed line-intensity ratios between some transitions to provide tools for estimating the physical conditions in astrophysical sources. We covered volume densities between 102−109 cm-3 and kinetic temperatures from 10 to 300 K including levels up to J = 20 for SiO and J = 40 for SiS. In the following, we analyze the excitation conditions for 1 → 0, 2 → 1, 3 → 2, 5 → 4, 12 → 11, and 19 → 18 for both molecules.
A.1. SiO
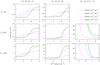 |
Fig. A.1
Intensity ratio between two transitions for SiO as a function of H2 density with the SiO column densities equal to 1012, 1013, 1014, and 1015 cm-2 and temperatures from 10 K to 100 K. |
| Open with DEXTER | |
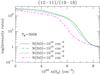 |
Fig. A.2
Same as A.1 but for T = 300 K. |
| Open with DEXTER | |
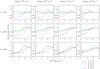 |
Fig. A.3
Comparison of the line intensities predicted using two different sets of collisional rates (see text) for different lines, column densities, and densities. |
| Open with DEXTER | |
The line-intensity ratios for SiO are shown in Figs. A.1 (kinetic temperature between 10 and 100 K) and A.2 (for a temperature of 300 K). In Fig. A.1 we notice that the intensity ratio TB(3 → 2)/TB(2 → 1) is particularly sensitive to densities of about 104 to 106 cm-3, whereas for TB(5 → 4)/TB(1 → 0) it shows important variations in the density range 106 to 107 cm-3. Using the intensity ratio TB(5 → 4)/TB(12 → 11), we can explore density values around 107−5 × 108 cm-3. For TK = 300 K and TB(12 → 11)/TB(19 → 18), we can trace densities above 105 cm-3, as seen in Fig. A.2. For lower densities, the 19−18 line will be very weak.
To illustrate this point, we deduce the intensity ratio TB(2 → 1)/TB(3 → 2) of SiO from our observations, and find ≃ 2.6 (see Table 2), which corresponds, depending on the column density and for TK = 100 K, on densities between 105.5 and 107 cm-3. Our results for the physical parameters of the different cloud components discussed in previous sections are given in Table 4.
The collisional rates calculated by Turner et al. (1992) have been used in the past to describe collisions of SiO molecules with H2. We used the new rates of Dayou & Balança (2006) throughout this paper. As a first step in modeling SiO emission in warm clouds, we compared the results using both sets of collisional rates for a wide range of physical conditions: TK = 10−300 K, N(SiO) = 1012−1015 cm-2, and n(H2) = 1−109 cm-3. Figure A.3 shows the brightness temperature (TB) ratio (predictions using the Dayou & Balança 2006 rates over those obtained from Turner et al. 1992 rates) as a function of H2 density for different values of the SiO column density and temperature and for the six first transitions of this molecule. The plots in Fig. A.3 show that the difference in the predicted line intensities between both sets of collisional rates never exceed 40% (J = 6−5 line), because it is always below 20% for all other rotational lines and kinetic temperatures. The lowest temperature for the collisional rates of Turner et al. (1992) is 20 K. We have extrapolated these rates to obtain the corresponding ones at 10 K. For most transitions the predicted line intensities from the Dayou & Balança (2006) rates are lower than those predicted from Turner et al. (1992) rates for densities below ≃ 105 cm-3. Although the differences in line intensities are not significant for determining the physical properties of the emitting gas in interstellar clouds, we adopted in our SiO calculations the new rates of Dayou & Balança (2006).
A.2. SiS
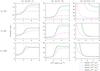 |
Fig. A.4
Intensity ratio between two transitions for SiS as a function of H2 density with the SiS column density equal to 1012, 1013, 1014, and 1015 cm-2. |
| Open with DEXTER | |
 |
Fig. A.5
Same as A.4 but for T = 300 K. |
| Open with DEXTER | |
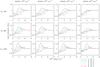 |
Fig. A.6
Same as A.3 for SiS with the SiS column density equal to 1012, 1013, 1014, and 1015 cm-2. |
| Open with DEXTER | |
We performed the same study for SiS using the rates calculated by Vincent et al. (2007). Figures A.4 and A.5 show our results. We observe the same trends as for SiO, but for lower densities. Thus, the TB(3 → 2)/TB(2 → 1) ratio increases in the density range 103 to 105 cm-3, the second one TB(5 → 4)/TB(1 → 0) in 104 to 105 cm-3, and the last graphs of Fig. A.4 show that TB(5 → 4)/TB(12 → 11) varies mostly between 105 and a few 106 cm-3. In Fig. A.5, we can see that for TK = 300 K, TB(12 → 11)/TB(19 → 18) are useful for densities around 105 cm-3. Two of those lines have been detected in our survey, the transitions 5 → 4 and 12 → 11, with an intensity ratio of ≃ 0.12. For TK = 100 K we can derive a volume density ≃ 105.5 cm-3.
Before 2007, no collisional data was available for SiS, so most authors have adopted the SiO collisional rates for SiS. As quoted above, the system SiS-He has been studied by Vincent et al. (2007). Lique et al. (2008) have compared these rates with the correspondings for the SiS-H2 system. They show that, when scaled by the square root of the collision reduced mass, the SiS-He rates were a reasonable approximation to describe collisions with H2. We have updated the LVG code by adding the new SiS-He and SiS-H2 rates. We calculated the line intensities and compared the results to those obtained with rates for SiO from Turner et al. (1992) (multiplied by a factor 2 to take the larger geometrical size of the SiS molecule into account). Figure A.6 shows the line intensity ratio (brightness temperature obtained with rates from Vincent et al. 2007 over those calculated with rates from Turner et al. 1992) as a function of n(H2) for the first six rotational transitions. The discrepancies in the line intensities between the two cases do not exceed 50%. As for SiO, we notice that the differencies between the two sets of collisional rates are the same for all column densities: the line intensity predicted with rates for SiS are lower than those predicted from Turner et al. (1992) rates for densities up to ≃ 103. These differences are quite small and do not affect the determination of the physical parameters performed by authors who previously used the Turner et al. (1992) rates in their models to interpret SiS observations. We also tried to describe SiS excitation by collisions with the rate coefficients for the system CS-He from Green & Chapman (1978) with an appropriate scaling factor. The predicted intensities show reasonable agreement with those derived from SiS-He or SiS-H2 collisional rates. These results show that, with the actual calibration accuracy for the SiS observations, determination of the properties of the emitting gas is not very sensitive to small differences in collisional rates. It is a rather curious result that the predicted line intensities with both sets of collisional rates, deduced from two different potential energy surfaces, moreover, with different propensity rules, produce similar intensity ratios (when the scaling factor is adequately selected). Determining the SiS column densities, we used the SiS-H2 rates (Klos & Lique 2008), although no significant differences were found when we used the SiS-He ones.
To better quantify the effects of the use of scaled SiO-He rates in predicting SiS intensities, we considered a case in which the lines are optically thin, for instance, n(H2) = 105 cm-3, TK = 40 K, and N(SiS) = 3 × 1012 cm-2. The predicted line intensities from SiS-He rates are TB(2 → 1, 4 → 3, 6 → 5) = 0.08,
0.26, 0.33 K. To obtain these results from scaled SiO-He rates, we need a density of 7 × 104 cm-3, or must reduce the scaling factor from 2 to ≃ 1.5, i.e., an error lower than two in density.
We compared predictions from the SiS-He rates with those obtained from the SiS-H2 rates and found insignificant variation between both.
Appendix B: Online figures
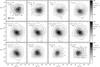 |
Fig. B.1
Integrated intensity of the J = 5−4 transition of SiO at different velocity ranges (indicated at the top of each panel). In some panels, the integrated intensity of the maps has been multiplied by a scale factor (indicated in the panels) to maintain the same color dynamics for all maps. The step in integrated intensity ( |
| Open with DEXTER | |

 |
Fig. B.2
Observed lines (histogram spectra) and model (thin curves) of 29SiS and SiS v = 1. The dashed line shows a radial velocity at 13.5 km s-1. |
| Open with DEXTER | |
 |
Fig. B.3
Observed lines of different molecules at a position (−15′′, 15′′) offset IRc2. The dashed line shows a radial velocity at 15.5 km s-1. |
| Open with DEXTER | |
 |
Fig. B.4
Observed lines (histogram spectra) and model (thin curves) of SiN. |
| Open with DEXTER | |
Appendix C: Online tables
SiO and SiO isotopologs velocity components.
SiS velocity components.
Molecular abundances.
© ESO, 2011
Current usage metrics show cumulative count of Article Views (full-text article views including HTML views, PDF and ePub downloads, according to the available data) and Abstracts Views on Vision4Press platform.
Data correspond to usage on the plateform after 2015. The current usage metrics is available 48-96 hours after online publication and is updated daily on week days.
Initial download of the metrics may take a while.