| Issue |
A&A
Volume 523, November-December 2010
|
|
|---|---|---|
| Article Number | A23 | |
| Number of page(s) | 46 | |
| Section | Galactic structure, stellar clusters and populations | |
| DOI | https://doi.org/10.1051/0004-6361/201015243 | |
| Published online | 11 November 2010 | |
Online material
Properties of OB associations.
Appendix A: Color–magnitude and color–color diagrams of the associations
 |
Fig. A.1
Color–magnitude diagrams of all groups listed in Garcia et al. (2009)’s catalog. Green dots in the background represent the complete list of targets with good photometric quality data in IC 1613. Blue circles represent the OB candidate stars of the associations, and red circles other members. Lejeune & Schaerer (2001)’s 0.2 Z⊙ isochrones are included for reference, shifted to account for distance (DM = 24.27) and foreground reddening E(B−V) = 0.02. Different colors represent different log age, as indicated in the legend. |
| Open with DEXTER | |
 |
Fig. A.1
continued. |
| Open with DEXTER | |
 |
Fig. A.1
continued. |
| Open with DEXTER | |
 |
Fig. A.1
continued. |
| Open with DEXTER | |
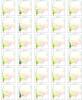 |
Fig. A.1
continued. |
| Open with DEXTER | |
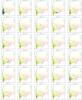 |
Fig. A.1
continued. |
| Open with DEXTER | |
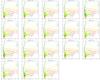 |
Fig. A.1
continued. |
| Open with DEXTER | |
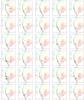 |
Fig. A.2
Q vs. Vcorr color–magnitude diagrams of all groups listed in Garcia et al. (2009). Colored lines represent the theoretical isochrones with the same age code as in Fig. A.1, shifted by the DM, but without any correction for foreground extinction. Black diamonds represent V-magnitudes of the blue members, corrected from total extinction (foreground and local). Red circles represent the red members. These diagrams were used for age and mass determinations. |
| Open with DEXTER | |
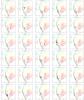 |
Fig. A.2
continued. |
| Open with DEXTER | |
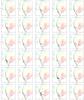 |
Fig. A.2
continued. |
| Open with DEXTER | |
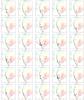 |
Fig. A.2
continued. |
| Open with DEXTER | |
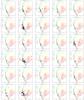 |
Fig. A.2
continued. |
| Open with DEXTER | |
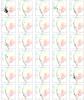 |
Fig. A.2
continued. |
| Open with DEXTER | |
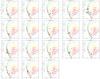 |
Fig. A.2
continued. |
| Open with DEXTER | |
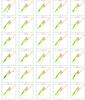 |
Fig. A.3
U−B vs. Q color–color diagrams of the associations, using the same color code as in Fig. A.1. Theoretical isochrones are included for reference. Since no extinction correction was applied, the lines mark the locus of an unreddened population. A population parallel to the isochrones but shifted indicates reddening. Note that the isochrones of all ages overlap. This provides further supporting evidence for the selection criteria (Q < −0.4) to find candidate blue massive stars used in Garcia et al. (2009). |
| Open with DEXTER | |
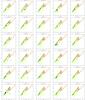 |
Fig. A.3
continued. |
| Open with DEXTER | |
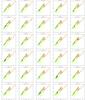 |
Fig. A.3
continued. |
| Open with DEXTER | |
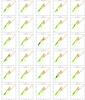 |
Fig. A.3
continued. |
| Open with DEXTER | |
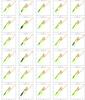 |
Fig. A.3
continued. |
| Open with DEXTER | |
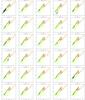 |
Fig. A.3
continued. |
| Open with DEXTER | |
 |
Fig. A.3
continued. |
| Open with DEXTER | |
 |
Fig. A.4
B−V vs. U−B color–color diagrams. Color codes for points are the same as in Fig. A.1. The red line indicates the reddening vector for O3-O9 stars. The other lines are the calibration of color with spectral type of Allen (2000) for O5-M5 main sequence stars (green), G5-M5 giants (blue) and O3-M5 supergiants (pink). |
| Open with DEXTER | |
 |
Fig. A.4
continued. |
| Open with DEXTER | |
 |
Fig. A.4
continued. |
| Open with DEXTER | |
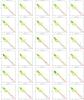 |
Fig. A.4
continued. |
| Open with DEXTER | |
 |
Fig. A.4
continued. |
| Open with DEXTER | |
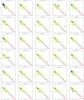 |
Fig. A.4
continued. |
| Open with DEXTER | |
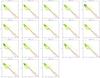 |
Fig. A.4
continued. |
| Open with DEXTER | |
Appendix B: On the systematics of automatic methods to build OB association catalogs
In this work, we have found an average size of OB associations of ~40 pc, with the peak of the distribution ranging from 14 pc to 42 pc. This figure is half the universal size of associations proposed by Efremov et al. (1987) and Ivanov (1991): 80 pc. The accepted paradigm of massive star formation is evolving and the concept of OB association is changing to that of a scale-free global distribution, hence the concept of universal size is now meaningless. However, it is reasonable to expect that objective automatic methods following the same philosophy of searching for OB clusterings would lead to similar results. Ivanov (1996) found an average size of roughly 80 pc from the average of an heterogenous set of data including IC 1613, other irregular galaxies (NGC 6822, Pegasus, Sextans A, GR 8, Ho IX) and nearby spirals (M 31, M 33). Bresolin et al. (1998) analyzed HST-WFPC2 data for 7 spirals, and found the same value. Bresolin et al. (1996) finds very similar association size distributions in LMC, SMC, M 33, NGC 6822, and M 101, with a peak in the range 40–80 pc and a mean size of 90 pc. These works produced larger values than derived here by a factor of 2.
In this section, we explore the reason for our different typical sizes. Obviously, the adopted minimum number of OB members plays an important role. Bastian et al. (2007) show that there is also a correlation of the resulting association sizes with another free parameter of the method, the search distance (DS see Paper I), or maximum distance between two association neighbors: the smaller DS, the smaller the resulting associations. Nevertheless, we suspect the differences are largely related to the instrumental set-up used to build the input photometric catalogs and the distance to the subject galaxy. Pietrzyński et al. (2001, 2005) already pointed out that the typical sizes derived for the OB associations in the Sculptor Group (NGC 300 and NGC 7793 galaxies) are larger than in the Local Group.
We considered the dependence of the results of friends-of-friends based analyses on two instrumental parameters: spatial resolution (Fig. B.1) and the faintest V-magnitude reached in the photometric input catalog (Fig. B.2).
There is a strong dependence of the mean size of the found associations on the spatial resolution of the detector. To perform a comparison consistently, we translated the pixel scale into parsecs per pixel (pc/px) so as to represent the same physical length in all galaxies. As the parsecs per pixel increase (either because of poorer detector spatial resolution or because the galaxy is farther away), the average diameter increases (Fig. B.1).
The limiting magnitude of the observations strongly affects the number of associations found by the automatic algorithms, as shown in Fig. B.2. (The galaxies studied in Bresolin et al. 1998 are not included in this plot since information about neither the faint limit nor the length of exposures is provided. The work of Ivanov 1996 was also not considered, as the input photometry does not cover entirely the galaxies.) More associations are found when the input catalog of stars is deeper. When several works are available for the same galaxy and their limit V-magnitude is different, DS is smaller in the deeper catalog. This is a consequence of the increased stellar density in the deeper catalog with more detections. Consequently, the smaller OB associations are found in the catalog with the faintest limit.
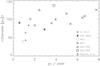 |
Fig. B.1
The typical size of the associations found in a galaxy increases as the relative spatial resolution of the detector is poorer. To use a homogeneous scale, for each galaxy-detector combination we convert the pixel scale into parsecs per pixel. Different symbols indicate different galaxies: IC 1613 (Garcia et al. 2009; Borissova et al. 2004; Ivanov 1996), NGC 6822 (Wilson 1992; Ivanov 1996), M 33 (Wilson 1991), M 31 (Magnier et al. 1993; Ivanov 1996), NGC 300 (Pietrzyński et al. 2001), NGC 7793 (Pietrzyński et al. 2005), and the sample of spiral galaxies of Bresolin et al. (1998). |
| Open with DEXTER | |
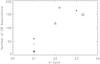 |
Fig. B.2
The number of associations found in a galaxy increases as the input catalog is deeper. Symbols as in Fig. B.1. (The sample of Bresolin et al. 1998 is not included because they provided no information about Vlimit. The sample of Ivanov 1996 is not included, as the input photometric catalogs do not cover the entire galaxies.) |
| Open with DEXTER | |
Hence, there is compelling evidence that the mean size of the associations found by friends-of-friends algorithms depends strongly on instrumental parameters, the faint limit, and the relative resolution (parsec scale) of the detector. This is not a new result, only a reflection of what already happened when working by eye on photographic plates. Automatic objective methods such as friends of friends algorithms can still play a crucial role in ensuring consistent and comparable studies of OB associations, as long as they use an equivalent instrumental set-up or take these effects into account.
© ESO, 2010
Current usage metrics show cumulative count of Article Views (full-text article views including HTML views, PDF and ePub downloads, according to the available data) and Abstracts Views on Vision4Press platform.
Data correspond to usage on the plateform after 2015. The current usage metrics is available 48-96 hours after online publication and is updated daily on week days.
Initial download of the metrics may take a while.