Fig. A.2
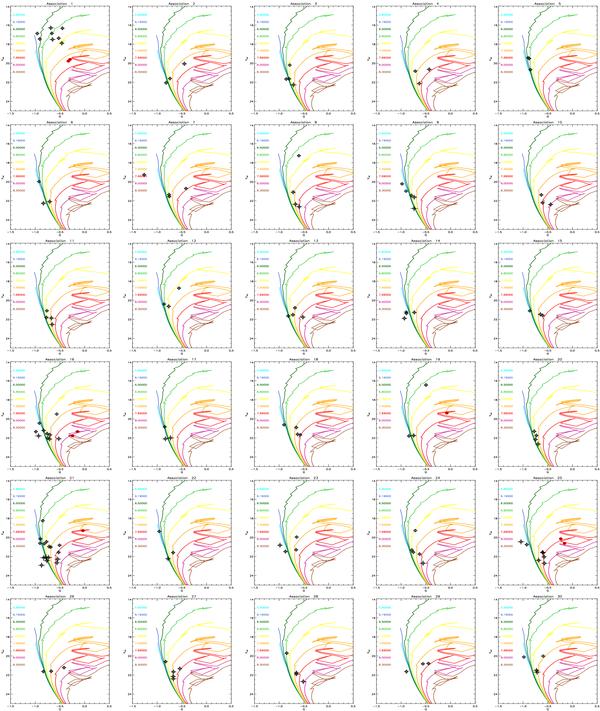
Q vs. Vcorr color–magnitude diagrams of all groups listed in Garcia et al. (2009). Colored lines represent the theoretical isochrones with the same age code as in Fig. A.1, shifted by the DM, but without any correction for foreground extinction. Black diamonds represent V-magnitudes of the blue members, corrected from total extinction (foreground and local). Red circles represent the red members. These diagrams were used for age and mass determinations.
Current usage metrics show cumulative count of Article Views (full-text article views including HTML views, PDF and ePub downloads, according to the available data) and Abstracts Views on Vision4Press platform.
Data correspond to usage on the plateform after 2015. The current usage metrics is available 48-96 hours after online publication and is updated daily on week days.
Initial download of the metrics may take a while.