Fig. B.2
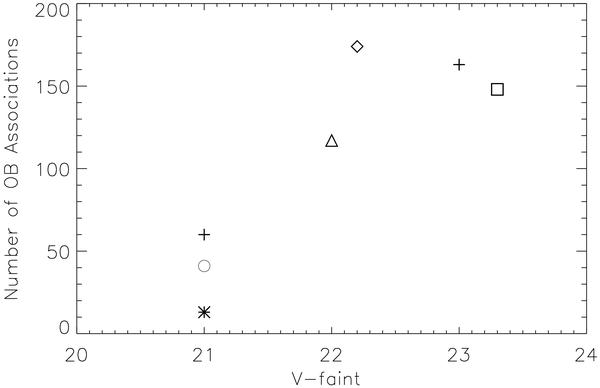
The number of associations found in a galaxy increases as the input catalog is deeper. Symbols as in Fig. B.1. (The sample of Bresolin et al. 1998 is not included because they provided no information about Vlimit. The sample of Ivanov 1996 is not included, as the input photometric catalogs do not cover the entire galaxies.)
Current usage metrics show cumulative count of Article Views (full-text article views including HTML views, PDF and ePub downloads, according to the available data) and Abstracts Views on Vision4Press platform.
Data correspond to usage on the plateform after 2015. The current usage metrics is available 48-96 hours after online publication and is updated daily on week days.
Initial download of the metrics may take a while.