| Issue |
A&A
Volume 523, November-December 2010
|
|
|---|---|---|
| Article Number | A55 | |
| Number of page(s) | 14 | |
| Section | The Sun | |
| DOI | https://doi.org/10.1051/0004-6361/201014762 | |
| Published online | 16 November 2010 | |
Online material
Appendix A: Straylight contamination
To evaluate the effects of straylight degradation on the comparisons between modeled and measured quantities presented in Sect. 4, we developed two test analyses. Firstly, we measured the effects of the straylight contamination induced by a model point spread function (PSF) on synthetic solar images. The PSF used in our analysis follows Criscuoli & Ermolli (2008); it includes one Lorentzian and three Gaussian components, which are defined by seven parameters. We fixed six parameters of the PSF components derived by Criscuoli & Ermolli (2008), while setting the remaining parameter to reproduce the average value of the straylight level measured in PK images at 1.2 solar-disk radii. This parameter describes the weight of the Lorentzian relative to the Gaussian components.
Figure A.1 shows the model PSF utilized in our analysis. We convolved synthetic images constructed from intensities calculated with the one-dimensional FC09 models for the various disk features and bandpasses analysed in our study with the same model PSF. We constructed two sets of synthetic atmospheres. The first set is composed of homogeneous atmospheres. The second set contains inhomogeneous atmospheres with two components, each atmosphere displaying quiet Sun and a number of features of the same type at various μ positions. We describe in the following the results obtained by assuming 10 features, each covering 0.02 solar-disk radii at all μ positions, i.e. foreshortening was not taken into account. For the various FC09 models at the PK-010 bandpass, Figs. A.2 and A.3 show the intensity values computed at various μ positions in the original synthetic atmospheres and the atmospheres convolved by the model PSF.
We found that the convolution of the model PSF with synthetic homogeneous atmospheres leads to a significant decrease only in the intensity and contrast values modeled for the brightest disk features close to the solar limb. Figure A.4 shows that the discrepancy between measured and modeled CLV for QS increases when moving toward the limb if straylight contamination of PK images is taken into account, except when comparing the CLV measured for PK-027 and the one derived from CRD computations. Moreover, we found that PK-027 measurements are in close agreement with the CLV obtained from the inhomogeneous atmospheres containing network features after their straylight contamination.
On the other hand, we found that the convolution of synthetic inhomogeneous atmospheres with the same PSF leads to a significant decrease in contrast values estimated for all the features and disk positions. This is illustrated by Figs. A.5 and A.6, which compare the results presented in Sect. 4, and the CLV derived from the convolution of the synthetic atmospheres with the model PSF. The contrast values estimated in the synthetic atmospheres convolved by the PSF are by up to nearly a factor two lower than those obtained in the original RH computations. Therefore, these results suggest a closer general agreement between median contrast values measured in PK and the contrast values derived from the RH synthesis than presented in Sect. 4, if straylight contamination of small-scale disk features is taken into account.
Our second test analysis was performed on PK images restored for straylight contamination by the deconvolution of original images with a model PSF derived from the analysed data. We applied the method and algorithm developed by Criscuoli & Ermolli (2008) to the whole sample of PK good images analysed in Sect. 4.
Figures A.7 and A.8 compare model results presented in Sect. 4 and the CLV of contrast values measured for the various solar features on images corrected for straylight degradation. We found that image restoration leads to a slight increase in the average contrast values measured for all solar features with respect to the values derived from un-restored images, in particular for the features identified in PK-027 and PK-010 images. In addition, we found an increase in the maximum contrast values measured for all the features, filter bandpasses, and disk positions, in particular for the network features in PK-027 images. We also found slightly closer agreement between model predictions and contrast values measured in restored images than derived from un-restored images. We found that model predictions and contrast values measured at disk center (μ ≥ 0.9) in restored images indeed differ by a factor ranging from 0.81 to 2.17, depending on the solar feature and filter bandpass, while the same quantity evaluated on un-restored images ranges from 0.98 to 2.58. Modeled and measured values differ, on average, by a factor of 1.45 after taking into account straylight effects, compared to a factor of 1.71 for measurements in un-restored images at the same disk positions.
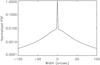 |
Fig. A.1
The model PSF used to evaluate effects of straylight degradation on PK images follows Criscuoli & Ermolli (2008). It includes three Gaussians and one Lorentzian component. |
| Open with DEXTER | |
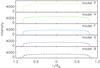 |
Fig. A.2
Profiles of intensity values in the set of synthetic homogeneous atmospheres (solid lines) computed for the various disk features and PK-010 bandpass. In the various sub-panels, the different atmospheres are identified by colors and labels: yellow, green, blue, violet, and black show bright plage, plage, enhanced network, network, and quiet Sun atmospheres, associated with models P to B, respectively. Distance from disk center is given in disk radius units. The dashed lines show the profiles of intensity values in the various atmospheres after their convolution by the model PSF. |
| Open with DEXTER | |
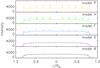 |
Fig. A.3
Profiles of intensity values in the set of synthetic inhomogeneous atmospheres (solid lines) computed for the various disk features and PK-010 bandpass. Legend as given in Fig. A.2. The dashed lines show the profiles of intensity values in the various atmospheres after their convolution by the model PSF. Distance from disk center is given in disk radius units. |
| Open with DEXTER | |
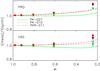 |
Fig. A.4
Ratio of the median of quiet Sun limb darkening measured in PSPT images to the quiet Sun limb darkening derived from the synthesis performed for the PK-027 (green, solid line), PK-010 (violet, dotted line), and PKR-011 (red, dashed line) filters by assuming either the PRD (top panel) or CRD (bottom panel) approximation. The lines indicate the results obtained by taking into account the CLV derived from the synthesis, while circles show the results derived by convolving the synthetic homogeneous quiet Sun atmosphere (associated with model B) by the model PSF. Asterisks show the ratio of the CLVs measured in PK to the ones derived from contaminated inhomogeneous atmosphere composed of quiet Sun and network small features, associated with models B and D, respectively. |
| Open with DEXTER | |
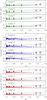 |
Fig. A.5
CLV of median contrast values measured (symbols) for various disk features identified in PK-027 (top panel), PK-010 (middle panel), and PKR-011 (bottom panel) images un-restored for straylight degradation. For each bandpass, the various sub-panels show measurement results for solar features ordered by decreasing contrast, i.e. from the top panel results for bright plage, plage, enhanced network, and network regions, respectively. The error bars represent the standard deviation of measurements. For each disk feature and bandpass, the dot-dashed line indicates the average of values measured at disk positions μ ≥ 0.9, while dotted and dashed lines show the respective CLV derived from RH calculations with PRD and CRD and the reference model corresponding to the given feature, also indicated in the legend. Triangles and circles indicate the results obtained after convolution of the synthetic atmospheres by the model PSF, for homogeneous and inhomogeneous atmospheres, respectively. In the top panel, the solid blue lines show the threshold values applied to the feature identification. |
| Open with DEXTER | |
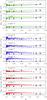 |
Fig. A.6
CLV of maximum contrast values measured (symbols) for various disk features (model P to model D) in PK-027 (top panel), PK-010 (middle panel), and PKR-011 (bottom panel) images un-restored for straylight degradation. Legend as given in Fig. A.5. |
| Open with DEXTER | |
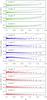 |
Fig. A.7
CLV of median contrast values measured (symbols) for various disk features identified in PK-027 (top panel), PK-010 (middle panel), and PKR-011 (bottom panel) images restored from straylight degradation. For each bandpass, the various sub-panels show measurement results for solar features ordered by decreasing contrast, i.e. from the top panel results for bright plage, plage, enhanced network, and network regions, respectively. The error bars represent the standard deviation of measurements. For each disk feature and bandpass, the dot-dashed line indicates the average of values measured at disk positions μ ≥ 0.9, while dotted and dashed lines show the respective CLV derived from RH calculations with PRD and CRD and the reference model corresponding to the given feature, as also indicated in the legend. In the top panel, the solid blue lines show the threshold values applied to the feature identification. |
| Open with DEXTER | |
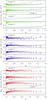 |
Fig. A.8
CLV of maximum contrast values measured (symbols) for various disk features (model P to model D) in PK-027 (top panel), PK-010 (middle panel), and PKR-011 (bottom panel) images restored from straylight degradation. For PK-027, measurement results for enhanced network and network features (associated with model F and D of Fontenla et al. (2009), respectively) lie outside the plotted range, that is the range utilized for results from un-restored images. Legend as given in Fig. A.7. |
| Open with DEXTER | |
© ESO, 2010
Current usage metrics show cumulative count of Article Views (full-text article views including HTML views, PDF and ePub downloads, according to the available data) and Abstracts Views on Vision4Press platform.
Data correspond to usage on the plateform after 2015. The current usage metrics is available 48-96 hours after online publication and is updated daily on week days.
Initial download of the metrics may take a while.