Fig. A.7
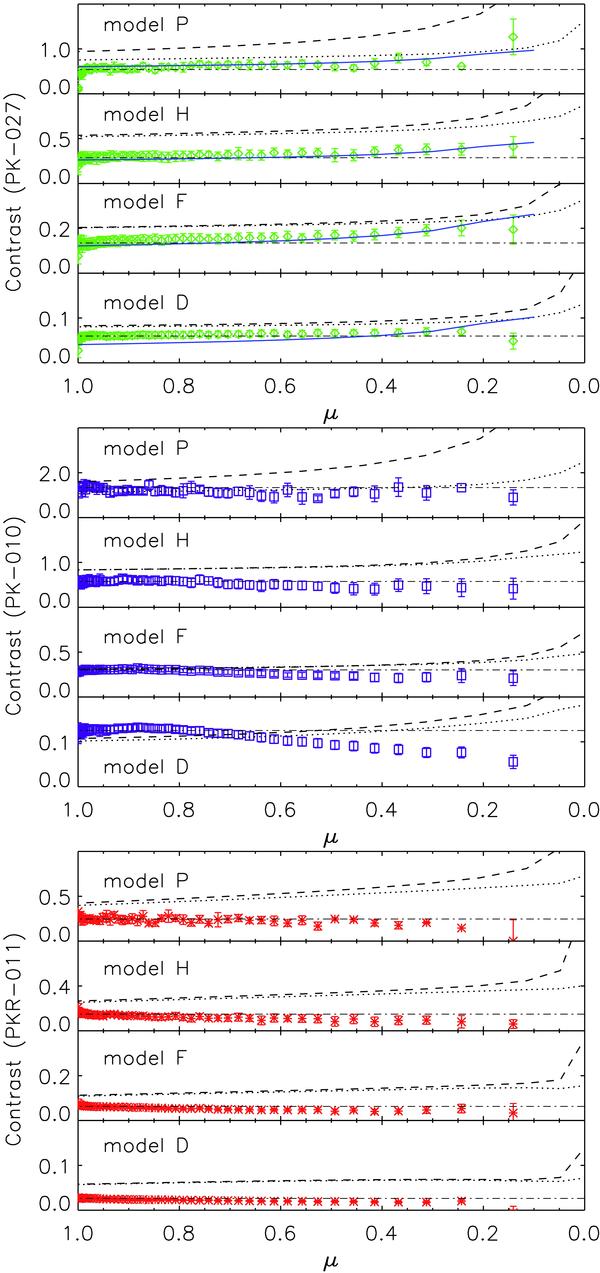
CLV of median contrast values measured (symbols) for various disk features identified in PK-027 (top panel), PK-010 (middle panel), and PKR-011 (bottom panel) images restored from straylight degradation. For each bandpass, the various sub-panels show measurement results for solar features ordered by decreasing contrast, i.e. from the top panel results for bright plage, plage, enhanced network, and network regions, respectively. The error bars represent the standard deviation of measurements. For each disk feature and bandpass, the dot-dashed line indicates the average of values measured at disk positions μ ≥ 0.9, while dotted and dashed lines show the respective CLV derived from RH calculations with PRD and CRD and the reference model corresponding to the given feature, as also indicated in the legend. In the top panel, the solid blue lines show the threshold values applied to the feature identification.
Current usage metrics show cumulative count of Article Views (full-text article views including HTML views, PDF and ePub downloads, according to the available data) and Abstracts Views on Vision4Press platform.
Data correspond to usage on the plateform after 2015. The current usage metrics is available 48-96 hours after online publication and is updated daily on week days.
Initial download of the metrics may take a while.