Fig. A.3
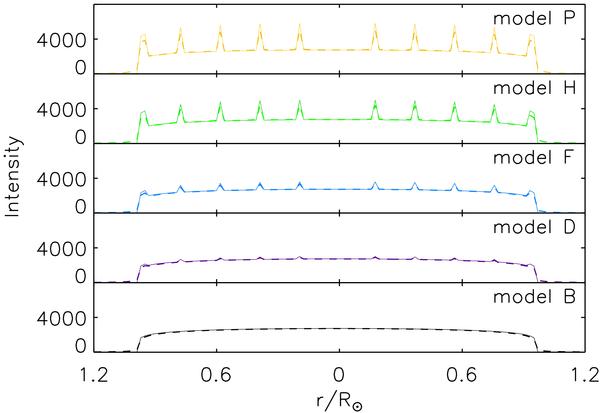
Profiles of intensity values in the set of synthetic inhomogeneous atmospheres (solid lines) computed for the various disk features and PK-010 bandpass. Legend as given in Fig. A.2. The dashed lines show the profiles of intensity values in the various atmospheres after their convolution by the model PSF. Distance from disk center is given in disk radius units.
Current usage metrics show cumulative count of Article Views (full-text article views including HTML views, PDF and ePub downloads, according to the available data) and Abstracts Views on Vision4Press platform.
Data correspond to usage on the plateform after 2015. The current usage metrics is available 48-96 hours after online publication and is updated daily on week days.
Initial download of the metrics may take a while.