Fig. A.8
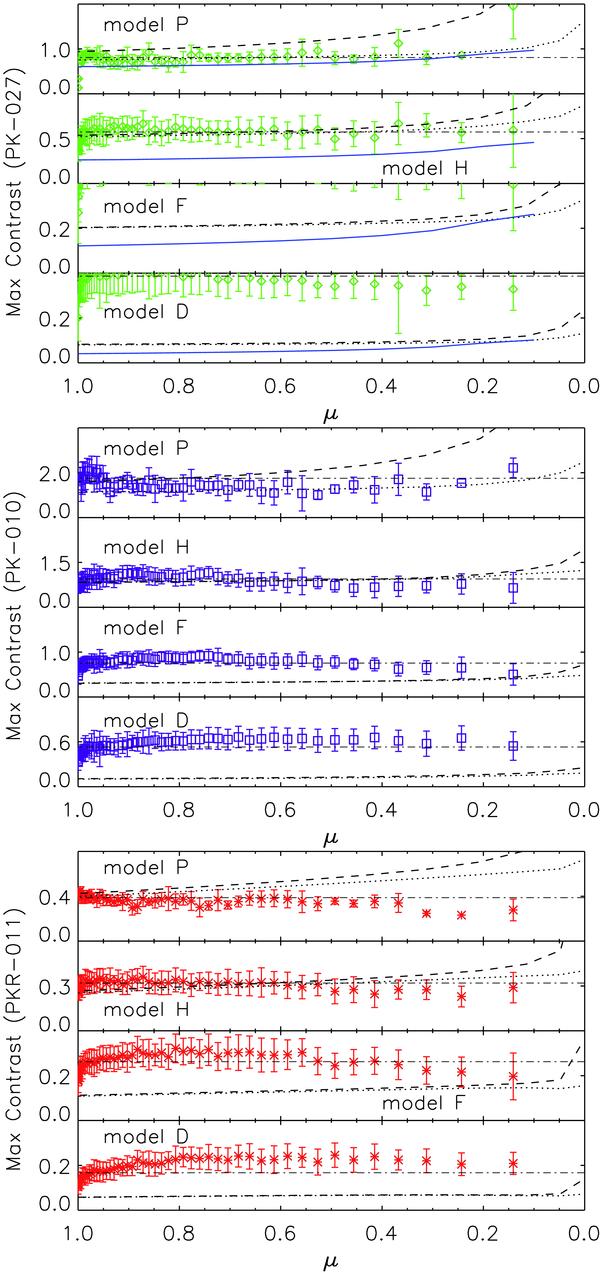
CLV of maximum contrast values measured (symbols) for various disk features (model P to model D) in PK-027 (top panel), PK-010 (middle panel), and PKR-011 (bottom panel) images restored from straylight degradation. For PK-027, measurement results for enhanced network and network features (associated with model F and D of Fontenla et al. (2009), respectively) lie outside the plotted range, that is the range utilized for results from un-restored images. Legend as given in Fig. A.7.
Current usage metrics show cumulative count of Article Views (full-text article views including HTML views, PDF and ePub downloads, according to the available data) and Abstracts Views on Vision4Press platform.
Data correspond to usage on the plateform after 2015. The current usage metrics is available 48-96 hours after online publication and is updated daily on week days.
Initial download of the metrics may take a while.