| Issue |
A&A
Volume 508, Number 3, December IV 2009
|
|
|---|---|---|
| Page(s) | 1173 - 1191 | |
| Section | Cosmology (including clusters of galaxies) | |
| DOI | https://doi.org/10.1051/0004-6361/200810644 | |
| Published online | 27 October 2009 | |
Online Material
Table 9:
![]() accuracy derived from simulations for
galaxies in the spectroscopic sample, based on the GR code.
accuracy derived from simulations for
galaxies in the spectroscopic sample, based on the GR code.
Table 10:
![]() accuracy expected for the faintest galaxies in the
EDisCS sample, based on the GR code.
accuracy expected for the faintest galaxies in the
EDisCS sample, based on the GR code.
|
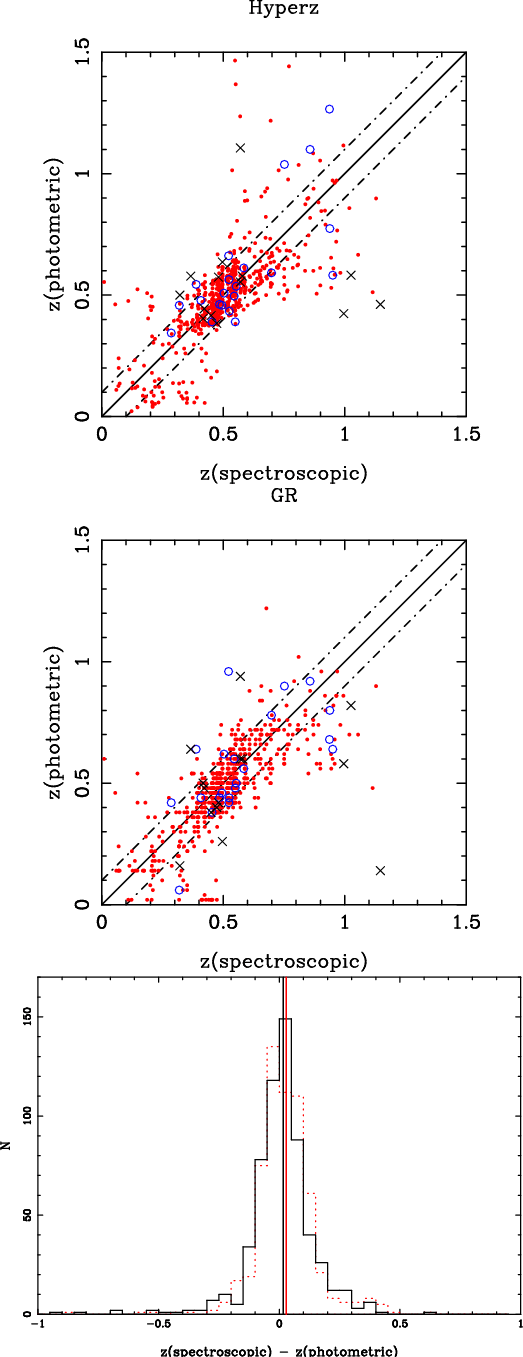
Figure 16:
Comparison between spectroscopic and photometric redshifts
for the low-z sample, obtained with Hyperz ( top panel) and
GR ( central panel)
codes. Solid (red) circles, open (blue) circles, and crosses correspond
to objects with good (type 1), medium (type 2) and tentative
(type 3) spectroscopic redshift determinations, respectively.
Dot-dashed lines display
|
| Open with DEXTER | |
|
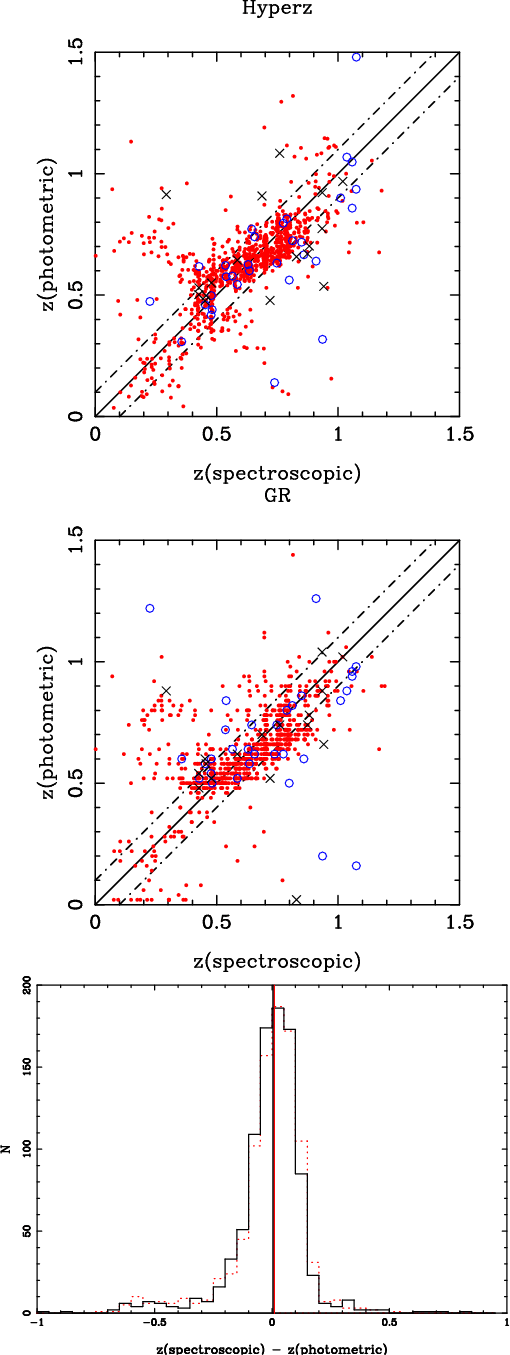
Figure 17:
(Comparison between spectroscopic and photometric redshifts
for the high-z sample, obtained with Hyperz ( top panel) and
GR ( central panel)
codes. Solid (red) circles, open (blue) circles, and crosses correspond
to objects with good (type 1), medium (type 2) and tentative
(type 3) spectroscopic redshift determinations, respectively.
Dot-dashed lines display
|
| Open with DEXTER | |
|
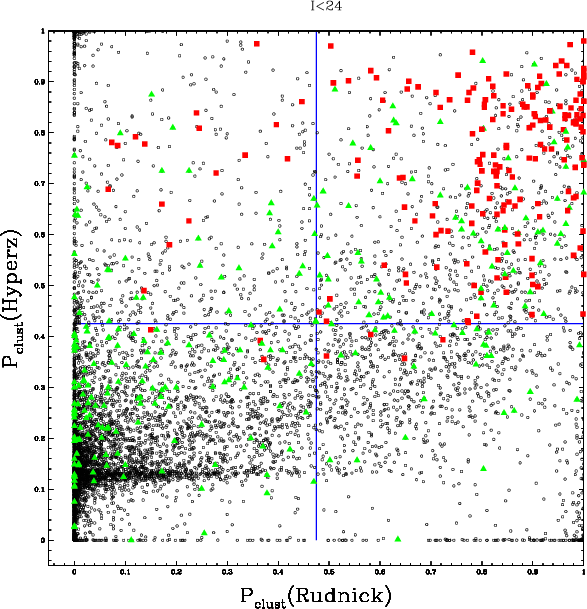
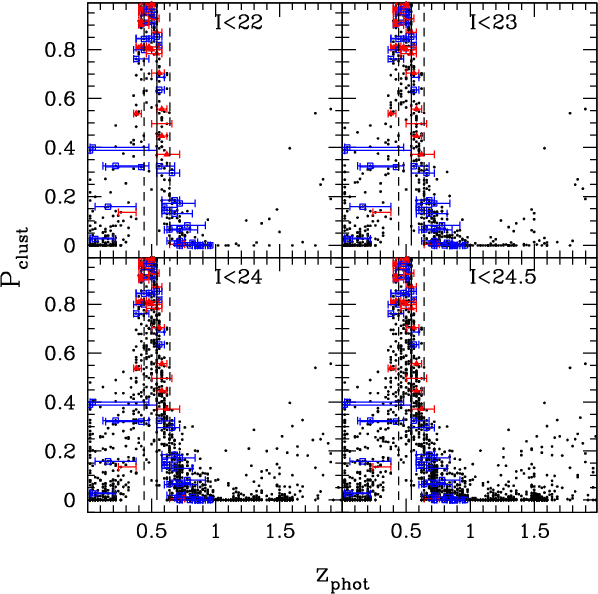
Figure 18:
A comparison of
|
| Open with DEXTER | |
|
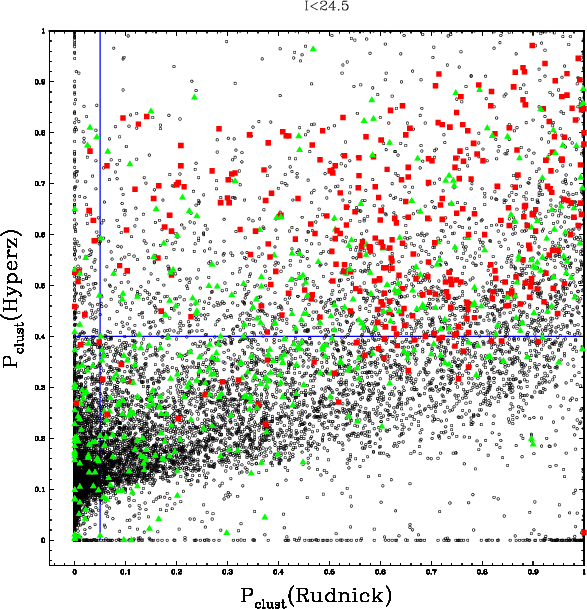
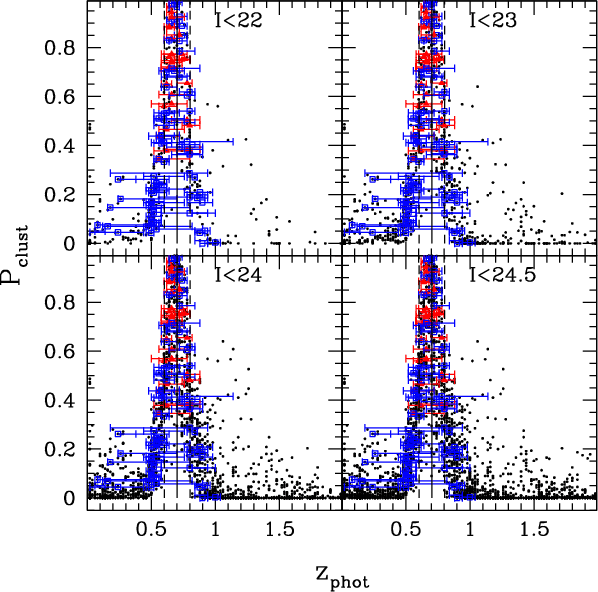
Figure 19: Same as Fig. 18 but for the clusters with VRIJK photometry. |
| Open with DEXTER | |
|
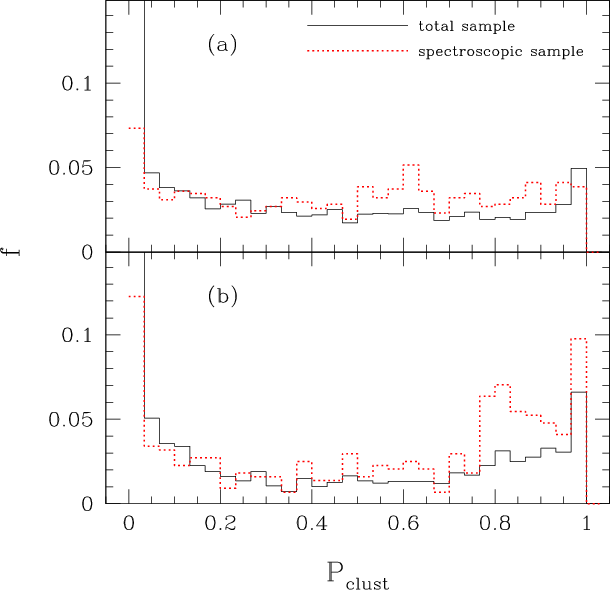
Figure 20:
The histogram of
|
| Open with DEXTER | |
|
Figure 21: Same as Fig. 14 except for Cl1420-1236. |
| Open with DEXTER | |
|
Figure 22: Same as Fig. 14 except for Cl1040-1155. |
| Open with DEXTER | |
Current usage metrics show cumulative count of Article Views (full-text article views including HTML views, PDF and ePub downloads, according to the available data) and Abstracts Views on Vision4Press platform.
Data correspond to usage on the plateform after 2015. The current usage metrics is available 48-96 hours after online publication and is updated daily on week days.
Initial download of the metrics may take a while.