


| Issue |
A&A
Volume 712, August 2026
|
|
|---|---|---|
| Article Number | A18 | |
| Number of page(s) | 17 | |
| Section | Galactic structure, stellar clusters and populations | |
| DOI | https://doi.org/10.1051/0004-6361/202558815 | |
| Published online | 30 July 2026 | |
Multiwavelength study of the Carina–Sagittarius Arm
I. Astrometric and photometric search for new open clusters in the 320° ≤ l ≤ 325° region
1
Facultad de Ciencias Astronómicas y Geofísicas, (UNLP),
La Plata,
Argentina
2
Instituto de Astrofísica La Plata, (CONICET – UNLP),
La Plata,
Argentina
3
Facultad Regional Concepción del Uruguay, (UTN),
Entre Ríos,
Argentina
★ Corresponding author: This email address is being protected from spambots. You need JavaScript enabled to view it.
Received:
29
December
2025
Accepted:
9
June
2026
Abstract
Aims. Our main goal is to determine whether the lower stellar density observed in the Carina–Sagittarius Arm region (320° ≤ l ≤ 325°, |b| ≤ 1°) is an intrinsic structural feature of the spiral arm or a consequence of high interstellar reddening and extinction along the line of sight.
Methods. We performed a systematic search for new open clusters using the HDBSCAN algorithm on Gaia DR3 astrometric data. The physical reality of the candidates was validated through a multiwavelength analysis, integrating Gaia photometry with the near-IR photometry of the 2MASS catalog, the mid-IR photometric information of the WISE catalog to identify young stellar objects (YSOs), and the radio continuum emission at 843 MHz with the SUMSS survey to identify and associated interstellar material.
Results. We report the discovery of five new open clusters, the ESFERA sample. Our analysis reveals four young systems (10–50 Myr), with ESFERA 3 hosting YSOs, while ESFERA 5 is identified as a 2 Gyr old cluster. Although the region lacks massive star-forming complexes, these clusters trace active star formation within the region, although at a lower efficiency.
Conclusions. Our results suggest that this region represents an intrinsic star formation valley or low-density node (the string in a morphology of beads on a string) and is not an effect of extinction. The discovery of these clusters demonstrates that while the local surface density is below the critical threshold for massive complexes, star formation persists in isolated small-scale pockets throughout the arm.
Key words: parallaxes / proper motions / ISM: general / open clusters and associations: general / Galaxy: stellar content / Galaxy: structure
Member of the EStructuras de HI y Formación EstelaR gAláctica (ESFERA) group, Argentina.
© The Authors 2026
 Open Access article, published by EDP Sciences, under the terms of the Creative Commons Attribution License (https://creativecommons.org/licenses/by/4.0), which permits unrestricted use, distribution, and reproduction in any medium, provided the original work is properly cited.
This article is published in open access under the Subscribe to Open model. This email address is being protected from spambots. You need JavaScript enabled to view it. to support open access publication.
1 Introduction
Young open clusters (OCs) constitute primary tracers of the Milky Way spiral structure, offering a detailed sampling of the star formation history in the Galactic disk. As intrinsically bright systems that host massive early-type stars (O and B), they offer a distinct advantage for Galactic studies, as their young ages ensure that they remain close to their birthplaces in the spiral arms. Furthermore, their abundance throughout the disk provides a valuable and widely distributed sample based on which the Galactic disk properties can be studied. This complements other tracers such as Cepheids and masers (Efremov 1998; Vázquez et al. 2008; Choi et al. 2014; Molina Lera et al. 2018; Dias et al. 2021).
Crucially, distances to OCs can be determined with significantly higher precision than those of individual stars. By leveraging the photometry and kinematics of multiple cluster members, it is possible to mitigate individual measurement uncertainties. This collective analysis provides a more accurate distance estimate based on the statistical consensus of all member stars. Recent studies have highlighted an intriguing anomaly in the spatial distribution of young stellar tracers. Specifically, large-scale surveys of OCs and OB stars (e.g., Chen et al. 2019; Liu et al. 2025) have revealed a noticeable gap or scarcity of detections within the Carina–Sagittarius Arm. This persistent lack of tracers at certain Galactic coordinates and the distance ranges raises fundamental questions regarding the continuity and local structure of this spiral arm, suggesting that our current census of the region remains incomplete.
This work bridges this observational gap by conducting a systematic search for new open clusters within the Carina–Sagittarius Arm, specifically, by targeting the region 320° ≤ l ≤ 325°. While the number of cataloged OCs has grown significantly with the advent of the Gaia mission (Gaia Collaboration 2016), many candidates lack robust astrometric and physical confirmation. A major challenge in current Galactic studies are spurious entries, including duplicate records and chance alignments of field stars (asterisms) that do not constitute true clusters. Such inaccuracies can bias our understanding of the spiral structure. Consequently, we applied a rigorous membership analysis to identify genuine clusters to ensure a reliable census for the local structure of this arm.
The initial validation of OC candidates is as critical as the subsequent astrophysical analysis. To ensure maximum reliability, we adopted a multiwavelength approach that extends beyond optical observations. This involved a high-precision astrometric analysis using data from the Gaia Data Release 3 (Gaia DR3), specifically, parallaxes and proper motions, to confirm the common distance and kinematic coherence of the candidate stars. Furthermore, we integrated optical photometry with near- and mid-infrared (NIR and MIR) data to mitigate the effects of interstellar extinction and derive robust stellar parameters, such as age and distance. This comprehensive approach allowed us to rigorously cross-validate each stellar aggregate, ensuring that only physically genuine open clusters were used to map the Carina–Sagittarius Arm.
The paper is structured as follows. In Sect. 2, we describe the observational data and the various catalogs and services we used to obtain the astrometric and astrophysical parameters. Section 3 details the candidate selection process, including the astrometric and astrophysical constraints we applied. The analysis and results for each identified open cluster are presented in Sect. 4. Finally, the discussion and conclusions are provided in Sects. 5 and 6, respectively.
2 Observational data
2.1 Astrometric data
We used the astrometric and photometric parameters from the Gaia DR3 astrometric catalog (Gaia Collaboration 2023). Released on 13 June 2022, it consists of more than 1.81 × 10⁹ sources with a limiting magnitude of G ~21 and a bright limit of G ~ 3. It contains some 585 million sources with five-parameter astrometry: position (α, δ), proper motion (μα cos δ, μδ), and parallax ϖ. It has about 882 million sources with six-parameter astrometry, including an additional pseudo-colour parameter. The astrometric solution is accompanied with some quality indicators, such as the renormalized unit weight error (RUWE).
2.2 Photometric data
The comprehensive study of OCs necessitates an astrometric analysis to identify cluster members, an estimate of the distances using parallax data, and a photometric analysis across a wide range of wavelengths. Consequently, in addition to the astrometric data of each stellar member, we used the optical photometric data (G, GBP, GRP) bands provided by Gaia DR3. The magnitudes are given for more than 1.80 × 10⁹ in the G band (330–1050 nm), for more than 1.54 × 10⁹ sources in the GBP band (330–680 nm), and for more than 1.55 × 10⁹ sources in the GRP band (640–1050 nm). The photometric uncertainties supplied by the catalog are conservatively constrained to σG ≤ 0.01 mag and σ(BP–RP) ≤ 0.1 mag. The color–magnitude diagram (CMD) serves as the primary tool for estimating the essential photometric characteristics of a star cluster. For our analysis with the Gaia data, we employed the Padova stellar isochrones from the PARSEC v1.2S models1. These models, based on the stellar evolutionary tracks by Bressan et al. (2012), were computed for a scaled solar composition following the Y = 0.2485+1.78Z relation, adopting a solar metallicity of Z = 0.0152.
To investigate the reddened stars and young stellar object (YSO) candidates within each cluster, we incorporated NIR photometry (JHK bands) from the Two Micron All-Sky Survey (2MASS)2 (Skrutskie et al. 2006). The photometric uncertainties provided by the 2MASS catalog are typically σ(JHK) ≤ 0.05 mag. Additionally, we included mid-infrared (MIR) photometric data from the Wide-field Infrared Survey Explorer (WISE) catalog3 (Wright et al. 2010). This MIR information covers the 3.4, 4.6, 12, and 22 μm bands (W1, W2, W3, and W4) respectively.
Knowledge of the interstellar medium (ISM) is vital when studying a stellar formation region. To investigate the potential existence of an H II region and an HI shell and their connection with the star clusters, we used data from the Sydney University Molonglo Sky Survey (SUMSS) (Bock et al. 1999). SUMSS provides radio continuum emission data at 843 MHz. The synthesized elliptical beam of the survey is 45″ csc |δ|×45″. This information was specifically used to search for interactions between the stellar population and the surrounding gas structures.
To manage and analyze the astronomical data, we used several standard software tools as listed below.
Data management and analysis: we employed the Virtual Observatory software TOPCAT (Tool for Operations on Catalogs and Tables) (Taylor 2011) for efficient management and analysis of the astronomical tables.
Image visualization: to analyze the images, we primarily used two visualization tools:
KVIS (Gooch 1996), which is part of the KARMA (A Virtual Reality Toolkit for Astronomers) astronomical visualization toolkit4, and
SAOImage DS9, which is developed and maintained by the Smithsonian Astrophysical Observatory (SAO) as an essential component of its astronomical visualization toolkit (Joye et al. 2025).
Catalog access: to search and access a comprehensive collection of published astronomical data catalogs across various wavelengths, we consulted the VizieR tool5.
3 Data sources and membership
We searched for open clusters in the Carina-Sagittarius Arm region, more precisely, in the region 320° ≤ l ≤ 325°, −1° ≤ b ≤ + 1°. Figure 1 shows the distribution of OCs (from the UCC catalog Perren et al. 2023) in a section of the Carina-Sagittarius Arm. Figure 2 presents a histogram of the OCs shown in Fig. 1 to provide a quantitative view of the region we selected. The data display a clear lack of open clusters; this anomaly makes it a particularly compelling sector to investigate.
We used Gaia DR3 astrometric data (positions, proper motions, and parallaxes) for sources with a standard error in proper motion of ≤0.3 mas yr−1 to minimize the errors arising from this parameter (Rizzo et al. 2025); the quotient parallax divided by its standard error must be ≥5 (parallax_over_error ≥5) to reduce the errors in the transformation of mean weighted parallax to distance (Paíz et al. 2025); and the local RUWE threshold was determined using the GaiaUnlimited Python package (Castro-Ginard et al. 2024) to identify and discard potential binary systems and sources with unreliable astrometric solutions. The final sample consisted of 247 296 sources. These stringent astrometric quality cuts naturally limited the sample to stars typically brighter than G ≈ 18 mag, which ensured that the membership analysis and subsequent isochrone fitting were based on high-precision data. Although these criteria exclude the lower main sequence, the sampled population (turn-off and RGB) remains sufficient for a robust characterization of the physical cluster parameters.
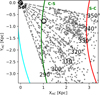 |
Fig. 1 Spatial distribution in heliocentric Galactic coordinates (XHC, YHC) of known open clusters (gray points) from the UCC catalog (Perren et al. 2023). The plot covers the region 290° < l < 350° and −1° < b < 1°, corresponding to a prominent section of the Carina-Sagittarius Arm. The colored curved lines represent the Hou & Han (2014) spiral structure of the MW. The thick black circle highlights the specific region we investigated, centered at l = 322°, which is characterized by a noticeable lack of known clusters and limited prior deep exploration. |
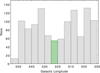 |
Fig. 2 Number of open clusters per 5° interval in Galactic longitude. This distribution highlights the density variations within the section of the Carina-Sagittarius Arm. |
3.1 Candidate selection
We normalized the five astrometric data (α, δ, μα cos δ, μδ, and ϖ) through RobustScaler in the scikit-learn package (Pedregosa et al. 2011); for example, it removes the median and can scale the data according to the interquartile range. After this, the membership selection was performed using the HDBSCAN clustering algorithm (Campello et al. 2013) on the five normalized astrometric parameters using its hyperparameters min_samples and min_cluster_size set to the same value (as recommended by Campello et al. 2013). To do this, we explored the range 5–100 to ensure cluster stability and discovery; the selection method (cluster_selection_method) can be excess of mass (eom) to select one or two of the largest clusters and some smaller clusters, or leaf to select several small and more homogeneous clusters (Santos-Silva et al. 2021). We chose leaf to prioritize the detection of small, homogeneous, and dense groupings; and with metric=euclidean, we used the standard euclidean metric to measure the five-dimensional distance between points.
We considered as astrometric members of a group stars with an HDBSCAN probability greater than or equal to 0.5. When HDBSCAN found groupings, we evaluated whether they corresponded to real clusters or false positives. We considered them false positives when they did not fulfill some of the following conditions by Cantat-Gaudin & Anders (2020) and Hunt & Reffert (2021):
(a) the dispersion of the total proper motion of the group members must satisfy
![Mathematical equation: $\[\sqrt{\sigma_{\mu_\alpha cos \delta}^2+\sigma_{\mu_\delta}^2} \leq \begin{cases}1 ~\mathrm{mas} ~\mathrm{yr}^{-1} & \text { if } \varpi \leq 0.67 ~\mathrm{mas} \\ 1.49 \cdot \varpi ~\mathrm{mas} ~\mathrm{yr}^{-1} & \text { if } \varpi>0.67 ~\mathrm{mas};\end{cases}\]$](/articles/aa/full_html/2026/08/aa58815-25/aa58815-25-eq1.png) (1)
(1)
(b) the radius containing half of the group members (r50) must be smaller than 20 pc;
(c) the group must be denser than a surrounding set of 100–500 field stars. To compare densities in the five-dimensional space of normalized astrometric data, we computed the euclidean distance from each star to its ninth nearest neighbor in the group because we assumed that open clusters consist of at least ten members, and the ninth neighbor is free of contamination from binary or multiple star systems.
In this way, we divided the region we studied into five subregions of two square degrees. Out of the hundreds of groups initially identified by HDBSCAN in all subregions, 26 passed the astrometric filters (conditions a, b, and c), and 5 of them were confirmed as new open clusters with the isochrone fitting. This means that we detected a total number of 5 groupings representing new open clusters, and we call them ESFERA 1, ESFERA 2, ESFERA 3, ESFERA 4, and ESFERA 5. Fig. 3 shows the spatial distribution of the ESFERA open cluster members with their proper motions in Galactic coordinates calculated with the formulae of Poleski (2013).
3.2 Estimating the physical parameters
Building upon the sample of cluster member stars identified via the astrometric analysis described in Sect. 3.1, and adopting the cluster distances derived from their respective parallaxes, we initiated the photometric analysis for each open cluster by studying their CMDs using data from the Gaia DR3 survey. To determine the visual absorption for each cluster, we used the theoretical Schmidt–Kaler principal sequence (Landolt-Bornstein & Bursa 1982) in conjunction with coefficients derived from the polynomial fittings in the color–color diagram, using the Johnson–Cousins passbands (Jordi et al. 2010). These fittings are described by Eqs. (2) and (3). The standard deviation of the residuals of the fit was adopted as the σ value. The described theoretical curve was fitted to the Gaia photometric observations of the possible cluster members using Av values constrained by the range proposed by Joshi (2025) (see their Fig.4) for 300° ≤ l ≤ 350°,
![Mathematical equation: $\[\begin{aligned}& 300^{\circ} \leq l \leq 350^{\circ}, \\& G_{B P}-G_{R P}=0.0981+1.429(B-V)-0.0269(B-V)^2 \\&\qquad\qquad\qquad\qquad\qquad\qquad\quad 0.0061(B-V)^3; \sigma=0.43\end{aligned}\]$](/articles/aa/full_html/2026/08/aa58815-25/aa58815-25-eq2.png) (2)
(2)
![Mathematical equation: $\[\begin{array}{r}G=V-0.0424-0.0851(B-V)-0.3348(B-V)^2 \\0.0205(B-V)^3; \sigma=0.38.\end{array}\]$](/articles/aa/full_html/2026/08/aa58815-25/aa58815-25-eq3.png) (3)
(3)
After we estimated the Av value for each open cluster, we fitted the PARSEC v1.2S isochrones to their G versus GBP–GRP photometric diagrams to determine the respective cluster ages. For this purpose, we applied the reddening law AG = 0.83627 Av, ABP = 1.08337 Av, and ARP = 0.63439 Av. Since age estimates derived from broadband photometric surveys and small member counts are inherently uncertain, we fitted the cluster by prioritizing the alignment of the most probable cluster members with the zero-age main sequence (ZAMS) and the identified early-type stars. Crucially, the metallicity was constrained to solar (Z = Z⊙) in all these fitting attempts, as previously discussed in Sect. 2.2. As one stellar formation region clearly exhibited differential reddening, we needed a method to distinguish between reddening caused by dust and the inherent color of a star. Our protocol was to cross-reference the optical Gaia data (for stars confirmed as cluster members) with NIR photometric data from the 2MASS survey (JHK). We used a strict maximum angular distance of 1″ for this matching process. Subsequently, to avoid any confusion arising from the intrinsic degeneracy between reddening and spectral type, we calculated the reddening-free photometric parameter QNIR = (J − H) − 1.7 × (H − K) Negueruela et al. (2007). Our star classification was substantiated by the guidelines provided by Borissova et al. (2012) and Messineo et al. (2012), according to whom −0.3 < QNIR < 0.5 values are indicative of early main-sequence stars, QNIR < −0.3 values are indicative of pre-main-sequence stars (PMS) or young stellar objects (YSOs), and 0.5 < QNIR values are indicative of late reddening stars. Following this classification, potential YSO candidates (QNIR < −0.3) were further investigated by cross-matching them with the WISE catalog. This was done with the aim of confirming their YSO nature and subsequently classifying them according to the criteria established by Koenig & Leisawitz (2014). The interstellar extinction vector, derived from the reddening law defined by Wang & Chen (2019), was super-imposed on each CMD. This vector represents the reddening correction required to align the observed data with the intrinsic (dereddened) position of the theoretical isochrone, especially for the hotter and more luminous stellar populations. Based on this analysis, we estimated the spectral types of the cluster members and performed a classification using four categories: O−, O+, B−, and B+. In this nomenclature, the letters O and B denote the corresponding spectral types, and the minus (−) and plus (+) signs indicate early-type and late-type stars within each class, respectively.
To complete the study about the redder stars, we analyzed the (J − H) versus (H − K) color–color diagram to distinguish different stellar populations. In our procedure, we adopted the MS calibrations given by Landolt-Bornstein & Bursa (1982), Dean et al. (1978), and Koornneef (1983). Their locations were computed using the adopted distances and visual absorption presented in Table 1 and a normal reddening law, which allowed us to use the absorption ratios (rX = AX/AV) given by Rieke & Lebofsky (1985) and Carpenter (2001). Candidate members for each cluster were ordered by increasing Gaia source ID in all tables. This provided us with a uniform reference across astrometric and photometric datasets, ensuring that specific stars were easily identified and cross-referenced throughout the study.
Finally, the flux density at 843 MHz was estimated for each source located in the vicinity of each ESFERA open cluster. Using the task TVSTAT within the AIPS6 package, we determined the average background flux density (Sbg) in units of Jy beam−1. This was achieved by calculating the mean flux density value at three different positions adjacent to each source. The root mean square (rms) of Sbg was then used as the detection threshold to distinguish the signal from the noise. Subsequently, the measured flux density value of each source was obtained, and the corresponding Sbg value was subtracted to yield the net emission. The spectral index α (S ~ ν−α) is a key parameter that indicates the origin of the emission (either thermal radiation or nonthermal synchrotron radiation). It can be calculated from the flux densities measured at two different frequencies, ν1 and ν2, with the mathematic expression ![Mathematical equation: $\[\alpha=\frac{\log \left(S_{1} / S_{2}\right)}{\log \left(\nu_{2} / \nu_{1}\right)}\]$](/articles/aa/full_html/2026/08/aa58815-25/aa58815-25-eq4.png) . The determination of this spectral index is beyond the scope of this paper and will be addressed in a future study.
. The determination of this spectral index is beyond the scope of this paper and will be addressed in a future study.
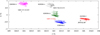 |
Fig. 3 Spatial distribution of the ESFERA open cluster members with their proper motions in Galactic coordinates. The different symbols represent HII region [R2003] 387(Murray & Rahman 2010) (black open square), G 321.9–0.3 SNR (Ball et al. 2025) (open red square), and HII regions G 322.153+00.613 (Anderson et al. 2014) and G 324.147+00.231 (Anderson et al. 2014) (black diamonds). The proper motion components in Galactic coordinates were calculated with the formulae by Poleski (2013). The background is intentionally kept clear to maximize the contrast and visibility of the proper motion vectors. |
Open clusters ESFERA we discovered in the Galactic region 320° ≤ l ≤ 325°, −1° ≤ b ≤ + 1°.
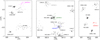 |
Fig. 4 Spatial distribution of ESFERA 1 (red), ESFERA 2 (blue), ESFERA 3 (green), ESFERA 4 (gray), and ESFERA 5 (magenta) and local open clusters known in the literature (black) detected in this study. |
4 Analysis and results
In this section, we present the detection and characterization of five new open cluster candidates, hereafter designated as the ESFERA sample. Our analysis successfully identified these stellar aggregates alongside several previously catalog clusters, confirming the robustness of our selection criteria. Figure 4 illustrates the spatial distribution of these new candidates in relation to known open clusters in the literature (Cantat-Gaudin et al. (2020); Hao et al. (2022); Hunt & Reffert (2023); Cavallo et al. (2024)). While the known clusters served to validate the performance of the HDBSCAN algorithm in this region, their detailed multiwavelength analysis will be addressed in a future study.
4.1 ESFERA 1
Within the subregion defined by 320° ≤ l ≤ 321° and −1° ≤ b ≤ +1°, we analyzed a sample of 53 076 stars. Using the HDB-SCAN algorithm with min_samples = min_cluster_size = 10, we identified an open cluster comprising 16 members. The mean astrometric parameters for this cluster are ![Mathematical equation: $\[\bar{\alpha}=227^{\circ}_\cdot323 \pm 0.028, \bar{\delta}=-58^{\circ}_\cdot427 \pm 0.011, \overline{\mu_{\alpha} ~\cos~ \delta}=-3.46 \pm 0.04 ~\mathrm{mas} ~\mathrm{yr}^{-1}, \overline{\mu_{\delta}}=-2.86 \pm 0.03 ~\mathrm{mas} ~\mathrm{yr}^{-1}, \bar{\varpi}=0.39 \pm 0.01\]$](/articles/aa/full_html/2026/08/aa58815-25/aa58815-25-eq5.png) mas, and
mas, and ![Mathematical equation: $\[\bar{d}=2452 \pm 59 ~\mathrm{pc}\]$](/articles/aa/full_html/2026/08/aa58815-25/aa58815-25-eq6.png) .
.
For ESFERA 1, we found ![Mathematical equation: $\[\sqrt{\sigma_{\mu_{\alpha} ~\cos~ \delta}^{2}+\sigma_{\mu_{\delta}}^{2}}=0.41 ~\mathrm{mas} ~\mathrm{yr}^{-1}\]$](/articles/aa/full_html/2026/08/aa58815-25/aa58815-25-eq7.png) and r50 = 2.08 pc. Figures 5a and b show the spatial distribution in Galactic coordinates and the Vector Point Diagram (VPD) of the candidate members. Figure 5c shows that the members of ESFERA 1 are more densely grouped than a subset of 500 local field stars. They thus fulfill the three conditions described in Section 3.1.
and r50 = 2.08 pc. Figures 5a and b show the spatial distribution in Galactic coordinates and the Vector Point Diagram (VPD) of the candidate members. Figure 5c shows that the members of ESFERA 1 are more densely grouped than a subset of 500 local field stars. They thus fulfill the three conditions described in Section 3.1.
The stars of this open cluster identified as 1 and 2 in Figs. 5d-e correspond to Gaia DR3 5880039205832933632 and Gaia DR3 5880038862235534720, respectively. Their QNIR values of 0.45 and 0.30 suggest that they are both likely early-type stars. By dereddening these stars using the AG/AV = 0.789 reddening law (Wang & Chen 2019), we placed accurately on the 30 Myr isochrone. Their derived mass and temperature values are consistent with spectral types B+, and possibly, B3 V and B4 V, respectively. While these two potential members of ESFERA 1 appear significantly reddened, their positions in the IR color–color diagram (see Fig. 5e) are consistent with normally reddened stars. The other 14 potential members of the ESFERA 1 open cluster, based on their placement along the isochrone, appear to be early-type stars ranging from B+ to A+. However, the Lyman-continuum photons emitted by these stars lack the necessary flux to ionize the interstellar medium and generate the HII region observed in this area. Furthermore, while the [R2003] 387 HII region (Murray & Rahman 2010) appears to be spatially coincident with ESFERA 1, its distance remains unknown. Another HII region, G 320.252–00.332, was also investigated, but its near-kinematic distance of 4.7 kpc (Anderson et al. 2014) confirmed that it is not physically associated with the cluster. An average visual extinction of Av = 4.0 mag was adopted for the cluster, as discussed in Sect. 3.2. The complete list of members for ESFERA 1, including their astrometric parameters and multiwavelength photometry, is provided in Tables A.1 and B.1, respectively.
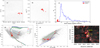 |
Fig. 5 Multiparametric analysis of the open cluster ESFERA 1. (a) Spatial distribution in Galactic coordinates and (b) VPD of the candidate members (filled red circles) compared to the field population (light gray dots). (c) Histogram of the ninth-nearest neighbor distances for ESFERA 1 members (red) and a control subset of 500 local field stars (blue). (d) Optical CMD. The brown curve represents the MS fitted to a distance of 2452 pc and AV = 4 mag. The black curve denotes the best-fit PARSEC v1.2S isochrone, and the blue and green curves represent the ~ 15% age uncertainties. (e) NIR CMD, where the black and brown curves indicate the MS shifted according to the adopted distance, with and without interstellar reddening, respectively. (f) Spatial projection of candidate members onto the SUMSS 843 MHz radio image. The red contours trace the HII emission of [R2003] 387 (Murray & Rahman 2010), and the contour levels are 5 (~5σrms), 10, 50, 100, 150, 200, 250, and 300 mJybeam−1. |
4.2 ESFERA 2
Within the subregion defined by 321° ≤ l ≤ 322° and −1° ≤ b ≤ +1°, we analyzed a sample of 51 327 stars. Using min_samples = min_cluster_size = 10, we identified an open cluster comprising 17 members. Its mean astrometric parameters are ![Mathematical equation: $\[\bar{\alpha}=230^{\circ}_\cdot220 \pm 0.036, \bar{\delta}=-57^{\circ}_\cdot737 \pm 0.013, \overline{\mu_{\alpha} ~\cos~ \delta}=-3.59 \pm 0.04 ~\mathrm{mas} ~\mathrm{yr}^{-1}, \overline{\mu_{\delta}}=-3.50 \pm 0.03\]$](/articles/aa/full_html/2026/08/aa58815-25/aa58815-25-eq8.png) mas yr−1,
mas yr−1, ![Mathematical equation: $\[\bar{\varpi}\]$](/articles/aa/full_html/2026/08/aa58815-25/aa58815-25-eq9.png) = 0.52±0.01 mas, and
= 0.52±0.01 mas, and ![Mathematical equation: $\[\bar{d}=1907 \pm 32 ~\mathrm{pc}\]$](/articles/aa/full_html/2026/08/aa58815-25/aa58815-25-eq10.png) . For ESFERA 2, we obtained a proper motion dispersion of
. For ESFERA 2, we obtained a proper motion dispersion of ![Mathematical equation: $\[\sqrt{\sigma_{\mu_{\alpha} ~\cos~ \delta}^{2}+\sigma_{\mu_{\delta}}^{2}}=0.51 ~\mathrm{mas} ~\mathrm{yr}^{-1}\]$](/articles/aa/full_html/2026/08/aa58815-25/aa58815-25-eq11.png) and a half-mass radius of r50 = 2.16 pc. As shown in Fig. C.1c, ESFERA 2 is significantly denser than a representative subset of 500 local field stars, confirming its cluster nature.
and a half-mass radius of r50 = 2.16 pc. As shown in Fig. C.1c, ESFERA 2 is significantly denser than a representative subset of 500 local field stars, confirming its cluster nature.
The stars identified as 1 and 2 in Figs. C.1d-e correspond to Gaia DR3 5883123679555965184 and Gaia DR3 5883127935846172416, respectively. Star 1 yields a QNIR value of 0.32, which initially suggests an early-type main-sequence star. However, its position relative to the fitted isochrone in the CMD indicates that it has already evolved past the main-sequence turn-off point. Consequently, the appropriate luminosity class for this source is likely that of a giant (LC III) or supergiant (LC I). This classification is consistent with the estimated cluster age of 50 Myr, derived from the evolutionary analysis of its probable members. Star 2, as shown in Fig. C.1e, is located to the right of the reddening vector for O-type dwarf stars and yields a QNIR value of −0.23. This region of the JHK diagram is typically populated by YSOs, such as Herbig Ae/Be and T Tauri stars, which exhibit near-infrared excess emission due to circumstellar disks (Lada & Adams 1992). To investigate this YSO candidate, we cross-matched the source with the WISE catalog to analyze its photometric flux according to the classification scheme described by Koenig & Leisawitz (2014). However, Gaia DR3 5883127935846172416 was not detected in the WISE survey, leaving its YSO status unconfirmed. Finally, star 3 (Figs. C.1d-e) corresponds to Gaia DR3 5883133128483745408. It presents a QNIR value of 0.31, nearly identical to that of star 1. In the infrared color–color diagram, it is similarly positioned near the giant reddening vector. In the Gaia CMD, star 3 appears to be highly reddened, suggesting that it is likely an evolved late-type B star. The visual extinction for the cluster was estimated at Av = 3.5 mag (see Sect. 3.2). The supernova remnant G 321.9–0.3 (Green 2019) is also located in the vicinity of ESFERA 2 (see Fig. C.1f). However, multiple factors suggest that this is a line-of-sight coincidence. A detailed discussion of this topic is provided in Sect. 5. The complete list of members for ESFERA 2, including their astrometric parameters and multiwavelength photometry, is provided in Tables A.2 and B.2, respectively.
4.3 ESFERA 3
Within the subregion 322° ≤ l ≤ 323° and −1° ≤ b ≤ + 1°, we analyzed a sample of 45 535 stars. Setting min_samples = min_cluster_size = 10, we identified an open cluster with 20 members. Its mean astrometric parameters are ![Mathematical equation: $\[\bar{\alpha}=230^{\circ}_\cdot079 \pm 0^{\circ}_\cdot032, \bar{\delta}=-57^{\circ}_\cdot189 \pm 0^{\circ}_\cdot020, \overline{\mu_{\alpha} ~\cos~ \delta}=-2.22 \pm 0.05 ~\mathrm{mas} ~\mathrm{yr}^{-1}, \bar{\mu_{\delta}}=-2.15 \pm 0.04 ~\mathrm{mas} ~\mathrm{yr}^{-1}, \bar{\varpi}=0.50 \pm 0.01\]$](/articles/aa/full_html/2026/08/aa58815-25/aa58815-25-eq12.png) mas, and
mas, and ![Mathematical equation: $\[\bar{d}=1939 \pm 34 ~\mathrm{pc}\]$](/articles/aa/full_html/2026/08/aa58815-25/aa58815-25-eq13.png) .
.
For ESFERA 3, we obtained a proper motion dispersion of ![Mathematical equation: $\[\sqrt{\sigma_{\mu_{\alpha} ~\cos~ \delta}^{2}+\sigma_{\mu_{\delta}}^{2}}=0.52 ~\mathrm{mas} ~\mathrm{yr}^{-1}\]$](/articles/aa/full_html/2026/08/aa58815-25/aa58815-25-eq14.png) and a half-mass radius of r50 = 3.57 pc. As illustrated in Fig. C.2c, ESFERA 3 is more densely populated than a representative subset of 500 local field stars, supporting its classification as a physical cluster. ESFERA 3 is the youngest open cluster in our sample, with an estimated age of only 10 Myr. In Fig. C.2e, the presence of reddened stars is clearly evident, specifically, stars 1 (Gaia DR3 5883216622652247808), 2 (Gaia DR3 5883215003418857472), and 3 (Gaia DR3 5883219440150823424). Stars 1 and 3 are recorded in the 2MASS catalog with a quality flag (Qfl) of AAU. This indicates that while the J- and H -band detections are of high photometric quality, the Ks-band measurement is an upper limit, likely due to undefined photometric errors in that filter. In the CMD (Fig. C.2d), these stars are positioned close to each other on the fitted isochrone, allowing us to derive spectral types of F− for star 1 and A+ for star 3. Star 2 presents a QNIR value of −0.47, and its position in the IR color–color diagram exhibits a significant near-infrared excess. Our investigation of the WISE survey with the classification scheme by Koenig & Leisawitz (2014) identified this source as a Class II YSO. These objects are typically characterized by a protoplanetary disk where circumstellar dust reprocesses stellar radiation, creating an infrared excess, even as the primordial envelope begins to dissipate (Allen et al. 2004). The position of star 4 (Gaia DR3 5883232359411945472) in the CMD (see Fig. C.2d) relative to the fitted isochrone corresponds to temperature and mass values consistent with an A+ spectral type. However, its placement in the IR color–color diagram (see Fig. C.2e) is likely an artifact of the poor photometric quality, as indicated by its Qfl flag of AUU. This flag denotes that the H and Ks magnitudes are upper limits, rendering its infrared colors unreliable. Star 5 (Gaia DR3 5883194941656356480) is the most highly reddened star in Fig. C.2d. It presents a QNIR value of 0.15, characteristic of an early main-sequence star, and its position in the Fig. C.2e is consistent with a late spectral type (with a high-quality Qfl of AAA). This source was identified as a Class II YSO, cataloged as AGAL G321.934–00.006 in the ATLASGAL survey of massive cold dust clumps (Wienen et al. 2015). It has a reported heliocentric distance of 2.14 kpc, which closely agrees with the estimated distance for ESFERA 3. We independently verified this classification through an analysis of the WISE catalog, and the two YSOs are indicated in the allWISE color image Fig. 6. Finally, the stars spatially coincident with the HI emission (a possible HII region) possess spectral types A−, F−, and B+. Consequently, none of these stars provides sufficient ionizing flux to ionize the surrounding interstellar medium. The complete list of members for ESFERA 3, including their astrometric parameters and multiwavelength photometry, is provided in Tables A.3 and B.3, respectively.
and a half-mass radius of r50 = 3.57 pc. As illustrated in Fig. C.2c, ESFERA 3 is more densely populated than a representative subset of 500 local field stars, supporting its classification as a physical cluster. ESFERA 3 is the youngest open cluster in our sample, with an estimated age of only 10 Myr. In Fig. C.2e, the presence of reddened stars is clearly evident, specifically, stars 1 (Gaia DR3 5883216622652247808), 2 (Gaia DR3 5883215003418857472), and 3 (Gaia DR3 5883219440150823424). Stars 1 and 3 are recorded in the 2MASS catalog with a quality flag (Qfl) of AAU. This indicates that while the J- and H -band detections are of high photometric quality, the Ks-band measurement is an upper limit, likely due to undefined photometric errors in that filter. In the CMD (Fig. C.2d), these stars are positioned close to each other on the fitted isochrone, allowing us to derive spectral types of F− for star 1 and A+ for star 3. Star 2 presents a QNIR value of −0.47, and its position in the IR color–color diagram exhibits a significant near-infrared excess. Our investigation of the WISE survey with the classification scheme by Koenig & Leisawitz (2014) identified this source as a Class II YSO. These objects are typically characterized by a protoplanetary disk where circumstellar dust reprocesses stellar radiation, creating an infrared excess, even as the primordial envelope begins to dissipate (Allen et al. 2004). The position of star 4 (Gaia DR3 5883232359411945472) in the CMD (see Fig. C.2d) relative to the fitted isochrone corresponds to temperature and mass values consistent with an A+ spectral type. However, its placement in the IR color–color diagram (see Fig. C.2e) is likely an artifact of the poor photometric quality, as indicated by its Qfl flag of AUU. This flag denotes that the H and Ks magnitudes are upper limits, rendering its infrared colors unreliable. Star 5 (Gaia DR3 5883194941656356480) is the most highly reddened star in Fig. C.2d. It presents a QNIR value of 0.15, characteristic of an early main-sequence star, and its position in the Fig. C.2e is consistent with a late spectral type (with a high-quality Qfl of AAA). This source was identified as a Class II YSO, cataloged as AGAL G321.934–00.006 in the ATLASGAL survey of massive cold dust clumps (Wienen et al. 2015). It has a reported heliocentric distance of 2.14 kpc, which closely agrees with the estimated distance for ESFERA 3. We independently verified this classification through an analysis of the WISE catalog, and the two YSOs are indicated in the allWISE color image Fig. 6. Finally, the stars spatially coincident with the HI emission (a possible HII region) possess spectral types A−, F−, and B+. Consequently, none of these stars provides sufficient ionizing flux to ionize the surrounding interstellar medium. The complete list of members for ESFERA 3, including their astrometric parameters and multiwavelength photometry, is provided in Tables A.3 and B.3, respectively.
4.4 ESFERA 4
In addition to ESFERA 3, within the same subregion (322° ≤ l ≤ 323°, −1° ≤ b ≤ + 1°) and using min_samples = min_cluster_size = 10, we identified another open cluster consisting of 14 members. Its mean astrometric parameters are ![Mathematical equation: $\[\bar{\alpha}=229^{\circ}_\cdot860 \pm 0^{\circ}_\cdot038, \bar{\delta}=-56^{\circ}_\cdot399 \pm 0^{\circ}_\cdot011, \overline{\mu_{\alpha} ~\cos~ \delta}=-2.43 \pm 0.03 ~\mathrm{mas} ~\mathrm{yr}^{-1}, \overline{\mu_{\delta}}=-3.01 \pm 0.05 ~\mathrm{mas} ~\mathrm{yr}^{-1}, \bar{\varpi}=0.59 \pm 0.01\]$](/articles/aa/full_html/2026/08/aa58815-25/aa58815-25-eq15.png) mas, and
mas, and ![Mathematical equation: $\[\bar{d}=1648 \pm 24 ~\mathrm{pc}\]$](/articles/aa/full_html/2026/08/aa58815-25/aa58815-25-eq16.png) . For ESFERA 4, we found a proper motion dispersion of
. For ESFERA 4, we found a proper motion dispersion of ![Mathematical equation: $\[\sqrt{\sigma_{\mu_{\alpha} ~\cos~ \delta}^{2}+\sigma_{\mu_{\delta}}^{2}}=0.61 ~\mathrm{mas} ~\mathrm{yr}^{-1}\]$](/articles/aa/full_html/2026/08/aa58815-25/aa58815-25-eq17.png) and a half-mass radius of r50 = 1.90 pc. As shown in Fig. C.3c, ESFERA 4 is denser than a representative subset of 500 local field stars.
and a half-mass radius of r50 = 1.90 pc. As shown in Fig. C.3c, ESFERA 4 is denser than a representative subset of 500 local field stars.
Stars 1 (Gaia DR3 58863349440504533248) and 2 (Gaia DR3 58863363386248420736) possess a 2MASS photometric Qfl of AUU, indicating that their resulting infrared colors are unreliable, similar to star 4 in ESFERA 3. The calculated QNIR values of 1.34 and 0.76 for sources number 1 and 2 are likely unphysical artifacts. When plotted on the 20 Myr isochrone, the positions of these two stars suggest that they are late-type objects, with estimated spectral types of F− and F+, respectively. Stars 3 (Gaia DR3 58863257425123101568) and 4 (Gaia DR3 58863352429801298816) are the oldest members of ESFERA 4, both characterized by a G− spectral type. Regarding their 2MASS JHKs fluxes, the former has a Qfl of AAU and a QNIR of −0.19, while the latter has a Qfl of AAA and a QNIR of 0.00. The positions of the two stars in the IR color–color diagram are typical of their respective spectral types. Star 5 (Gaia DR3 58863352567240269312) is the most highly reddened member of the cluster. By fitting the isochrone with the AG/AV = 0.789 reddening law, we derived a most probable spectral type of B+. Interestingly, its placement in the IR color–color diagram is somewhat anomalous, as it lies within the region that is typically occupied by late-type main-sequence stars. However, because the photometric quality in all three bands is excellent (AAA) and the QNIR value is 0.08 (consistent with a standard stellar atmosphere), this displacement is likely a result of the high extinction affecting the source and not an intrinsic near-infrared excess. Regarding the interstellar medium (see Fig. C.3)f, this open cluster is located in proximity to the HII region G322.153+00.613, although their spatial positions do not overlap. The complete list of members for ESFERA 4, including their astrometric parameters and multiwavelength photometry, is provided in Tables A.4 and B.4, respectively.
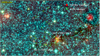 |
Fig. 6 AllWISE color-composite image of the ESFERA 3 region ( |
![Mathematical equation: $\[\mathrm{l}= 320^{\circ}_\cdot0, \mathrm{b}=0^{\circ}_\cdot0\]$](/articles/aa/full_html/2026/08/aa58815-25/aa58815-25-eq18.png)
4.5 ESFERA 5
Within the subregion 324° ≤ l ≤ 325° and −1° ≤ b ≤ + 1°, we analyzed a sample of 52 417 stars. By increasing the clustering threshold to min_samples = min_cluster_size = 15, we identified an open cluster consisting of 16 members. Its mean astrometric parameters are ![Mathematical equation: $\[\bar{\alpha}=232^{\circ}_\cdot601 \pm 0^{\circ}_\cdot029, \bar{\delta}= -55^{\circ}_\cdot721 \pm 0^{\circ}_\cdot013, \overline{\mu_{\alpha} \cos \delta}=-3.27 \pm 0.07 ~\mathrm{mas} ~\mathrm{yr}^{-1}, \overline{\mu_{\delta}}= -3.15 \pm 0.04 ~\mathrm{mas} ~\mathrm{yr}^{-1}, \bar{\varpi}=0.40 \pm 0.01\]$](/articles/aa/full_html/2026/08/aa58815-25/aa58815-25-eq19.png) mas, and
mas, and ![Mathematical equation: $\[\bar{d}=2417 \pm 49 ~\mathrm{pc}\]$](/articles/aa/full_html/2026/08/aa58815-25/aa58815-25-eq20.png) . For ESFERA 5, we obtained a proper motion dispersion of
. For ESFERA 5, we obtained a proper motion dispersion of ![Mathematical equation: $\[\sqrt{\sigma_{\mu_{\alpha} ~\cos~ \delta}^{2}+\sigma_{\mu_{\delta}}^{2}}=0.41 ~\mathrm{mas} ~\mathrm{yr}^{-1}\]$](/articles/aa/full_html/2026/08/aa58815-25/aa58815-25-eq21.png) and a half-mass radius of r50 = 2.41 pc. As illustrated in Fig. C.4c, ESFERA 5 is more densely populated than a representative subset of 500 local field stars
and a half-mass radius of r50 = 2.41 pc. As illustrated in Fig. C.4c, ESFERA 5 is more densely populated than a representative subset of 500 local field stars
This is a particularly noteworthy open cluster. At 2 Gyr, it is significantly older than the other clusters we identified. Furthermore, it alone of the five discovered clusters contains potential blue straggler stars (BSS) among its probable members. These candidates, labeled 1 (Gaia DR3 5883844512499441280) through 6 (Gaia DR3 5883838911861950720), are located above and blueward of the main-sequence turn-off point. They represent a population of rejuvenated stars, whose presence indicates an interesting dynamical history that is further analyzed in Sect. 5. Stars 7 (Gaia DR3 5883837915429150592) and 8 (Gaia DR3 5883841832439453056) are the only sources fitted on the main sequence with a luminosity class V (see Fig. C.4d). The remaining sources, numbered 9 (Gaia DR3 5883845165334464256) through 16 (Gaia DR3 5883837086485049088), are potential giants; in Fig. C.4e, stars 9, 10 (Gaia DR3 5883844100182546944), 11 (Gaia DR3 5883840698568446208), and 13 (Gaia DR3 5883844375059980800) occupy the region typical of late-type stars, and stars 14 (Gaia DR3 5883843992792751232), 15 (Gaia DR3 5883844993535795840), and 16 are consistent with the giant branch. Notably, star 4 (Gaia DR3 5883842210396958720) has no reported magnitudes in the near-infrared J, H, K bands, and star 12 (Gaia DR3 5883840732928203776) has a Qfl of AUU. The last result likely explains its significant displacement from the sequence on which stars with standard interstellar extinction are expected to lie. The complete list of members for ESFERA 5, including their astrometric parameters and multiwavelength photometry, is provided in Tables A.5 and B.5, respectively.
5 Discussion
Our analysis revealed that some diverse population of OCs traces the Carina-Sagittarius Arm within 320° ≤ l ≤ 325°. We found a diversity in morphology, with structures varying from compact, such as ESFERA 4 (r50 < 2 pc), to more extended, such as ESFERA 3 (r50 > 3.5 pc). Furthermore, the clustering algorithm effectively separated structures projected along the same line of sight, but located at different distances, such as ESFERA 3 (~1.9 kpc) and ESFERA 4 (~1.6 kpc), providing a clearer view of the stellar distribution at different depths of the spiral arm. Figure 2 reveals the density drops by more than 50% compared to adjacent regions. The discovery of the five ESFERA clusters in this specific gap significantly improves the census of the stellar population in this undersampled section of the Galactic disk. The robustness of our method stems from the ability of the HDBSCAN algorithm to operate in a high-dimensional parameter space, which allowed us to effectively segregated stellar populations that appear to be blended in traditional proper motion or spatial projections. By simultaneously processing five-dimensional astrometric data (α, δ, μα cos δ, μδ, and ϖ), our approach successfully identified distinct stellar groups that share nearly identical proper motions, but are clearly separated by their parallax values. This high-dimensional clustering capability is critical for minimizing field star contamination and enables the detection of sparse clusters that would remain hidden in traditional 2D or 3D searches, particularly within the high-density and high-extinction environments of the Galactic plane.
5.1 ESFERA 1
The estimated age of 30 Myr for ESFERA 1, derived from the isochrone fitting, strongly supports the conclusion that the cluster is not physically associated with the HII region [R2003] 387. At an age of 30 Myr, any massive O-type stars, which are essential for providing the ionizing Lyman-continuum flux required to maintain an HII region, would have already evolved off the main sequence or ended their life cycles as supernovae. The most massive members we identified, classified as B+ (probably B3 V and B4 V spectral types), are perfectly consistent with a 30 Myr population, but their ionizing photon rate (log NLyC) is several orders of magnitude below the threshold needed to sustain the observed radio emission in the region. Furthermore, while stars 1 and 2 exhibit significant reddening, their alignment with the standard reddening vector in the JHKs IR color–color diagram suggests that this extinction is primarily interstellar and not circumstellar. This indicates that ESFERA 1 has already cleared its natal gas and dust, a process that is typically completed within the first 10 Myr of the life of a cluster. Consequently, the spatial coincidence between ESFERA 1 and the [R2003] 387 HII region is likely a chance alignment along the line of sight. This is analogous to our findings for G320.252–00.332, where the near-kinematic distance of 4.7 kpc (Anderson et al. 2014) clearly places it at a different Galactic location, further confirming that ESFERA 1 is an independent stellar population.
5.2 ESFERA 2, 3, and 4
The spatial proximity of these new candidates to interstellar features provides further insights into their evolutionary history. For ESFERA 2, the identification of star 2 as a potential YSO candidate based on its JHKs color excess presents a chronological discrepancy. While this excess suggests the presence of a circumstellar disk, such structures typically dissipate within 5–10 Myr, which is significantly shorter than the estimated age of 50 Myr of the cluster. Since the source lacks a WISE counterpart to confirm a mid-infrared excess, its position in the IR color–color diagram might instead be explained by extreme localized extinction, or alternatively, it might be a background YSO that is unrelated to the cluster. Another possibility is that star 2 is a classical Be star, where the infrared excess originates from a gaseous decretion disk rather than a primordial pre-main-sequence disk (Zorec & Briot 1997), which would be more consistent with the evolved nature of the cluster. Another relevant aspect regarding this cluster is its possible relation with the SNR G321.9–0.3. Previous estimates placed this remnant at a distance of approximately 5.5 kpc (Case & Bhattacharya 1998), which differs from the distance we derived for the cluster. More importantly, the SNR is associated with the X-ray binary Circinus X-1, a system originating from a very massive progenitor. Because ESFERA 2 is 50 Myr old, any such massive star would have exploded tens of millions of years ago. The presence of a visible SNR today (which typically lasts only ~105 years) clearly indicates a much more recent supernova event unrelated to the cluster evolution.
A similar environmental analysis was conducted for ESFERA 3, focusing on its association with local gas. It is noteworthy that while stars 1, 3, and 4 (spectral types A and F) of this OC are located in regions with detectable HI emission, star 2 is not. This contrast reinforces the classification of star 2 as a more primordial or less evolved object than the other members. The A- and F-type stars, despite their young age, appear to have already emerged from the densest molecular cores, whereas star 2 remains tied to a region that has not yet transitioned to a diffuse atomic phase.
The cluster ESFERA 4, as noted in Sect. 4.4, is located in proximity to the HII region G322.153+00.613, although their current spatial positions do not overlap. Furthermore, an analysis of the member proper motions suggested that their locations were also not coincident at the time of cluster formation; since their motion is oriented toward the HII region (see Fig. 3), it is unlikely that they share a common origin or that triggered star formation occurred between them.
5.3 ESFERA 5
The open cluster ESFERA 5 has an estimated age of ~2 Gyr, which is highly atypical for an open cluster situated near the Galactic plane. Open clusters in this region are generally expected to be rapidly dynamically disrupted Janes & Phelps (1994) by frequent encounters with giant molecular clouds (GMCs) Spitzer (1958) and strong Galactic tidal forces Wielen (1985). The longevity of this specific cluster, however, suggests a distinct survival mechanism. Its persistence up to 2 Gyr, despite being close to the disk, is further supported by the presence of BSS among its members. The stellar membership of ESFERA 5 was robustly established via an astrometric analysis of Gaia DR3 data. Following this, the BSS population was identified from the CMD by their position significantly above and blueward of the main-sequence turn-off point, consistent with a rejuvenation of stars more massive than the cluster turn-off mass. The astrometric solution for these BSS candidates indicates a low RUWE value, which might initially suggest a lack of close binary activity. We must account for the fact that the sensitivity of RUWE to binarity decreases significantly at distances of ~2.5 kpc (Penoyre et al. 2022; Castro-Ginard et al. 2024). Consequently, we consider two potential formation channels for the BSS population in ESFERA 5. First, if these stars are indeed single objects, as the astrometric solution suggests, their formation would likely be driven by direct stellar collisions in a high-density core environment. This would imply that ESFERA 5 was significantly more massive and compact in its early stages. Alternatively, given the distance-related limitations of RUWE, we cannot rule out the mass transfer channel in primordial binary systems (Rain et al. 2024). The presence of such a significant BSS population (regardless of the specific formation mechanism) remains a compelling indicator of the complex dynamical cluster evolution over its 2 Gyr lifetime. Furthermore, the 2 Gyr age of ESFERA 5 denotes an evolved stellar population that lacks the capacity to ionize or mechanically disrupt the local interstellar medium. The HII region G324.147+00.231 (Anderson et al. 2014) indicated in Fig. C.4f is located at an angular distance of ~38′, which is approximately four times the estimated cluster radius. This significant spatial offset, combined with the fact that its population cannot generate such HII region, confirms that G324.147+00.231 is a non-associated object, likely projected along a similar line of sight. Old open clusters are typically not considered primary tracers of recent star formation within spiral features, but we included ESFERA 5 in our analysis due to its unique characteristics and its absence from previous catalogs.
The detection of ESFERA 5 (log t ≈ 9.3, AV > 3, b = 0°.8) is particularly consistent with the selection functions described by Hunt et al. (2025, see their Fig. 3). According to their analysis, clusters in this age and extinction regime within the Galactic plane have a recovery probability below 15%, highlighting the effectiveness of our high-purity regional search in identifying older sparse populations that often elude global automated algorithms. Despite its estimated age of 2 Gyr, this cluster is particularly noteworthy for hosting a population of blue straggler stars among its members. The identification of such a mature system, containing clear evidence of stellar interactions, provides valuable insights into the dynamical history and the long-term stellar population of the Carina–Sagittarius region.
The findings in the current 320° ≤ l ≤ 325° sector are consistent with but distinct from previous investigations in the neighboring Carina region. Specifically, at ![Mathematical equation: $\[l=316^{\circ}_\cdot8\]$](/articles/aa/full_html/2026/08/aa58815-25/aa58815-25-eq22.png) , a multiwavelength approach revealed a population of three embedded clusters associated with early-type stars and different classes of YSOs (Corti et al. 2023). The presence of these objects at
, a multiwavelength approach revealed a population of three embedded clusters associated with early-type stars and different classes of YSOs (Corti et al. 2023). The presence of these objects at ![Mathematical equation: $\[l=316^{\circ}_\cdot8\]$](/articles/aa/full_html/2026/08/aa58815-25/aa58815-25-eq23.png) provides a direct point of comparison for the ESFERA sample, marking the transition from the active star-forming complexes of the Carina arm toward a more quiescent sector. The region spanning l ∈ [320°, 325°] exhibits a significant deficit of young star-forming tracers compared to the l ≈ 316° area. We propose that this sector represents a clear observational example of a star formation valley (or gap) resulting from the periodic fragmentation of the interstellar medium, as modeled by the magneto-gravitational instability Elmegreen (1982); Kim & Ostriker (2002).
provides a direct point of comparison for the ESFERA sample, marking the transition from the active star-forming complexes of the Carina arm toward a more quiescent sector. The region spanning l ∈ [320°, 325°] exhibits a significant deficit of young star-forming tracers compared to the l ≈ 316° area. We propose that this sector represents a clear observational example of a star formation valley (or gap) resulting from the periodic fragmentation of the interstellar medium, as modeled by the magneto-gravitational instability Elmegreen (1982); Kim & Ostriker (2002).
In the context of the morphology of beads on a string described by Efremov (2010), our study area appears to function as the string, or the low-density node connecting two major star forming complexes (the beads): the dense Carina region at l < 310° and the Centaurus complex at l > 330°. This spatial distribution suggests that large-scale gravitational and magnetic forces have effectively channeled gas away from this segment to feed the adjacent massive complexes. Consequently, the local surface density in this region has fallen below the critical threshold required to trigger collapse, maintaining it in a quiescent state compared to its immediate Galactic surroundings. In this context, the discovery of the ESFERA sample provides a crucial contribution to this scenario of beads on a string. While the region 320° ≤ l ≤ 325° lacks the massive star-forming complexes found in Carina or Centaurus, our identification of five new open clusters (particularly the youngest system, e.g., ESFERA 3 with its associated YSOs) demonstrates that star formation is not entirely suppressed in this string segment. Instead, it occurs in smaller, more isolated pockets where the local gas density exceeds the collapse threshold. This suggests that the valley is not a void, but rather a region of lower-efficiency star formation that requires high-precision surveys such as ours to be fully characterized.
6 Conclusions
We bridged a significant observational gap in the Carina–Sagittarius Arm, specifically, within the region 320° ≤ l ≤ 325°, by conducting a systematic search for previously uncatalogued open clusters. To achieve this, we performed a comprehensive multiwavelength analysis, integrating astrometric and photometric data from Gaia DR3 with near- and mid-infrared photometry from 2MASS and WISE and radio continuum data from SUMSS (843 MHz). This approach led to the discovery of five OCs, all located within the Galactic plane (−1° ≤ b ≤ 1°). Our sample is primarily composed of four young systems with ages ranging between 10 and 50 Myr. Additionally, we identified ESFERA 5 as a significantly older system, with an estimated age of 2 Gyr, highlighting the presence of evolved populations and the existence of BSS members in this Galactic sector.
The ESFERA sample reveals a clear evolutionary sequence of young stellar populations. ESFERA 3 stands out as the youngest system in our census, with an age of 10 Myr and confirmed YSOs, indicating a very recent star formation event. The remaining young sample (with ages of 20, 30, and 50 Myr) completes this age distribution, providing a comprehensive snapshot of the star formation history in this sector of the Carina–Sagittarius arm.
The implementation of the HDBSCAN clustering algorithm on Gaia DR3 astrometry proved to be a powerful tool for isolating these systems from the dense Galactic field. By combining this with a multiwavelength validation (visual to radio), we were able to confirm the physical reality of these candidates, effectively overcoming the high extinction levels and stellar crowding characteristic of the Carina–Sagittarius sector. Our analysis of the interaction between the clusters and their environment revealed that spatial proximity does not necessarily imply a common origin. Stellar populations of different ages and evolutionary stages indeed frequently overlap along the same line of sight within the spiral arm, highlighting the complex structural assembly of the Carina-Sagittarius region. This complexity underscores the need for a systematic census, which is continued in the second part of this study.
Acknowledgements
The authors thank the anonymous referee for the constructive comments and N. Duronea and C. Damia Rincón for useful feedback. The financial support I+D G205 from the Universidad Nacional de La Plata (UNLP). Special thanks are also due to Aylín Gimenez Corti for her dedicated help with the language and text revision. This work used NASA’s ADS, the SIMBAD database, and ALADIN tools (CDS, France). It also used 2MASS and WISE data (funded by NASA and NSF/UCLA/JPL), and the SUMSS radio survey (MOST, Australia). Data from the ESA mission Gaia (https://www.cosmos.esa.int/gaia) was processed by the Gaia DPAC (https://www.cosmos.esa.int/web/gaia/dpac/consortium).
References
- Allen, L. E., Calvet, N., D’Alessio, P., et al. 2004, ApJS, 154, 363 [Google Scholar]
- Anderson, L. D., Bania, T. M., Balser, D. S., et al. 2014, ApJS, 212, 1 [Google Scholar]
- Ball, B. D., Kothes, R., Rosolowsky, E., et al. 2025, ApJ, 988, 75 [Google Scholar]
- Bock, D. C.-J., Large, M. I., & Sadler, E. M. 1999, AJ, 117, 1578 [Google Scholar]
- Borissova, J., Georgiev, L., Hanson, M. M., et al. 2012, A&A, 546, A110 [NASA ADS] [CrossRef] [EDP Sciences] [Google Scholar]
- Bressan, A., Marigo, P., Girardi, L., et al. 2012, MNRAS, 427, 127 [NASA ADS] [CrossRef] [Google Scholar]
- Campello, R. J. G. B., Moulavi, D., & Sander, J. 2013, in Advances in Knowledge Discovery and Data Mining, eds. J. Pei, V. S. Tseng, L. Cao, H. Motoda, & G. Xu (Berlin, Heidelberg: Springer Berlin Heidelberg), 160 [Google Scholar]
- Cantat-Gaudin, T., & Anders, F. 2020, A&A, 633, A99 [NASA ADS] [CrossRef] [EDP Sciences] [Google Scholar]
- Cantat-Gaudin, T., Anders, F., Castro-Ginard, A., et al. 2020, A&A, 640, A1 [NASA ADS] [CrossRef] [EDP Sciences] [Google Scholar]
- Carpenter, J. M. 2001, AJ, 121, 2851 [Google Scholar]
- Case, G. L., & Bhattacharya, D. 1998, ApJ, 504, 761 [NASA ADS] [CrossRef] [Google Scholar]
- Castro-Ginard, A., Penoyre, Z., Casey, A. R., et al. 2024, A&A, 688, A1 [NASA ADS] [CrossRef] [EDP Sciences] [Google Scholar]
- Cavallo, L., Spina, L., Carraro, G., et al. 2024, AJ, 167, 12 [NASA ADS] [CrossRef] [Google Scholar]
- Chen, B. Q., Huang, Y., Hou, L. G., et al. 2019, MNRAS, 487, 1400 [NASA ADS] [CrossRef] [Google Scholar]
- Choi, Y. K., Hachisuka, K., Reid, M. J., et al. 2014, ApJ, 790, 99 [NASA ADS] [CrossRef] [Google Scholar]
- Corti, M. A., Baume, G. L., Orellana, R. B., & Suad, L. A. 2023, A&A, 674, A55 [NASA ADS] [CrossRef] [EDP Sciences] [Google Scholar]
- Dean, J. F., Warren, P. R., & Cousins, A. W. J. 1978, MNRAS, 183, 569 [NASA ADS] [CrossRef] [Google Scholar]
- Dias, W. S., Monteiro, H., Moitinho, A., et al. 2021, MNRAS, 504, 356 [NASA ADS] [CrossRef] [Google Scholar]
- Efremov, Y. N. 1998, Astron. Astrophys. Trans., 15, 3 [Google Scholar]
- Efremov, Y. N. 2010, MNRAS, 405, 1531 [NASA ADS] [Google Scholar]
- Elmegreen, B. G. 1982, ApJ, 253, 655 [Google Scholar]
- Gaia Collaboration (Prusti, T., et al.) 2016, A&A, 595, A1 [NASA ADS] [CrossRef] [EDP Sciences] [Google Scholar]
- Gaia Collaboration (Vallenari, A., et al.) 2023, A&A, 674, A1 [NASA ADS] [CrossRef] [EDP Sciences] [Google Scholar]
- Gooch, R. 1996, in Astronomical Society of the Pacific Conference Series, 101, Astronomical Data Analysis Software and Systems V, eds. G. H. Jacoby, & J. Barnes, 80 [Google Scholar]
- Green, D. A. 2019, J. Astrophys. Astron., 40, 36 [Google Scholar]
- Hao, C. J., Xu, Y., Wu, Z. Y., et al. 2022, A&A, 660, A4 [NASA ADS] [CrossRef] [EDP Sciences] [Google Scholar]
- Hou, L. G., & Han, J. L. 2014, A&A, 569, A125 [NASA ADS] [CrossRef] [EDP Sciences] [Google Scholar]
- Hunt, E. L., & Reffert, S. 2021, A&A, 646, A104 [NASA ADS] [CrossRef] [EDP Sciences] [Google Scholar]
- Hunt, E. L., & Reffert, S. 2023, A&A, 673, A114 [NASA ADS] [CrossRef] [EDP Sciences] [Google Scholar]
- Hunt, E. L., Cantat-Gaudin, T., Anders, F., et al. 2025, A&A, 699, A273 [NASA ADS] [CrossRef] [EDP Sciences] [Google Scholar]
- Janes, K. A., & Phelps, R. L. 1994, AJ, 108, 1773 [NASA ADS] [CrossRef] [Google Scholar]
- Jordi, C., Gebran, M., Carrasco, J. M., et al. 2010, A&A, 523, A48 [NASA ADS] [CrossRef] [EDP Sciences] [Google Scholar]
- Joshi, Y. C. 2025, New A, 121, 102425 [Google Scholar]
- Joye, W., oldherl, Burke, D., & Glotfelty, K. 2025, https://doi.org/10.5281/zenodo.1172112 [Google Scholar]
- Kim, W.-T., & Ostriker, E. C. 2002, ApJ, 570, 132 [Google Scholar]
- Koenig, X. P., & Leisawitz, D. T. 2014, ApJ, 791, 131 [Google Scholar]
- Koornneef, J. 1983, A&A, 128, 84 [NASA ADS] [Google Scholar]
- Lada, C. J., & Adams, F. C. 1992, ApJ, 393, 278 [Google Scholar]
- Landolt-Bornstein, & Bursa, M. 1982, Bull. Astron. Inst. Czech., 33, 380 [Google Scholar]
- Liu, X., He, Z., Luo, Y., & Wang, K. 2025, MNRAS, 537, 2403 [Google Scholar]
- Messineo, M., Menten, K. M., Churchwell, E., & Habing, H. 2012, A&A, 537, A10 [Google Scholar]
- Molina Lera, J. A., Baume, G., & Gamen, R. 2018, MNRAS, 480, 2386 [NASA ADS] [CrossRef] [Google Scholar]
- Murray, N., & Rahman, M. 2010, ApJ, 709, 424 [NASA ADS] [CrossRef] [Google Scholar]
- Negueruela, I., Marco, A., Israel, G. L., & Bernabeu, G. 2007, A&A, 471, 485 [NASA ADS] [CrossRef] [EDP Sciences] [Google Scholar]
- Paíz, L. G., Biasi, M. S. D., Orellana, R. B., & Corti, M. A. 2025, Int. J. Astron. Astrophys., 15, 171 [Google Scholar]
- Pedregosa, F., Varoquaux, G., Gramfort, A., et al. 2011, J. Mach. Learn. Res., 12, 2825 [Google Scholar]
- Penoyre, Z., Belokurov, V., & Evans, N. W. 2022, MNRAS, 513, 2437 [NASA ADS] [CrossRef] [Google Scholar]
- Perren, G. I., Pera, M. S., Navone, H. D., & Vázquez, R. A. 2023, MNRAS, 526, 4107 [NASA ADS] [CrossRef] [Google Scholar]
- Poleski, R. 2013, arXiv e-prints [arXiv:1306.2945] [Google Scholar]
- Rain, M. J., Pera, M. S., Perren, G. I., et al. 2024, A&A, 685, A33 [NASA ADS] [CrossRef] [EDP Sciences] [Google Scholar]
- Rieke, G. H., & Lebofsky, M. J. 1985, ApJ, 288, 618 [Google Scholar]
- Rizzo, L., Corti, M. A., & Paíz, L. G. 2025, Bol. Asoc. Argentina Astron. La Plata Argentina, 66, 181 [Google Scholar]
- Santos-Silva, T., Perottoni, H. D., Almeida-Fernandes, F., et al. 2021, MNRAS, 508, 1033 [NASA ADS] [CrossRef] [Google Scholar]
- Skrutskie, M. F., Cutri, R. M., Stiening, R., et al. 2006, AJ, 131, 1163 [NASA ADS] [CrossRef] [Google Scholar]
- Spitzer, Jr., L. 1958, ApJ, 127, 17 [NASA ADS] [CrossRef] [Google Scholar]
- Taylor, M. 2011, TOPCAT: Tool for OPerations on Catalogues And Tables, Astrophysics Source Code Library [record ascl:1101.010] [Google Scholar]
- Vázquez, R. A., May, J., Carraro, G., et al. 2008, ApJ, 672, 930 [CrossRef] [Google Scholar]
- Wang, S., & Chen, X. 2019, ApJ, 877, 116 [Google Scholar]
- Wielen, R. 1985, in IAU Symposium, 113, Dynamics of Star Clusters, eds. J. Goodman, & P. Hut, 449 [Google Scholar]
- Wienen, M., Wyrowski, F., Menten, K. M., et al. 2015, A&A, 579, A91 [NASA ADS] [CrossRef] [EDP Sciences] [Google Scholar]
- Wright, E. L., Eisenhardt, P. R. M., Mainzer, A. K., et al. 2010, AJ, 140, 1868 [Google Scholar]
- Zorec, J., & Briot, D. 1997, A&A, 318, 443 [NASA ADS] [Google Scholar]
Appendix A Astrometric results
Probable members of open cluster ESFERA 1 from astrometric analysis.
Probable members of open cluster ESFERA 2 from astrometric analysis.
Probable members of open cluster ESFERA 3 from astrometric analysis.
Probable members of open cluster ESFERA 4 from astrometric analysis.
Probable members of open cluster ESFERA 5 from astrometric analysis.
Appendix B Photometric results
Probable members of open cluster ESFERA 1 from photometric observations.
Probable members of open cluster ESFERA 2 from photometric observations.
Probable members of open cluster ESFERA 3 from photometric observations.
Probable members of open cluster ESFERA 4 from photometric observations.
Probable members of open cluster ESFERA 5 from photometric observations.
Appendix C Additional figures
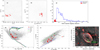 |
Fig. C.1 Multiparametric analysis of the open cluster ESFERA 2. Symbols as in Fig 5. In Fig (d) the MS is fitted to a distance of 1907 pc and AV = 3.5 mag; (f) Red contours trace the HII emission of G321.9–0.3 SNR (Ball et al. 2025); contour levels are 2 (~3σrms), 5, 10, 15, 20, 25, 30, 35 and 40 mJy beam−1. |
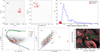 |
Fig. C.2 Multiparametric analysis of the open cluster ESFERA 3. Symbols as in Fig 5 and yellow square for Class II YSO. In Fig (d) the MS is fitted to a distance of 1939 pc and AV = 2.5 mag; (f) Red contours trace the same levels of Fig. C.1 f). |
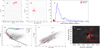 |
Fig. C.3 Multiparametric analysis of the open cluster ESFERA 4. Symbols as in Fig. 5. In Fig (d) the MS is fitted to a distance of 1648 pc and AV = 2.5 mag; (f) Red contours trace the H II emission of G 322.153+00.613 (Anderson et al. 2014), contour levels are: -60, -40, -20 and -10 mJy beam−1 for the negative emission and 5 (~3 σrms), 10, 30, 50, 70, 100, 150, 200, 250 and 300 mJy beam−1 for the positive emission. |
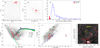 |
Fig. C.4 Multiparametric analysis of the open cluster ESFERA 5. Symbols as in Fig 5. In Fig (d) the MS is fitted to a distance of 2417 pc and AV = 3.4 mag; (f) Red contours indicate the H II emission of G324.147+00.231 (Anderson et al. 2014). Contour levels are 2 (~5σrms), 5, 10, 30, 50, 100, 150, 200, 250 and 300 mJy beam−1. |
All Tables
Open clusters ESFERA we discovered in the Galactic region 320° ≤ l ≤ 325°, −1° ≤ b ≤ + 1°.
All Figures
|
Fig. 1 Spatial distribution in heliocentric Galactic coordinates (XHC, YHC) of known open clusters (gray points) from the UCC catalog (Perren et al. 2023). The plot covers the region 290° < l < 350° and −1° < b < 1°, corresponding to a prominent section of the Carina-Sagittarius Arm. The colored curved lines represent the Hou & Han (2014) spiral structure of the MW. The thick black circle highlights the specific region we investigated, centered at l = 322°, which is characterized by a noticeable lack of known clusters and limited prior deep exploration. |
| In the text | |
|
Fig. 2 Number of open clusters per 5° interval in Galactic longitude. This distribution highlights the density variations within the section of the Carina-Sagittarius Arm. |
| In the text | |
|
Fig. 3 Spatial distribution of the ESFERA open cluster members with their proper motions in Galactic coordinates. The different symbols represent HII region [R2003] 387(Murray & Rahman 2010) (black open square), G 321.9–0.3 SNR (Ball et al. 2025) (open red square), and HII regions G 322.153+00.613 (Anderson et al. 2014) and G 324.147+00.231 (Anderson et al. 2014) (black diamonds). The proper motion components in Galactic coordinates were calculated with the formulae by Poleski (2013). The background is intentionally kept clear to maximize the contrast and visibility of the proper motion vectors. |
| In the text | |
|
Fig. 4 Spatial distribution of ESFERA 1 (red), ESFERA 2 (blue), ESFERA 3 (green), ESFERA 4 (gray), and ESFERA 5 (magenta) and local open clusters known in the literature (black) detected in this study. |
| In the text | |
|
Fig. 5 Multiparametric analysis of the open cluster ESFERA 1. (a) Spatial distribution in Galactic coordinates and (b) VPD of the candidate members (filled red circles) compared to the field population (light gray dots). (c) Histogram of the ninth-nearest neighbor distances for ESFERA 1 members (red) and a control subset of 500 local field stars (blue). (d) Optical CMD. The brown curve represents the MS fitted to a distance of 2452 pc and AV = 4 mag. The black curve denotes the best-fit PARSEC v1.2S isochrone, and the blue and green curves represent the ~ 15% age uncertainties. (e) NIR CMD, where the black and brown curves indicate the MS shifted according to the adopted distance, with and without interstellar reddening, respectively. (f) Spatial projection of candidate members onto the SUMSS 843 MHz radio image. The red contours trace the HII emission of [R2003] 387 (Murray & Rahman 2010), and the contour levels are 5 (~5σrms), 10, 50, 100, 150, 200, 250, and 300 mJybeam−1. |
| In the text | |
|
Fig. 6 AllWISE color-composite image of the ESFERA 3 region ( |
| In the text | |
|
Fig. C.1 Multiparametric analysis of the open cluster ESFERA 2. Symbols as in Fig 5. In Fig (d) the MS is fitted to a distance of 1907 pc and AV = 3.5 mag; (f) Red contours trace the HII emission of G321.9–0.3 SNR (Ball et al. 2025); contour levels are 2 (~3σrms), 5, 10, 15, 20, 25, 30, 35 and 40 mJy beam−1. |
| In the text | |
|
Fig. C.2 Multiparametric analysis of the open cluster ESFERA 3. Symbols as in Fig 5 and yellow square for Class II YSO. In Fig (d) the MS is fitted to a distance of 1939 pc and AV = 2.5 mag; (f) Red contours trace the same levels of Fig. C.1 f). |
| In the text | |
|
Fig. C.3 Multiparametric analysis of the open cluster ESFERA 4. Symbols as in Fig. 5. In Fig (d) the MS is fitted to a distance of 1648 pc and AV = 2.5 mag; (f) Red contours trace the H II emission of G 322.153+00.613 (Anderson et al. 2014), contour levels are: -60, -40, -20 and -10 mJy beam−1 for the negative emission and 5 (~3 σrms), 10, 30, 50, 70, 100, 150, 200, 250 and 300 mJy beam−1 for the positive emission. |
| In the text | |
|
Fig. C.4 Multiparametric analysis of the open cluster ESFERA 5. Symbols as in Fig 5. In Fig (d) the MS is fitted to a distance of 2417 pc and AV = 3.4 mag; (f) Red contours indicate the H II emission of G324.147+00.231 (Anderson et al. 2014). Contour levels are 2 (~5σrms), 5, 10, 30, 50, 100, 150, 200, 250 and 300 mJy beam−1. |
| In the text | |
Current usage metrics show cumulative count of Article Views (full-text article views including HTML views, PDF and ePub downloads, according to the available data) and Abstracts Views on Vision4Press platform.
Data correspond to usage on the plateform after 2015. The current usage metrics is available 48-96 hours after online publication and is updated daily on week days.
Initial download of the metrics may take a while.