


Fig. 5
Download original image
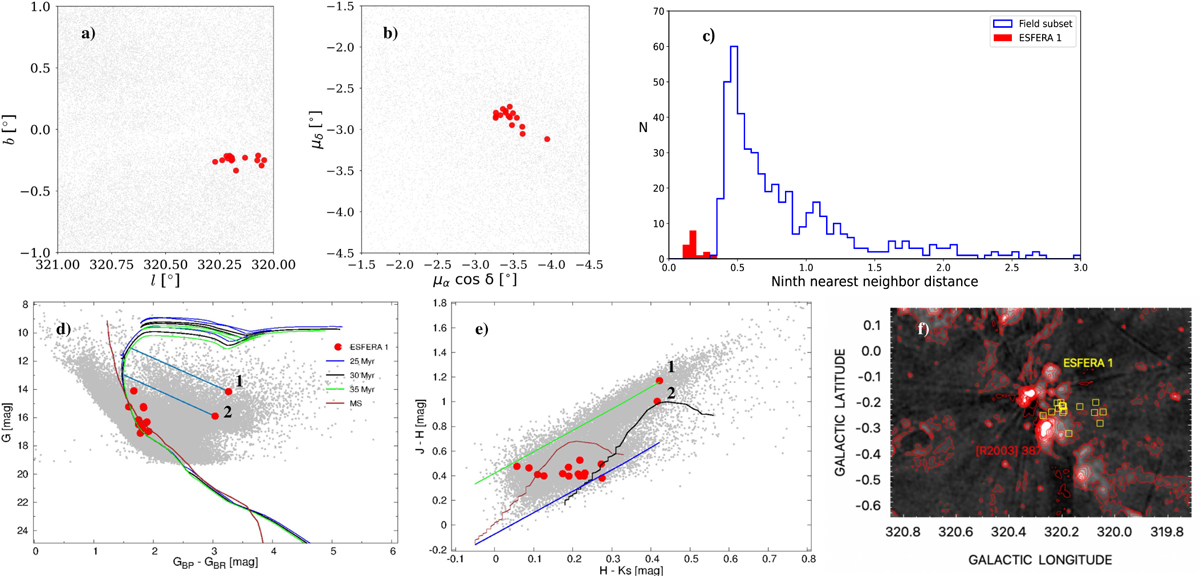
Multiparametric analysis of the open cluster ESFERA 1. (a) Spatial distribution in Galactic coordinates and (b) VPD of the candidate members (filled red circles) compared to the field population (light gray dots). (c) Histogram of the ninth-nearest neighbor distances for ESFERA 1 members (red) and a control subset of 500 local field stars (blue). (d) Optical CMD. The brown curve represents the MS fitted to a distance of 2452 pc and AV = 4 mag. The black curve denotes the best-fit PARSEC v1.2S isochrone, and the blue and green curves represent the ~ 15% age uncertainties. (e) NIR CMD, where the black and brown curves indicate the MS shifted according to the adopted distance, with and without interstellar reddening, respectively. (f) Spatial projection of candidate members onto the SUMSS 843 MHz radio image. The red contours trace the HII emission of [R2003] 387 (Murray & Rahman 2010), and the contour levels are 5 (~5σrms), 10, 50, 100, 150, 200, 250, and 300 mJybeam−1.
Current usage metrics show cumulative count of Article Views (full-text article views including HTML views, PDF and ePub downloads, according to the available data) and Abstracts Views on Vision4Press platform.
Data correspond to usage on the plateform after 2015. The current usage metrics is available 48-96 hours after online publication and is updated daily on week days.
Initial download of the metrics may take a while.