


| Issue |
A&A
Volume 711, July 2026
|
|
|---|---|---|
| Article Number | A63 | |
| Number of page(s) | 30 | |
| Section | Stellar atmospheres | |
| DOI | https://doi.org/10.1051/0004-6361/202659774 | |
| Published online | 07 July 2026 | |
Evidence for neutron capture in heavy-metal hot subdwarfs
Far-UV spectroscopy of EC22536–5304 and LS IV–14°116
1
Institut für Physik und Astronomie, Universität Potsdam,
Haus 28, Karl-Liebknecht-Str. 24/25,
14476
Potsdam,
Germany
2
Armagh Observatory and Planetarium, College Hill,
Armagh
BT61 9DG,
UK
3
Atomic Physics and Astrophysics, Université de Mons (UMONS),
Mons,
Belgium
4
Astronomy and Astrophysics Institute, Université Libre de Bruxelles (ULB),
Brussels,
Belgium
5
Astrophysics Research Centre, Queen’s University Belfast,
Belfast BT7 1NN,
Northern Ireland,
UK
6
Instituto de Astrofísica de La Plata, CONICET, Avenida Centenario (Paseo del Bosque) S/N,
B1900FWA
La Plata,
Argentina
7
Dr. Remeis-Sternwarte & ECAP, Friedrich-Alexander University Erlangen-Nürnberg,
Sternwartstr. 7,
96049
Bamberg,
Germany
8
School of Mathematics, Statistics and Physics, Newcastle University, Newcastle upon Tyne
NE1 7RU,
UK
★ Corresponding author: This email address is being protected from spambots. You need JavaScript enabled to view it.
Received:
9
March
2026
Accepted:
20
May
2026
Abstract
Context. Most hot subdwarfs (sdO/B) are low-mass core-helium-burning stars formed through binary interaction. A subgroup of intermediate He-rich sdOBs shows extreme heavy metal (Z > 30) enrichments exceeding 104 times solar, particularly in Zr or Pb.
Aims. We analysed the first ultraviolet spectra of the heavy-metal subdwarfs LS IV–14°116 (Zr-rich) and EC 22536–5304 (Pb-rich) to determine their abundance patterns and test nucleosynthesis models. The targets probe contrasting evolutionary channels: the close binary EC 22536–5304 with an sdF companion and the apparently single LS IV–14°116, likely formed by a white dwarf merger.
Methods. Both stars show exceptionally rich heavy-element spectra dominated by ions in stages III–VI, many transitions being absent from standard line lists. We compiled literature energy levels, wavelengths, and oscillator strengths and implemented them in the spectral synthesis code SYNSPEC. As data were unavailable, we computed the oscillator strengths for As III, Se III, Hf IV, and Tl IV. New photoionisation cross-sections for Pb III–VI enabled the first non-local thermal equilibrium (non-LTE) models of multiply ionised Pb.
Results. In LS IV–14°116 we detected 16 light and 24 heavy metals (Ga–Bi); Br, Nb, Mo, Pd, In, Sb, Te, and Xe have been measured in an sdO/B star for the first time. EC 22536–5304 is even more enriched; we detected 13 light and 26 heavy metals, including first detections of La, Ce, Pr, Nd, Er, Yb, Lu, Hf, Ta, W, Os, Pt, Hg, Tl, and Bi, mainly in stages IV-V. LS IV–14°116 peaks at ~4.3 dex for Sr-Sn, declining to 3.1 dex at Pb and 2.3 dex at Bi, whereas EC 22536–5304 shows 1–3 dex enhancements from Ga-Sn, rising to ~4 dex for La–Tl and reaching 6.2 dex for Pb and 5.4 dex for Bi. Both stars are Fe-poor (−0.8 and −2.5 dex).
Conclusions. The photospheres of both stars are strongly enriched in heavy elements relative to their initial compositions. The abundance patterns cannot be explained by atomic diffusion alone and retain a clear signature of nucleosynthesis. The distribution in EC 22536–5304 closely matches predictions of i-process nucleosynthesis during its formation, providing strong evidence for i-process self-enrichment in hot subdwarfs. The contrasting abundance patterns imply different evolutionary histories and i-process conditions: EC 22536–5304 likely formed via Roche-lobe overflow onto its sdF-type companion, whereas the single star LS IV–14°116 most likely originated from the merger of two low-mass white dwarfs. These results suggest that heavy metals in other He-rich sdOB and sdO stars are also self-synthesised and that i-process nucleosynthesis may be widespread among He-rich hot subdwarfs.
Key words: atomic data / line: identification / stars: abundances / stars: atmospheres / stars: formation / stars: horizontal-branch
© The Authors 2026
 Open Access article, published by EDP Sciences, under the terms of the Creative Commons Attribution License (https://creativecommons.org/licenses/by/4.0), which permits unrestricted use, distribution, and reproduction in any medium, provided the original work is properly cited.
This article is published in open access under the Subscribe to Open model. This email address is being protected from spambots. You need JavaScript enabled to view it. to support open access publication.
1 Introduction
Most subdwarf B (sdB) stars and subdwarf O (sdO) stars have masses close to 0.5 M⊙ and are found on the extended horizontal branch (EHB) or near the helium main sequence (HeMS; see reviews by Heber 2009, 2016, 2024). The absence of extended hydrogen-rich envelopes in these stars inhibits their evolution towards the asymptotic giant branch (AGB) and is widely attributed to stripping via binary interaction. Observationally, between 50 and 70% of sdB stars are found in binary systems (Maxted et al. 2001; Stark & Wade 2003), implying the existence of multiple post-red giant branch (RGB) evolutionary channels (Han et al. 2002): (i) common-envelope ejection in a red giant–white dwarf system, (ii) common-envelope ejection in a red giant–M-dwarf system, (iii) stable mass transfer from a red giant to an F-, G-, or K-type companion, and (iv) the merger of two helium white dwarfs (He-WDs).
The majority of hot subdwarfs (90%) exhibit helium-poor surface compositions (Dawson et al. 2024). If sdB stars originate from stripped red giant cores, any residual envelope is expected to be helium-enriched through first dredge-up or flash-driven convection at helium ignition (Miller Bertolami et al. 2008). The commonly invoked explanation for the observed helium depletion is that, after contraction onto the HeMS/EHB at Teff ≲ 40 000 K, gravitational settling becomes efficient enough to rapidly transform an initially helium-rich surface into a heliumpoor one (Michaud et al. 2011; Hu et al. 2011). The abundances of light metals (C, N, O, Ne) should also affected by past helium fusion and the hydrogen CNO-cycle (Battich et al. 2018), as well as atomic diffusion (Byrne et al. 2018).
A minority of hot subdwarfs (≈10%) show extremely helium-rich surfaces (80–100% helium by number). These extreme He-sdOs lie at higher temperatures (Stroeer et al. 2007) and they have been identified with the products of double He-WD mergers (Saio & Jeffery 2000; Zhang & Jeffery 2012; Yu et al. 2021), and show surface CNO abundances affected by both hydrogen and helium fusion. A similar number of hot subdwarfs are intermediate in helium (iHe-sdOBs) with surfaces having 10–80% helium (Dawson et al. 2026). These may either be in a process of transition from red giant core to the EHB (Miller Bertolami et al. 2008) or simply have insufficient hydrogen to quench the helium as the product of some other history, such as He-WD mergers.
At least 12 iHe-sdOBs have extraordinary surface compositions, showing zirconium, lead and other heavy elements overabundant by factors of 10 000 or more when compared to the Sun, thus earning the nickname heavy-metal stars. These heavy-metal stars appear to fall into two major groups; the warmer ones are extremely lead-rich (e.g. Naslim et al. 2013, 2020; Jeffery et al. 2017; Németh et al. 2021) whilst the coolest are zirconiumrich (Naslim et al. 2011; Latour et al. 2019; Østensen et al. 2020). The latter are best represented by the zirconium star LS IV–14°116, with optical lines due to Ge, Ga, Se, Kr, Y, Sr, Zr, and Sn that indicate overabundances between 103 and 105 times solar for these elements (Naslim et al. 2011; Dorsch et al. 2020).
The lead-rich EC 22536–5304 (Jeffery & Miszalski 2019) is of particular interest because it is the first iHe-sdOB for which the primordial metallicity can be inferred via its F-type companion ([Fe/H] = −2, Dorsch et al. 2021). This low metallicity indicates that it is part of the Galactic halo, as is LS IV–14°116 (Randall et al. 2015). EC 22536–5304 is the first heavy-metal iHe-sdOB found in a binary, and the most lead-rich one. Given its 457 d orbital period (Dorsch et al. 2021), it is very likely that the system formed through stable Roche lobe overflow from a red giant progenitor to the sdF-type companion. This presents a unique opportunity to compare observed abundances with well-constrained evolutionary models.
A first set of detailed nuclear synthesis calculations for post-RLOF systems was performed by Battich et al. (2023). This exploratory analysis showed that neutron capture processes can take place during the late helium flashes in the cores of such hot subdwarf progenitors. Neutron production is initiated by proton ingestion into the He-burning layer. Protons are captured by 12C via 12C(p, γ)13N, which beta-decays to 13C. The resulting 13C acts as a neutron source through 13C(α, n)16O. The neutron densities predicted by Battich et al. (2023) are in the range of i-process nucleosynthesis, allowing the production of heavy elements up to bismuth (see Wiedeking et al. 2025, for a review). These models demonstrated for the first time that not only diffusion, but also self-synthesis of heavy elements can contribute to the extreme enrichments observed in heavy-metal subdwarfs.
Encouraged by these results, we have conducted a detailed analysis of high-quality Hubble Space Telescope (HST) observations of EC 22536–5304, the most lead-rich star known, as well as LS IV–14°116, the prototype zirconium star. In parallel, Battich et al. (2025) carried out comprehensive nucleosynthesis simulations specifically for EC 22536–5304, and compared their predictions to a preliminary version of the metal abundances measured as part of this work.
2 Observations
HST/STIS E140M observations of both stars were obtained in Cycle 30 under programme ID 17072 (Dorsch et al. 2022). The spectra cover 1143–1730 Å at a resolving power of R = 45 800 and a median signal-to-noise ratio of about 20. The programme also included an E 140 H spectrum of the heavy-metal iHe-sdO HD 127493 (Dorsch et al. 2019), spanning 1163.3–1356.9 Å at even higher resolution (R = 114 000) and reaching signal-to-noise ratio of 85 at 1300 Å. It was used to refine line wavelengths and resolve blended features, aiding the interpretation of the EC 22536–5304 and LS IV–14°116 spectra.
Both LS IV–14°116 and EC 22536–5304 have been extensively observed in the optical and near-ultraviolet (near-UV) ranges as well. While the focus of the present analysis is on the HST spectra, we used high-resolution UVES spectra (R ≈ 40 000) of both stars to constrain metals that show spectral lines only in the optical or both ranges. These spectra are the same as used by Dorsch et al. (2020) for LS IV–14°116 (S/N = 200) and Dorsch et al. (2021) for EC 22536–5304 (S/N = 50).
3 Atomic data
The far-UV spectra of both stars contain numerous lines from multiply ionised heavy metals. Because standard line lists omit many of these ions and are incomplete for others, we compiled line positions and oscillator strengths from various sources and significantly expanded the line list used by Dorsch et al. (2019) in their analysis of the heavy-metal sdOBs HZ 44 and HD 127493. This compilation began with R.L. Kurucz’s line list1 (Kurucz 2018) and was expanded using data from the NIST database2 (Kramida et al. 2024), the Atomic Line List v3.00b53 (van Hoof 2018), the DREAM database4 (Quinet & Palmeri 2020), the TOSS database (Rauch et al. 2015), and additional individual papers. More details are given for each heavy metal in Sect. 4. While we have aimed to compile the best data available for each ion in stages III-V, and to be as complete as possible in the Z = 31 to 83 range, some sources may have been missed given the large number of heavy ions present in both stars.
3.1 New atomic data for As III, Se III, Hf IV and TI IV
Oscillator strengths were not available for many transitions originating from heavy ions detected in the spectra of LS IV–14°116 and EC 22536–5304. As further discussed in Sect. 4, this includes As III, Se III, Hf IV and Tl IV lines. For these ions, new sets of oscillator strengths and line positions were computed at the University of Mons. To do so, we used the pseudo-relativistic Hartree–Fock (HFR) method (Cowan 1981) that was modified to take core-polarisation (CPOL) effects into account through the introduction of a polarisation potential (HFR+CPOL, see Quinet et al. 1999; Quinet et al. 2002). For each ion, radial parameters were refined via a semi-empirical least-squares fit to available experimental energy levels.
In this paper, we provide the HFR atomic data for the lines of interest in As III, Se III, Hf IV and Tl IV for the observed spectra, only summarising the important details of our atomic computations. More details about our calculations and fits, in addition to atomic data for other lines in these ions, as well as a detailed discussion and comparison with the results obtained with an independent method (fully relativistic multiconfiguration Dirac–Hartree–Fock) will be presented in a future paper (Deprince et al., in prep.).
The HFR multiconfiguration models considered for these four ions are given in Table A.1, accompanied by the CPOL parameters used for each ion, namely the core dipole polarisability, αd, and the cut-off radius of the ionic core, rc. The models were built by considering all configurations for which some energy levels are experimentally known, in addition to configuration interactions motivated based on previous works concerning similar ions (e.g., same isoelectronic sequence). The list of the As III, Se III, Hf IV and Tl IV transitions computed with HFR and observed in this work (see Sect. 4) is given in Table 1 with the calculated oscillator strengths and observed wavelengths.
3.2 Atomic data for Pb III-VI
Energy levels, line positions, and oscillator strengths are sufficient to calculate line strengths under the local thermal equilibrium (LTE) approximation. However, heavy-metal hot subdwarfs can reach temperatures of up to 40 000 K, where non-LTE effects are significant. Determining level populations under non-LTE conditions requires solving the statistical equilibrium equations, which in turn depend on detailed opacity data, particularly photoionisation cross-sections.
As lead is by far the most abundant heavy metal in the atmosphere of EC 22536–5304, photoionisation cross-sections were computed for Pb III-VI, as presented by Dougan et al. (2025). In brief, level structures were calculated using the General Relativistic Atomic Structure Package (GRASP0; Dyall et al. 1989), and the photoionisation cross-sections were obtained with the R-matrix method (see Burke 2011, for a review). The cross-sections were smoothed following Bautista et al. (1998) for the use with TLUSTY. These data enabled us to construct the first non-LTE models for lead in heavy-metal subdwarfs.
4 Metal abundance analysis
Our models of LS IV–14°116 and EC 22536–5304 were computed using TLUSTY 205 non-LTE atmospheres and SYNSPEC 51 synthetic spectra (for a detailed description, see Hubeny & Lanz 2017). SYNSPEC was updated to treat ionised heavy metals in LTE using partition functions, following Dorsch et al. (2019) and Chayer et al. (2006); the updated version is available online5. In the present analysis, Pb is the only heavy metal treated in full non-LTE. We used the same Pb and lighter-metal model atoms for both stars, as listed in Table A.2.
The previous abundance studies of EC 22536–5304 were limited to optical spectroscopy. Since the surface gravity and helium abundance were already well determined from the optical spectrum, we kept the values of Dorsch et al. (2021). Like its sdF-type companion, EC 22536–5304 has a low iron abundance, as discussed in more detail in Sect. 4.2. We then performed a simultaneous χ2 fit to the optical UVES and far-UV HST spectra for Teff and all metal abundances, including heavy metals, as well as the microturbulence. The sdF spectrum was modelled as in Dorsch et al. (2021) using a grid of ATLAS12/SYNTHE models (Kurucz 1993, 1996); it does not affect the UV spectrum.
For the hot subdwarf component, synthetic spectra were computed for each metal separately using SYNSPEC, based on a single TLUSTY model atmosphere for each Teff, log g combination. Each spectrum was divided by a pure H+He spectrum from the same atmosphere, yielding normalised absorption profiles for the individual metals. The full synthetic spectrum was obtained by multiplying these metal profiles, interpolated to the desired abundances, with the H+He spectrum. This procedure is equivalent to adding metal opacities in the limit of weak lines, and remains a good approximation provided that saturated lines from different metals do not overlap significantly. The method has been successfully applied to sdB and B-type stars in previous studies (e.g. Irrgang et al. 2014; Dorsch et al. 2021; Schaffenroth et al. 2021). Based on these fits, we adopt Teff = 37750 ± 500 K, log g = 5.80 ± 0.10, log n(He)/n(H) = −0.08 ± 0.05, and a microturbulence of ξ = 0.7 ± 0.5 km s−1 for EC 22536–5304.
We applied the same method for LS IV–14°116, this time starting from the model of Dorsch et al. (2020). The new STIS-E140M spectrum and the co-added UVES spectrum from Dorsch et al. (2020) were fit simultaneously. Free parameters were Teff, 52 metal abundances, and the microturbulence. To limit computation time, the helium abundance was kept fixed to the value used by Dorsch et al. (2020) (log n(He)/n(H) = −0.6). Multi-mode pulsations with periods comparable to the HST exposure time broaden the spectral lines of LS IV–14°116 through phase averaging. The dominant mode spans about 11 km s−1 in radial velocity (Jeffery et al. 2015), which we model as a macroturbulent broadening of ζ = 11 km s−1. The UV spectrum of LS IV–14°116 is more crowded than that of EC 22536–5304 due to its higher iron-group abundances, which can be an issue with the multiplication method. Saturated intrinsic blends, spectral lines absent from the model, and lines known to be poorly reproduced were carefully removed before the final fit. Based on these fits, we adopt Teff = 35230 ± 500 K, log g = 5.80 ± 0.10, log n(He)/n(H) = −0.6 ± 0.05, and a microturbulence of ξ = 0.8 ± 1.0 km s−1 for LS IV–14°116.
The best-fit abundances of LS IV–14°116 and EC 22536–5304 are summarised in Table A.3, while Table A.4 provides an overview of the detected heavy ions and the availability of atomic data. The final abundances for both LS IV–14°116 and EC 22536–5304 are based on a final visual inspection of a fully self-consistent TLUSTY/SYNSPEC model, constructed without the multiplication method, which led to minor modifications to Table A.3. The quoted uncertainties reflect our assessment of the robustness of each abundance measurement, based on the number of available lines, the degree of blending, and the overall fit quality. While formal statistical uncertainties are considered, these represent only a minor component of the total error budget. The following paragraphs describe the abundance determination and atomic data used for each metal in more detail, focusing on trans-iron elements. Metals not mentioned for a given star had no detectable spectral lines.
List of the lines computed by HFR and observed here.
4.1 Light metals
The abundances of most light metals up to sulphur – specifically C, N, O, Mg, and Si for EC 22536–5304, and additionally Ne and Ar for LS IV–14°116 – are well constrained from optical and near-UV spectra. Since their spectral lines in the HST data are consistent with those in the optical range, our best-fit abundances closely match the results of Dorsch et al. (2020, 2021).
Several light metals cannot be measured from the optical spectra alone. Neon in LS IV–14°116 is well constrained by multiple Ne II lines in the near-UV, whereas in EC 22536–5304 only an upper limit can be derived from Ne II 4409.3 Å owing to the lack of near-UV data. Aluminium is clearly detected in EC 22536–5304 through the strong, isolated Al III lines at 1384.13, 1605.77, and 1611.87 Å. The non-detection of Al III 1611.87 Å in LS IV–14°116 suggests a subsolar abundance, but we refrain from stating an upper limit based on a single line. The optical phosphorus abundance in EC 22536–5304 was based on two weak lines, whereas the stronger STIS P III-IV transitions (e.g. P III 1334.813, 1344.317 Å and P IV 1377.275, 1467.427, 1484.509, 1487.789, 1489.087 Å) yield a more reliable and slightly higher abundance. In LS IV–14°116, only the P III lines are detectable. The strongest sulphur lines in EC 22536–5304 are S III 1194.06, 1201.73 Å, S IV 1286.07, 1623.962, 1629.17 Å, and S V 1501.76 Å. In LS IV–14°116, the S III and S V lines are present but blended with stronger lines, and we only state an upper limit. Argon is not detected in EC 22536–5304; in LS IV–14°116 it is detected only in the near-UV, yielding the same abundance as found by Dorsch et al. (2020). Calcium is not detected in either star, nor are F, Na, Cl, or K.
4.2 Iron-peak elements
EC 22536–5304 has an extremely low iron abundance of approximately −2.8 dex relative to the solar value by number, substantially lower than that of its sdF-type companion (−1.95 dex; Dorsch et al. 2021). Consequently, iron lines are very weak in EC 22536–5304, with only a few Fe IV transitions detected at 1568.28, 1609.10, 1616.68, 1631.08, and 1724.06 Å. The strongest isolated nickel lines are Ni IV lines at 1398.19, 1411.45, 1421.22, 1430.19, 1520.62, 1525.31, and 1534.71 Å. Although LS IV–14°116 also has a subsolar iron abundance (−0.8 dex), its spectrum exhibits many strong iron and nickel lines.
Titanium IV lines at 1451.74 and 1467.34 Å are clearly detected in both stars; LS IV–14°116 also shows Ti III 1286.37, 1293.23, 1294.7, 1455.20 Å, and Ti IV 1183.63, 1195.20 Å. Ti III are systematically stronger than both UV and optical Ti IV lines; we rely on Ti IV for consistency between the two stars.
No scandium and vanadium lines are detected in either star. The strongest predicted V IV transitions, at 1355.13 and 1403.61 Å, are absent, and V IV 1426.65 Å is blended with C III 1426.74 Å. In LS IV–14°116, the upper limit is based on V IV 1321.92 Å.
Chromium lines are weak but clearly present in EC 22536–5304; the abundance is based on Cr IV 1306.05, 1319.70, 1325.03, 1339.19, 1355.33, 1361.63 Å. In LS IV–14°116, about 15 Cr IV lines are detected; the most isolated is Cr IV 1332.44 Å.
Manganese is not detected in EC 22536–5304, with a subsolar upper limit constrained by the non-detection of Mn IV 1664.76 and 1666.99 Å. Mn IV 1257.30, 1664.72, 1664.76, 1666.99 Å are detected in LS IV–14°116, next to weaker lines.
Cobalt III-IV lines are strong in LS IV–14°116, but not clearly detected in EC 22536–5304. The strongest predicted line, Co IV 1521.64 Å, coincides with a weak unidentified feature.
No copper lines are detected in EC 22536–5304, limited by wavelength accuracy, although this remains consistent with their expected weakness. The strongest predicted transitions, Cu V 1159.76 Å and Cu III 1593.75, 1642.20, and 1722.37 Å are detected in LS IV–14°116 but not clearly in EC 22536–5304.
In contrast, zinc lines are strong in EC 22536–5304 and very strong in LS IV–14°116, allowing precise abundance determinations. Small wavelength corrections were applied to several Zn III-IV lines based on the LS IV–14°116 spectrum.
4.3 Lighter trans-iron metals
Comparatively light trans-iron elements up to the lanthanides (Z = 57) are more abundant in LS IV–14°116 than in EC 22536–5304. In the following paragraphs, the detection of each metal is thus discussed mainly for the example of LS IV–14°116 and the strongest lines are shown in Figures 1 to 5.
Gallium. The gallium and germanium abundances in LS IV–14°116 have already been estimated from optical spectra (Dorsch et al. 2020). Both ions are were also detected in UV spectra of HZ 44 and HD 127493 by Dorsch et al. (2019).
For gallium, the UV features are consistent with the optical determinations. The resonance lines at 1495.045 and 1534.462 Å are the strongest Ga III features in LS IV–14°116. We adopt fine-structure oscillator strengths from Nielsen et al. (2005) and include hyperfine structure (HFS) using magnetic dipole constants from Dutta et al. (2013), derived with the relativistic coupled-cluster method (see also Appendix A.2). Although the hyperfine components are not resolved, including HFS is important as it significantly increases the equivalent widths of both lines.
Strong Ga IV lines are present at 1258.80, 1295.88, 1303.54, and 1338.13 Å, for which we use the atomic data of Rauch et al. (2015). Both the Ga III resonance lines and the Ga IV transitions are detected in EC 22536–5304 as well. No Ga V features are identified in either star; the strongest predicted line at 1150.22 Å is blended with unidentified absorption.
Germanium. For Ge IV we use data from Dutta & Majumder (2011), supplemented with data from strengths from the ALL database. The Ge IV resonance doublet at 1189.017 and 1229.838 Å is very strong in LS IV–14°116 (Fig. 1) and remains clearly detectable in EC 22536–5304. In addition to these, the strongest Ge IV lines occur at 1494.83 and 1500.55 Å. In LS IV–14°116, the resonance lines are so strong that their profiles are strongly affected by Stark broadening, which we model using the Stark widths predicted by Elabidi et al. (2023). Experimental wavelengths from Ryabtsev et al. (1993), together with preliminary Ge III oscillator strengths (Claudio Mendoza, priv. comm.), enabled the identification of Ge III lines at 1150.67, 1159.18, 1159.71, 1160.90, 1173.91, and 1183.49 Å, as well as the 1600 Å intercombination transition, the latter detected only in LS IV–14°116. Using the data of Rauch et al. (2012), we also identify the weak Ge V line at 1163.39 Å in LS IV–14°116, while Ge V 1165.26 Å is blended.
The optical 3d105s − 3d105p doublet Ge IV 3554.257, 3676.735 Å is significantly too weak in our model at the best-fit abundances obtained from UV Ge III-V lines. It is unclear whether this discrepancy arises from non-LTE effects or other modelling limitations.
Arsenic. The strongest As III features in LS IV–14°116 occur at 1172.13, 1196.94, and 1209.28 Å, with wavelengths from Churilov & Joshi (1996). Among these, only As III 1172.15 Å is unblended; 1196.94 Å is blended with Te IV 1196.90 Å, and 1209.28, 1213.99 Å lie within the wings of the interstellar Ly α line (Fig. 2). The optical As III 3922.47, 4037.04 Å were previously identified in LS IV–14°116 by Dorsch et al. (2020). Because no oscillator strengths were available for these transitions, we computed new As III f-values (Sect. 3.1), enabling a consistent treatment of both the UV and optical lines, all of which are well reproduced by our model.
The strong and isolated As IV 1299.262 Å intercombination line is clearly detected in LS IV–14°116, with an oscillator strength measured by Curtis (1992). The As IV 1480.37 Å line is also detected; its wavelength was measured by Churilov & Joshi (1996), and its lifetime by Pinnington et al. (1981). Other lines in LS IV–14°116 coincide with As IV positions measured by Churilov & Joshi (1996), e.g. at 1347.48, 1351.32, 1353.92, 1355.05, and 1472.47 Å (see Fig. A.2). However, oscillator strengths for these transitions are not available. All optical As IV lines of Churilov & Joshi (1996) are too weak to be detected in the UVES spectrum of LS IV–14°116. None of the As V lines measured by Joshi & Kleef (1986) are detectable in the HST spectrum of LS IV–14°116.
In EC 22536–5304, the strongest arsenic lines, As IV 1299.26, 1480.37 Å, are blended with the much stronger Ce V 1299.30 Å and C III 1478.33 Å, respectively, preventing an abundance measurement.
Selenium. Se III, Se IV, and Se v show strong lines in LS IV–14°116 (Fig. 1). Several strong Se III lines were already identified in the UVES spectrum of LS IV–14°116 by Dorsch et al. (2020), but no oscillator strengths were available at the time. New Se III atomic data, computed as summarised in Sect. 3.1, now enable us to model 17 Se III transitions in the UVES spectrum. The energy levels were optimised using the experimental measurements of Tauheed & Hala (2012), although small wavelength adjustments were still required. Updated wavelengths are provided in Table 1, and the strongest Se III lines in the UVES spectrum are shown in Fig. A.1. Only Se III 1245.988 Å (![Mathematical equation: $\[4 \mathrm{s}^{2} ~4 \mathrm{p}^{2}~{ }^{1} \mathrm{D}_{2}^{\mathrm{o}}-4 \mathrm{s} ~4 \mathrm{p}^{3}~{ }^{2} \mathrm{D}_{3}\]$](/articles/aa/full_html/2026/07/aa59774-26/aa59774-26-eq20.png) ) is securely identified in the UV range, and the selenium abundance in LS IV–14°116 is primarily derived from the UVES spectrum. In addition, the theoretical study of Kitoviené et al. (2024) predicts strong Se III lines in the UV, involving upper 4s2 4p 4f 1F3, 3F3, and 1G3 levels, whose energies remain poorly constrained owing to the lack of experimental data; these lines are likely present in LS IV–14°116.
) is securely identified in the UV range, and the selenium abundance in LS IV–14°116 is primarily derived from the UVES spectrum. In addition, the theoretical study of Kitoviené et al. (2024) predicts strong Se III lines in the UV, involving upper 4s2 4p 4f 1F3, 3F3, and 1G3 levels, whose energies remain poorly constrained owing to the lack of experimental data; these lines are likely present in LS IV–14°116.
Based on the energy levels from Kelly (1987), as provided by NIST, several strong Se IV lines are also identified in LS IV–14°116, listed in Table A.5 (see Fig. A.2). Several of these transitions were originally identified experimentally by Rao et al. (1931) and Gautam & Joshi (1972). Oscillator strengths are available for only three of these lines from beam-foil lifetime measurements by Bahr et al. (1982). However, the derived line strengths are too strong compared to those of Se III and Se V.
Oscillator strengths for Se V were computed by Rauch et al. (2017b), who also identified four Se V lines in the spectrum of RE 0503–289. The strongest, at 1227.527 Å, is clearly isolated in EC 22536–5304 and consistent with Se IV 1307.24 Å. In LSIV–14°116, the Se V line is blended with at least two unidentified lines. Additional Se V lines are detected in LS IV–14°116 at 1150.986 and 1264.129 Å, with equivalent widths between 10 and 20 mÅ.
Bromine. Given the strong enrichment in neighbouring metals, we expect LS IV–14°116 to be enriched in bromine as well. Data for for Br IV-V were provided by Riyaz et al. (2014a,b). We identify Br IV lines at 1158.4, 1184.852, 1198.702, 1234.746, 1247.209, 1295.536 and 1360.200 Å, which is the first detection of Br IV in a star. The strongest line is Br IV 1295.536 Å at about 20 mÅ (see Fig. 2). These lines were used to determine the bromine abundance in LS IV–14°116, but no bromine lines are detectable in EC 22536–5304. Br V lines are weak even in LS IV–14°116. Br V 1155.650, 1234.236, 1244.633, 1371.306 Å improve the fit quality, but at equivalent widths of only about 10 mÅ they are blended with stronger lines. None of the Br III lines measured experimentally by Joshi et al. (1986) and Jabeen & Tauheed (2015) are detectable in LS IV–14°116.
Krypton. The krypton abundance in LS IV–14°116 was already determined by Dorsch et al. (2020) from Kr III lines in its UVES spectrum. Next to the optical lines, Kr III 1270.21 Å is also detected using data from Raineri et al. (1998). Krypton is one of the metals identified in white dwarfs by Rauch et al. (2016b), who also provide line positions and oscillator strengths for Kr IV-VII lines in the UV range. The HST spectrum of LS IV–14°116 shows 15 Kr IV lines at equivalent widths larger than 15 mÅ, the strongest being at 1558.514, 1596.409 Å (Fig. 1). The abundance originally derived from the optical/near-UV Kr III lines is consistent with the Kr IV lines in the HST spectrum. Several Kr V lines are also detected in LS IV–14°116 (e.g. at 1346.438 Å, but are typically weaker than 10 mÅ). The upper limit for krypton in EC 22536–5304 is based on the non-detection of Kr IV 1525.17, 1538.21 Å; Kr V 1589.269 Å is close to the detection threshold.
Rubidium. Although oscillator strengths for Rb IV are currently unavailable, accurate line positions have been measured by Persson & Wahlström (1985). Nearly all of the 20 strongest lines reported in that work correspond to otherwise unidentified features in the HST spectrum of LS IV–14°116, with Rb IV 1383.47, 1400.58, 1407.09 Å being the most prominent examples (see Fig. A.2). While the identification of individual lines remains uncertain, the large number of matches suggests a high rubidium enrichment, similar to that of neighbouring metals.
Extensive Rb V oscillator strengths were published by Radžiūtė & Gaigalas (2022), with experimental energies from Persson & Pettersson (1984) and O’Sullivan (1989), but the predicted STIS-range transitions are not covered by these measurements, and the theoretical energies are insufficiently accurate for reliable identification. The level structure of Rb III similarly produces no strong transitions in the STIS/E140M range, but several optical transitions are observable using data by Zhang et al. (2014). The Rb III 3492.677 Å line measured experimentally (Reader & Epstein 1972) coincides with a strong feature in the UVES spectrum of LS IV–14°116, and would be consistent with the weaker Rb III 3330.155, 3511.088, 3636.744 Å. Reliable Rb IV oscillator strengths remain essential to determine the rubidium abundance and should be calculated to enable such measurements.
Strontium. The strontium abundance of LS IV–14°116 was previously determined from optical Sr II-III lines (Naslim et al. 2011; Dorsch et al. 2020). Its UV spectrum shows about 150 Sr IV and 30 Sr III lines with equivalent widths of 15 to 22 mÅ (see Fig. 1), and many weaker features, similar to the HST/GHRS spectrum of its spectroscopic twin, Feige 46 (Latour et al. 2019). Two Sr V lines, at 1390.084 and 1396.308 Å, are identified with strengths near 10 mÅ; the remaining lines are blended with stronger features. For the present analysis, Sr IV-V atomic data were taken from Rauch et al. (2017b), while Sr III data were adopted from R. Kurucz’s database6. The Sr IV lines in the UV range are consistent with optical Sr III transitions; Sr II 4077.714, 4215.524 Å are expected to be affected by stronger non-LTE effects and appear too weak in our LTE models.
Strontium lines are considerably weaker in EC 22536–5304, yet several Sr IV transitions (1244.137, 1244.763, 1244.888, 1257.780, 1331.129, and 1361.159 Å, see Fig. A.4) are still detected, with equivalent widths of 4 to 8 mÅ. Sr IV 1408.678 Å is blended with Ni IV 1408.715 Å, while the strongest strontium line, Sr IV 1347.901 Å, is blended with C III 1347.947 Å.
Yttrium. The yttrium abundance in LS IV–14°116 was already determined by Naslim et al. (2011) and Dorsch et al. (2020) based on the optical Y III 4039.6, 4040.1 Å doublet. The strongest yttrium lines in the UV spectrum originate from Y IV, with about 20 lines with strengths between 10 and 20 mÅ, as predicted using atomic data from Loginov & Tuchkin (2001). The strongest lines Y IV lines, at 1205.796, 1222.645, 1257.523, 1258.433, 1275.112, 1275.248, 1306.369, 1307.974, 1326.344, 1345.859, 1373.461, and 1374.470 Å, are shown in Fig. 1. All Y III lines predicted in the UV range using data from Fernández-Menchero et al. (2020) are too weak to be detected. The Y IV lines observed in the UV range require a lower yttrium abundance than the Y III 4039.6, 4040.1 Å doublet; this may be caused by non-LTE effects or underestimated oscillator strengths for the Y III doublet. Experimental wavelengths and theoretical oscillator strengths for Y v were provided by Reader (2016). However, none of these lines are detected in either star.
In EC 22536–5304, Y IV 1222.645, 1258.433, 1275.112, 1275.248 Å are detected at strengths close to 5 mÅ (see Fig. A.4). Since these lines are also identified in LS IV–14°116, confirming their positions, they could be used to determine an abundance despite their weakness.
Zirconium. LS IV–14°116 was first identified as a heavy-metal star from its strong optical Zr IV lines (Naslim et al. 2011). Its UV spectrum exhibits 15 additional strong Zr IV lines with equivalent widths between 15 and 600 mÅ (Fig. 1).
Here we use atomic data from Rauch et al. (2017a), based on experimental wavelengths from Acquista & Reader (1980). The strongest line is Zr IV 1201.765 Å, followed by Zr IV 1219.862 Å (in the Lyα wing) and 1183.973 Å. Stark broadening is important for the 1201.765 Å line in LS IV–14°116; however, the calculations of Majlinger et al. (2017) and Elabidi (2021) do not include these transitions; we require a damping parameter of log ΓStark ≈ −6.2 to match the observation. Additional strong lines are seen at 1546.171 and 1598.948 Å. The optical Zr IV lines are consistent with these UV lines.
LS IV–14°116 further shows several Zr III lines, most notably at 1612.332 Å at a strength of 25 mÅ. Here we use data from R. Kurucz’s website, based on wavelengths from Reader & Acquista (1997). Zr III 1356.95 Å is blended with unidentified lines, while Zr III 1593.53, 1631.28, 1638.30, and 1703.26 Å are weak. The only clearly identified Zr V line using the Rauch et al. (2017a) data is at 1303.933 Å with a strength of 10 mÅ. It is slightly blended with the weaker Mo IV 1303.893 Å.
In EC 22536–5304, Zr IV 1201.769, 1219.862, 1469.472, 1598.948, and 1607.948 Å are strong and isolated at strengths between 15 and 30 mÅ (see Fig. A.4), allowing a reliable abundance determination. Zr IV 1183.973 Å is also strong, but seems to be blended with an unidentified line.
Niobium. The UV spectrum of LS IV–14°116 exhibits more than 50 Nb IV lines, with predicted equivalent widths of 10 to 25 mÅ, based on line positions and oscillator strengths from Tauheed & Reader (2005). The strongest lines are shown in Fig. 3, including Nb IV 1363.762, 1424.368, 1434.223, 1447.491, 1508.721, 1510.832, 1517.461, and 1532.981 Å. Data for Nb V are available on R. Kurucz’s website, with the strongest lines observed at 1212.15 and 1267.52 Å. This represents the first detection of Nb IV-V lines in a stellar spectrum.
The strongest predicted niobium lines in EC 22536–5304, Nb V 1212.15, 1258.84 Å, are both blended, so we report only an upper limit, which is expected to be close to the true abundance.
Molybdenum. About 200 Mo IV-V lines with equivalent widths of 10 to 22 mÅ are detected in LS IV–14°116, representing the first detection of Mo in a hot subdwarf star. We use data from Rauch et al. (2016a) for Mo IV-VI and R. Kurucz’s list for Mo III. The strongest isolated lines include Mo IV 1643.095 Å and Mo V 1586.883, 1661.215, 1668.652, and 1699.736 Å (see Fig. 3). Although about ten Mo III lines are predicted to exceed 10 mÅ, none are clearly identified, likely due to inaccurate wavelengths.
Molybdenum lines are weak in EC 22536–5304, but Mo V 1590.405, 1661.215, 1699.736 Å are clearly detected at strengths between 5 and 10 mÅ.
Technetium (undetected). The radioactive Tc might be detectable in LS IV–14°116 if present in a similar quantity as Nb or Mo; however, the experimental wavelengths required for Tc IV-V are not available, preventing a meaningful analysis. This situation is analogous to that described by Werner et al. (2015) for hot WDs, where the absence of reliable line positions similarly precluded a detection.
Ruthenium, rhodium and palladium. Atomic data for ruthenium, rhodium and palladium are scarce; NIST lists next to no atomic data for any of these metals in states III to V. However, Kurucz (2018) provides extensive line lists up to Ru V, Rh V, and Pd V, as computed with Cowan’s Hartree–Fock code, which allows us to study these elements. In particular, their triply ionised states are predicted to produce strong lines in the 1450–1725 Å range of the LS IV–14°116 spectrum.
The situation is best for Pd IV, because its laboratory UV spectrum was analysed by Barakat et al. (1985b,a), providing precise energy levels and line positions. About 70 Pd IV lines with strengths greater than 15 mÅ are detected in the HST spectrum of LS IV–14°116, mostly between 1470 and 1725 Å. The most prominent examples are located at 1476.057, 1484.736, 1573.958, 1660.625, 1667.397, 1682.904, 1683.808, 1699.596, and 1704.443 Å (see Fig. 3). This represents the first detection of any palladium lines in a hot star. According to Kurucz (2018), no Pd V lines are expected within the E140M wavelength range.
Because no experimental energy levels are available for Ru IV-V and Rh IV-V, their predicted line positions are uncertain by roughly 2–20 Å, corresponding to typical theoretical energy-level uncertainties of 100–1000 cm−1. Several unidentified features in the STIS spectrum of LS IV–14°116 are likely due to Ru IV in particular, but secure identifications require more accurate wavelength measurements. No Ru, Rh, or Pd lines are detected in EC 22536–5304, although Pd IV 1484.736 Å is close to the detection threshold.
Silver. The spectrum of Ag IV has been studied in detail by Ankita & Tauheed (2020), who provide both experimental wavelengths and theoretical oscillator strengths. Ag IV 1485.872 Å is consistent with a fairly isolated line in LSIV–14°116 (see Fig. 4); predicted lines at Ag IV 1515.100, 1516.012, 1558.149 Å are consistent with the observation, but blended with stronger lines.
Experimental wavelengths in the UV range for AgV are also available (Kildiyarova et al. 1995), but the lack of oscillator strengths prevents clear identifications. No silver lines are detected in EC 22536–5304.
Cadmium. The UV spectrum of LS IV–14°116 shows dozens of strong Cd IV lines, identified using the experimental wavelengths of Joshi et al. (1980). Notable examples include Cd IV 1167.277, 1294.078, 1337.299, 1418.092, 1418.882, 1482.940, and 1513.883 Å (Fig. A.2), with equivalent widths up to ~70 mÅ. Many Cd IV lines arising from the 2D ground term exhibit the expected fine-structure splitting into 2D5/2 and 2D3/2, including the lines at 1492.965, 1501.517, and 1513.883 Å, several of which are resolved in our HST spectrum.
Several features may also be attributed to CdV, for example at 1419.966 and 1502.650 Å, using experimental wavelengths from van Kleef & Joshi (1982). However, Cd IV is expected to dominate in the atmosphere of LS IV–14°116, and lines identified as blends between Cd IV and Cd V (e.g. 1337.30, 1492.97, 1513.88 Å) are likely primarily due to Cd IV. Unfortunately, no oscillator strengths are available for either ion.
Cd IV lines are much weaker in EC 22536–5304 than in LS IV–14°116, to the point that clear identification is not possible without oscillator strengths. Cd IV 1337.30, 1482.94 Å match otherwise unidentified lines at strengths of 5–10 mÅ.
Indium. Detailed experimental studies of In III-V and corresponding Cowan-code oscillator strengths were presented by Varshney & Tauheed (2017, 2013, 2016). Using these data, we identify 25 In IV lines in the UV spectrum of LSIV–14°116, each with an estimated equivalent width above 10 mÅ. Prominent, isolated In IV lines include 1300.588, 1320.040, 1333.879, 1344.579, 1406.092, and 1446.000 Å. The strong In IV 1381.786 Å feature is likely blended with As IV 1381.76 Å, a line identified by Rao et al. (1931) but lacking an oscillator strength. The strongest indium features are shown in Fig. 3.
Five In V lines were detected in the DO white dwarf RE 0503–289 by Rauch et al. (2020). In LS IV–14°116, these lines are predicted to have strengths of order 10 m Å but are blended with stronger features and therefore remain undetected.
In addition, the In III 1625.3 Å resonance line (5s1/2–5p3/2) is detected in LS IV–14°116. Given that this transition involves the 5s ground state and that the dominant isotope 115In has nuclear spin I = 9/2, significant hyperfine splitting is expected (see Appendix A.2). Magnetic dipole hyperfine constants computed by Roy et al. (2014) using a relativistic coupled-cluster approach yield A(5s1/2) = 21.4 GHz and A(5p3/2) = 0.7 GHz. Using these values, we identify the In III 1625.3 Å feature in our spectrum of LS IV–14°116 as a resolved hyperfine doublet; the HFS of the upper level is negligible.
In IV-V lines are weaker in EC 22536–5304, and only an upper abundance limit can be derived, based on the non-detection of In IV 1320.04, 1344.58, 1406.09, and 1509.82 Å.
Tin. The optical spectrum of LS IV–14°116 shows strong Sn IV lines at 3862.1 and 4217.2 Å (Dorsch et al. 2020), but the tin lines in its UV spectrum are even stronger. Using atomic data from Haris & Tauheed (2012), we identified 14 Sn III lines in LS IV–14°116 with equivalent widths between 10 and 30 mÅ. The strongest of these is the Sn III 1251.383 Å resonance line, the only Sn III line detected in both stars. For this line and Sn III 1347.637 Å, the observed spectrum is better reproduced using the lower oscillator strengths from Colón & AlonsoMedina (2010), which we adopt here.
The strongest tin lines in both stars are the Sn IV resonance lines at 1314.530 and 1437.527 Å, for which we use atomic data by Kaur et al. (2020) (see Figs. 3 and 10). In LS IV–14°116 they reach equivalent widths of about 720 mÅ and 520 mÅ, respectively, and are sufficiently saturated that their strengths are strongly influenced by Stark broadening, which we model using theoretical widths from de Andrés-García et al. (2016). The inclusion of Stark broadening further leads to more consistent abundances obtained from Sn III and Sn IV lines.
A Sn V line at 1160.755 Å was previously identified in RE 0503–289 by Werner et al. (2012). This star also exhibits additional Sn V lines at 1205.727, 1254.116, and 1355.627 Å, with measured wavelengths and identifications by Wu (1967). These lines are also detected in LS IV–14°116, but unfortunately, no oscillator strengths are available.
Similar to the optical Ge IV lines, Sn IV 3861.207, 4216.192 Å are too weak in our model at the best-fit abundance obtained from UV Sn II-IV lines. This explains our lower tin abundance compared to Dorsch et al. (2020).
Antimony. The dominant ionisation stages of antimony in LS IV–14°116 and EC 22536–5304 are Sb IV and Sb V; none of the Sb III lines listed by Andersen & Lindgard (1977) and Tauheed et al. (1992) are detected. We use the oscillator strengths for Sb IV from Jönsson et al. (2012); however, since their line positions are often inaccurate by several Å, we adopt the wavelengths measured by Rana et al. (2001) using normal incidence spectroscopy. We clearly detect the strong Sb IV 1171.436, 1192.934, 1199.150 Å lines in LS IV–14°116 (see Fig. 3), which is the first detection of Sb IV in any star.
The strongest antimony line observed in both LS IV–14°116 and EC 22536–5304 is the Sb V 1226 Å resonance transition (![Mathematical equation: $\[4 \mathrm{d}^{10} ~5 \mathrm{s}~^{2} \mathrm{S}_{1 / 2}{-}4 \mathrm{~d}^{10} ~5 \mathrm{p}~^{2} \mathrm{P}_{1 / 2}^{\mathrm{o}}\]$](/articles/aa/full_html/2026/07/aa59774-26/aa59774-26-eq21.png) ), which was previously used by Werner et al. (2018) to determine the antimony abundance in RE 0503–289. We adopt the experimental oscillator strength from Pinnington et al. (1985), as reported by Morton (2000). In our spectra of LS IV–14°116 and EC 22536–5304, the feature appears unusually broad and is best reproduced as a split line; the doublet is clearly resolved in HD 127493 at 1225.941 and 1226.002 Å (see Fig. 5). The splitting is likely due to hyperfine structure, with additional broadening arising from the presence of two natural isotopes of antimony with different nuclear spins (I121 = 5/2, I123 = 7/2); we assume a solar isotopic ratio. We implemented HFS splits as described in Appendix A.2; a satisfactory fit to the observed profile is achieved with magnetic dipole hyperfine constants of A ≈ 35 GHz for the 121Sb ground state (27 GHz for 123Sb) and A ≈ 9 GHz (7 GHz for 123Sb) for the upper level; only the doublet splitting caused by the lower level is clearly resolved. While this is the first observational analysis of this hyperfine structure, the derived splitting is consistent with the Dirac-Fock prediction of Beck & Datta (1991) for the 121Sb ground state. The Sb IV 1499.3 Å resonance line also likely exhibits hyperfine (triplet) splitting, but it is weak in EC 22536–5304 and blended with Ni IV and Zn III in LS IV–14°116.
), which was previously used by Werner et al. (2018) to determine the antimony abundance in RE 0503–289. We adopt the experimental oscillator strength from Pinnington et al. (1985), as reported by Morton (2000). In our spectra of LS IV–14°116 and EC 22536–5304, the feature appears unusually broad and is best reproduced as a split line; the doublet is clearly resolved in HD 127493 at 1225.941 and 1226.002 Å (see Fig. 5). The splitting is likely due to hyperfine structure, with additional broadening arising from the presence of two natural isotopes of antimony with different nuclear spins (I121 = 5/2, I123 = 7/2); we assume a solar isotopic ratio. We implemented HFS splits as described in Appendix A.2; a satisfactory fit to the observed profile is achieved with magnetic dipole hyperfine constants of A ≈ 35 GHz for the 121Sb ground state (27 GHz for 123Sb) and A ≈ 9 GHz (7 GHz for 123Sb) for the upper level; only the doublet splitting caused by the lower level is clearly resolved. While this is the first observational analysis of this hyperfine structure, the derived splitting is consistent with the Dirac-Fock prediction of Beck & Datta (1991) for the 121Sb ground state. The Sb IV 1499.3 Å resonance line also likely exhibits hyperfine (triplet) splitting, but it is weak in EC 22536–5304 and blended with Ni IV and Zn III in LS IV–14°116.
Tellurium. Marcinek & Migdalek (1994) computed oscillator strengths for several Te IV multiplet transitions, which are still the only data available for the HST and UVES spectral ranges. We converted their configuration interaction oscillator strengths to individual fine structure transitions using Wigner 6j symbols. Our line positions are based on experimental energy levels from Crooker & Joshi (1964). This allowed us to clearly detect the Te IV 1168.391, 1196.938 Å 5s25p 2p° − 5s 5p2 2D° resonance doublet lines in LS IV–14°116, at strengths close to 20 mÅ (see Fig. 3). The lowest-lying transitions in Te IV are the intercombination transitions 5s2 5p 2P°–5s 5p2 4P°, the positions of which were measured by Tauheed et al. (1992). The strongest of these transitions is clearly observed LS IV–14°116 at 1448.043 Å, while 1355.554, 1439.532 Å are blended. Unfortunately, no oscillator strengths are available for these transitions. Te IV 1168.391 Å is clearly detected in EC 22536–5304, but Te IV 1196.938 Å is not.
We adopt atomic data for Te V from Ekman et al. (2013) and experimental wavelengths from Tauheed et al. (2000). The Te V 1281.634 Å resonance line is clearly detected in both LS IV–14°116 and EC 22536–5304. Other strong transitions, such as Te V 1236.259 and 1406.549 Å, are blended with stronger lines in both stars. The Te VI 1313.874 Å feature, identified in RE 0503–289 by Rauch et al. (2017b), is not present in LS IV–14°116 owing to its lower Teff.
lodine. Iodine was detected in RE 0503–289 by Rauch et al. (2017b), but the I VI lines used in that study are not excited in our stars. No oscillator strengths are available for IIV, and all lines in the HST range listed by Tauheed et al. (1991) are inter-combination transitions that are not detected in LS IV–14°116.
The situation is more favourable for IV. The lowest-lying transitions in this ion are the intercombination lines 5s2 5p 2P° − 5s 5p2 4P°, which are covered by the HST range. Lifetimes for these transitions were measured by Ansbacher et al. (1991), and their wavelengths refined by Tauheed et al. (1992). Although partially blended with unidentified features, I V 1234.516 Å is detected in LS IV–14°116, while I V 1244.831 Å is blended with the stronger Sr IV 1244.763 and 1244.888 Å lines. The inclusion of I V 1150.760 Å also improves the spectral fit for LS IV–14°116, though this feature is blended with unidentified lines (see Fig. 3). Line positions between the 5s25d, 5p3, 5s5p5d, and 5s5p6s configurations of I V were measured by Tauheed et al. (1998), but unambiguous identification of these transitions is not possible without oscillator strengths.
No iodine lines are detected in EC 22536–5304, but a rough upper limit could be estimated from I V 1244.831 Å, which is also blended with Sr IV in this star.
Xenon. Singly ionised xenon was already detected in the chemically peculiar hot BHB star Feige 86 (Bonifacio et al. 1995; Castelli et al. 1997; Németh 2017), where the enrichment is likely caused by diffusion (e.g. Michaud et al. 2008).
Strong Xe VI and Xe VII lines were observed in the hot white dwarf RE 0503–289 by Rauch et al. (2017a), who also provided oscillator strengths for Xe IV and Xe V, which we use here. Xenon lines are weak in the HST spectrum of LS IV–14°116, but several are identifiable, including Xe IV 1157.450 Å and Xe V 1151.078, 1225.097, and 1281.13 Å, at equivalent widths between 10 and 15 mÅ (see Fig. 3). We can thus determine a xenon abundance for LS IV–14°116, although the weakness of the lines results in increased uncertainty. No xenon lines are detected in EC 22536–5304, although Xe V 1281.13 Å is isolated and close to the detection threshold.
Caesium. Strong caesium IV-VI lines were recently detected in FUSE spectrum of the cool (Teff = 49500 K) DO white dwarf HD 149499B by Chayer et al. (2023). However, none of the lines reported in that study are detectable in LS IV–14°116 or EC 22536–5304; most predicted Cs IV-VI transitions lie below 1150 Å, outside the wavelength range covered by HST. The only Cs IV line with an experimental wavelength within the HST range is 1282.659 Å (Reader 1983). This line lies close to a sharp, otherwise unidentified feature at 1282.606 Å in LS IV–14°116, but in the absence of additional supporting lines, this identification remains uncertain.
Barium. The strongest barium line in LS IV–14°116, Ba IV 1503.576 Å, is blended with two nickel lines, while the weak Ba IV lines in EC 22536–5304 are blended with unidentified features. As a result, we provide only an upper limit for the barium abundance in both stars, based on the atomic data from Sharma et al. (2014). We also searched for Ba V lines as predicted by Rauch et al. (2014), but none were detected.
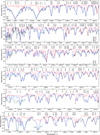 |
Fig. 1 Strongest Ga, Ge, Se, Kr, Sr, Y, and Zr lines in the STIS/E140M spectrum of LS IV–14°116 (grey), compared to our best model with (blue) and without (red) heavy metals (Z > 30). The light blue model further includes interstellar absorption. |
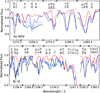 |
Fig. 2 Top: strongest As III-IV lines in LS IV–14°116, with available oscillator strengths (see Fig. A.2 for As IV lines without). Bottom: similar, but for Br IV; we also note Hg IV 1158.191 Å (see Fig. 1 for line definitions). |
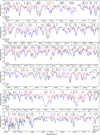 |
Fig. 3 Nb (Z = 41), Mo (42), Pd (46), Cd (48), In (49), Sn (50), Te (52), I (53), and Xe (54) lines in LS IV–14°116 (cf. Fig. 1). |
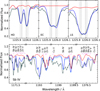 |
Fig. 5 Top: HFS splitting of Sb V 1226 Å in HD 127493, EC 22536–5304, and LS IV–14°116. Split component wavelengths are indicated. The HFS splits are clearly resolved in HD 127493 because it was observed at R = 114 000. Bottom: strongest Sb IV lines in LS IV–14°116 (cf. Fig. 1). |
4.4 Lanthanides
Starting from praseodymium, triply ionised lanthanides have partially filled 4f subshells, which give rise to numerous low-lying energy levels. In particular, for elements such as neodymium and erbium, the 4f–5p transition arrays fall within the STIS/E140M spectral range (Cowan 1973). We report the first detection of spectral lines from triply ionised lanthanides in any astronomical object. These lines are clearly identifiable in EC 22536–5304 and, to a lesser extent, in LS IV–14°116. Lanthanides have not previously been observed in hot subdwarf stars. The strongest detected lines are shown in Figs. 6 and 7.
Lanthanum. Theoretical oscillator strengths for La IV were computed by Karaçoban Usta & Eser (2020a,b), yielding reasonably accurate wavelengths despite relying on the older energy levels from Martin et al. (1978) rather than the more precise data of Epstein & Reader (1979). After applying small wavelength corrections, several La IV lines were identified in EC 22536–5304, the strongest at 1368.029 and 1369.278 Å with equivalent widths of about 15 mÅ (Fig. 6). No La V lines are expected, as its level structure lacks low-lying transitions within the STIS/E140M wavelength range (Epstein & Reader 1976).
La IV lines are weaker in LS IV–14°116 and are blended with stronger lines due the higher iron group abundances in LS IV–14°116. As a result, we could only determine an upper limit, mostly based on the non-detection of La IV 1368.029 Å.
Cerium. Cerium lines are prominent in EC 22536–5304, with approximately 20 Ce IV and Ce V lines detected at strengths between 10 and 25 mÅ. For Ce IV, we use atomic data from Carvajal Gallego et al. (2021) and adopt experimental wavelengths from Reader & Wyart (2009). The strongest Ce IV lines are at 1289.41, 1332.16, and 1372.72 Å. We use data from Wajid et al. (2021) for Ce V. The most prominent Ce V lines are found at 1315.826, 1341.640, 1362.125, 1362.668, and 1401.064 Å, all with strengths close to 20 mÅ.
In LS IV–14°116, the Ce IV 1332.16 Å line is strong and relatively unblended. Although no other isolated cerium features are present, this line matches the corresponding feature observed in EC 22536–5304. We therefore use it to estimate the cerium abundance in LS IV–14°116, which is consistent with the slightly blended Ce IV 1372.72 Å.
Praseodymium. We used data from Enzonga Yoca & Quinet (2013) to search for Pr IV. The Pr IV resonance triplet at 1574.827, 1578.384, 1578.384 Å is detected in EC 22536–5304 at EWs between 10 and 16 mÅ. Atomic data for highly ionised Pr was provided by Carvajal Gallego et al. (2023), but the only two experimentally confirmed lines in the STIS/E140M range (1234.070, 1342.775 Å; Kaufman & Sugar 1967) originate from high-lying levels and are very weak. No praseodymium lines are detected in LS IV–14°116.
Neodymium. After cerium, the strongest lanthanide lines in the STIS spectrum of EC 22536–5304 originate from Nd IV. We use atomic data from Enzonga Yoca & Quinet (2014), based on experimental wavelengths from Wyart et al. (2007). The strongest lines, Nd IV 1327.750, 1336.985, 1342.019, 1344.737, 1372.199, and 1378.094 Å, are 4f3–4f25d transitions. As shown by Meftah et al. (2008), the level structure of Nd V does not produce strong transitions in the STIS wavelength range. Their energy levels are thus only used to compute the Nd V partition function.
Almost all Nd IV lines in LS IV–14°116 are blended with stronger features from other elements; the only relatively unblended line is Nd IV 1344.737 Å. We therefore derive only an upper abundance limit, which is likely close to the true value.
Promethium to holmium (undetected). The available atomic data for ions from promethium (Pm; Z = 61) to holmium (Ho; Z = 67) are insufficient for reliable spectral line identification. For promethium (Pm), samarium (Sm), and europium (Eu) in ionisation stage IV, theoretical energy levels have been calculated by Dzuba et al. (2003). However, these calculations are not accurate enough for definitive line identification and none of the predicted Sm IV levels exhibit LS- or intermediate-coupling allowed dipole transitions. Despite these limitations, the calculations predict twelve 4f 5I − 5d 5K transitions for Pm IV in the 1300 to 1450 Å range and three 4f 5L6 − 5d 7K5,6,7 transitions for Eu IV between 1550 and 1750 Å. This suggests that these lines could be detectable in EC 22536–5304, given the expected strong enrichment7. It is the lack of experimental UV wavelength measurements that currently limits our ability to confirm these predictions8. Although accurate line positions are available for gadolinium (Gd) IV (Kielkopf & Crosswhite 1970) and terbium (Tb) IV (Spector & Sugar 1976), their line strengths are likely near the detection threshold in EC 22536–5304, and without oscillator strengths, they cannot be confidently identified. For triply and quadruply ionised dysprosium (Dy) and holmium (Ho), no accurate energy level data are available.
Erbium and thulium. Chikh et al. (2021) provide both experimental wavelengths and theoretical oscillator strengths for Er IV. We used their data to search for Er IV in EC 22536–5304. While these lines are weak, we detect Er IV 1325.911 Å, which is only slightly affected by a blend with two weaker Nd IV lines. Additional Er IV lines at 1355.931, 1362.934, 1379.405 Å are marginally detected at EWs close to 5 mÅ.
We used Tm IV data from Enzonga Yoca & Quinet (2017), based on experimental wavelengths from Meftah et al. (2007). The non-detection of Tm IV 1183.631, 1407.304 Å yields an upper limit on the thulium abundance in EC 22536–5304.
Ytterbium. Several strong Yb IV lines are detected in EC 22536–5304, using atomic data from Wyart et al. (2001). Clear detections include transitions at 1316.040, 1326.361, 1350.259, 1355.791, 1407.050, 1407.998, and 1430.288 Å (Fig. 7). Experimental wavelengths and energy levels for Yb V were provided by Meftah et al. (2013). Although oscillator strengths are also reported in that work, our HST spectra only cover the highlying 4f116s − 4f116p transition array, which is not detectable. There are no clearly detected ytterbium lines in LSIV–14°116. The upper limit is mostly based on Yb IV 1355.791, 1407.998 Å.
Lutetium. Lu IV lines are detected at 1333.790 and 1429.082 Å in EC 22536–5304, using atomic data from Motoumba et al. (2020), which are based on the experimental line positions of Sugar & Kaufman (1972). The latter line requires a higher abundance to be reproduced, possibly due to an uncertain continuum location. Owing to this inconsistency and the absence of additional lines, we assign a large uncertainty to the derived lutetium abundance in EC 22536–5304. Oscillator strengths for Lu V were provided by Maison et al. (2022), and experimental wavelengths by Kaufman & Sugar (1978); however, no Lu V lines are detected in either star.
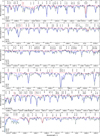 |
Fig. 7 Ce (Z = 58), Pr (59), Nd (60), Er (68), Yb (70), Lu (71), Hf (72), W (74), and Os (76) lines in EC 22536–5304 (cf. Fig. 1). |
4.5 Heavy trans-iron elements
Given the detection of a high lanthanide abundance in EC 22536–5304, in addition to its known extreme enrichment in lead, it is natural to search for other heavy trans-iron elements. This section examines elements from hafnium (Hf, Z = 72) to bismuth (Bi, Z = 83). LS IV–14°116 is discussed only where reliable measurements were possible; all elements were analysed in analogy to EC 22536–5304.
Hafnium. Experimental wavelengths and energy levels for Hf IV-V were reported by Sugar & Kaufman (1974). Many of these lines are prominent in EC 22536–5304 (Fig. 7), at equivalent widths of up to 30 mÅ. Because oscillator strengths were unavailable, we computed new radiative data for Hf IV, specifically for the analysis of EC 22536–5304; this work is described in Sect. 3.1. The strongest identified Hf IV transitions occur at 1305.241, 1357.399, 1390.390, 1491.670, 1528.820, and 1717.210 Å. Atomic data for Hf V were provided by Motoumba et al. (2020). Although somewhat weaker than Hf IV, prominent Hf V lines are observed in EC 22536–5304 at 1232.030, 1396.664, 1407.169, 1408.381, 1413.511, 1433.434, 1437.267, 1437.734, and 1445.403 Å. The latter line is blended with Hg IV 1445.347 Å and W V 1445.413 Å.
Two hafnium lines are detected in LS IV–14°116, Hf IV 1491.669, 1717.181 Å (see Fig. A.4), consistent with the blended Hf IV 1357.339 Å line. All other hafnium lines are strongly blended or too weak to be detected.
Tantalum. Kildiyarova et al. (1996) and Churilov et al. (1996) carried out detailed experimental studies of the 5d2 − 5d5f and 5d2 − 5d7p transition arrays of Ta IV, respectively, providing accurate energy levels. While these transitions lie shortwards of the HST wavelength range, the remaining low-lying arrays were analysed by Meijer & Metsch (1978). Their experimental wavelengths were used to search for Ta IV features in EC 22536–5304, but even the 5d2 − 5d6p lines seem to be weak and are not clearly detected without oscillator strengths. Possible detections include Ta IV 1211.94, 1223.73, 1238.12, 1311.35, 1607.70, and 1631.65 Å at strengths close to 5 mÅ.
Ta V is the dominant ionisation stage in the photosphere of EC 22536–5304. The wavelengths of Ta V lines, including the strong 1393 and 1709 Å doublet from the ground 6s2 S1/2 level, were measured by Meijer & Klinkenberg (1973), and oscillator strengths for these transitions were later calculated by Migdalek & Siegel (2014). Hyperfine splitting of both lines was detected by Sugar & Kaufman (1975) using sliding-spark spectroscopy, who also reported the corresponding split components. We adopted their data to account for this effect, which is clearly visible in the STIS spectrum of EC 22536–5304 (Fig. 8), confirming the identification of the Ta V lines. Ta V 1392.527, 1392.585 Å are also detected in LS IV–14°116, representing the only clearly identifiable tantalum features in that star. While oscillator strengths for Ta VI were provided by Motoumba et al. (2020), these lines are too weak to be observable in either star.
Tungsten. Oscillator strengths for W IV-VI were provided by Enzonga Yoca et al. (2012b,c,a), using experimental wavelengths. The dominant tungsten lines in EC 22536–5304 originate from W V, in particular at 1262.707, 1264.066, 1286.456, 1305.601, 1311.462, 1367.341, 1373.439, 1445.413 (blend with Hf V), 1591.804, 1604.126, and 1662.540 Å. W IV 1515.932, 1519.813 Å and the W VI 1168.151, 1467.958 Å doublet are also observed; the strongest lines are shown in Fig. 7. To our knowledge, this is the first detection of W IV-VI lines in any star. Tungsten lines are weaker in LS IV–14°116, and the only clearly identified line is W V 1305.611 Å. W VI 1168.151 Å and W V 1262.707 Å are close to the detection threshold, while all other tungsten lines are either too weak or blended with stronger lines.
W V 1305.601, 1311.462 Å are detected and clearly resolved in the STIS/E140H spectrum of HD 127493, at strengths close to 10 mÅ. This means that tungsten can be detected at abundances close to 1000 times solar even at Teff ≈ 40 000 K if high-quality HST spectra are used.
Rhenium. Extensive line lists using experimental wavelengths and theoretical oscillator strengths for Re IV-V were provided by Azarov & Gayasov (2018b,a), and are listed on NIST. No rhenium lines are detected in LS IV–14°116. The strongest predicted rhenium lines in EC 22536–5304 are Re V 1220.879, 1244.996, and 1250.176 Å. The 1220.879 Å line is blended with unidentified lines, while the 1244.996 and 1250.176 Å lines lie near the detection threshold. An upper limit is therefore adopted for EC 22536–5304, which is likely close to the true abundance.
Osmium. Experimental wavelengths and theoretical oscillator strengths for Os IV and Os V lines were provided by Ryabtsev et al. (1998) and Azarov et al. (1997), respectively. As shown in Fig. 7, the strongest osmium feature in the HST spectrum of EC 22536–5304 is Os V 1193.388 Å. We also identify Os V 1382.703, 1398.421, 1411.865, 1469.177, and 1492.470 Å, all arising from 5d3 6s–5d3 6p transitions and each with equivalent widths of roughly 8 mÅ. The Os IV lines at 1266.236 and 1349.639 Å appear somewhat too strong at the abundances inferred from the Os V lines, possibly indicating non-LTE effects in Os IV. We detect no osmium lines in LS IV–14°116.
Iridium. It is very likely that both Ir IV and Ir V are present in the UV spectrum of EC 22536–5304. We used line positions and oscillator strengths by Azarov & Gayasov (2016b) to search for Ir IV. Ir IV 1502.57 Å matches a strong line in EC 22536–5304, but the high abundance it implies is inconsistent with Ir IV 1227.20, 1457.77 Å, which are close to the detection threshold.
Energy levels and line positions for Ir V were provided by Gayasov et al. (2000), but oscillator strengths are not available. Several predicted Ir V lines are close to unidentified lines (e.g. at 1226.397 Å). However, the lack of oscillator strengths and the limited accuracy in predicted line positions prevented clear identifications. Thus we cannot derive an iridium abundance.
Platinum. Using line positions and oscillator strengths from Azarov & Gayasov (2016c), several Pt IV lines are clearly identified in EC 22536–5304 (Fig. 9), the strongest being 1225.453, 1288.911, and 1460.932 Å. Pt V lines from Azarov & Gayasov (2016a) are also detected, including the prominent transitions at 1259.086, 1279.711, 1308.355 Å (blended with a similarly strong Hg V line), and 1343.341 Å, with equivalent widths of about 10 mÅ, as well as weaker lines at 1259.951, 1340.936, 1359.136, and 1361.247 Å.
In LS IV–14°116, the least blended Pt IV transitions occur at 1198.375, 1225.453, 1260.461, 1359.136, and 1465.227 Å. These lines are close to the detection threshold, but we prefer to state an upper limit.
Gold. No gold lines are clearly detected in either star. Using experimental wavelengths for Au IV at 1404.520 and 1450.948 Å from Zainab et al. (2023), we derive an upper limit for EC 22536–5304, which may be close to its actual abundance, given that these transitions coincide with otherwise unidentified lines. We also searched for Au III using data from Zainab & Tauheed (2019), but this ion is not abundant enough. Although Tauheed & Rashid (2021) do not predict any Au V transitions within the STIS spectral range, Azarov et al. (2000) report experimental line positions that fall within this range. Given the weakness of gold lines in EC 22536–5304, and the lack of oscillator strengths, we cannot identify any Au V lines.
Mercury. The UV spectrum of Hg IV was analysed in detail by van der Valk et al. (1990), an analysis that was later updated by Rashid & Tauheed (2021), who also provide oscillator strengths. Using their data, we detect more than 50 strong Hg IV lines in EC 22536–5304, the strongest of which are shown in Fig. 10, reaching equivalent widths of about 25 mÅ. Hg IV 1360.952, 1414.933, 1481.336 Å, are strong enough to be detected in He-sdO stars at abundances exceeding about 500× solar. In particular Hg IV 1360.952 Å is typically isolated in relatively cool He-sdO stars, and not blended even at super-solar iron abundances. In addition, strong lines are predicted at 1082.778, 1109.970 Å; well outside the HST/STIS range, but covered by FUSE spectra of several He-sdO stars.
Line positions for Hg V were measured by Wyart et al. (1993) using laboratory normal incidence spectroscopy, most importantly the 5d7 6s − 5d7 6p transitions. Many of these transitions correspond to strong lines observed in the STIS spectrum of EC 22536–5304. Theoretical oscillator strengths for the Os-like isoelectronic sequence, including Hg V, were calculated by Taghadomi et al. (2022) using the multiconfiguration Dirac-Hartree-Fock method implemented in the GRASP2K package (Jönsson et al. 2013). Because these ab initio calculations were not adjusted to observed energy levels, the resulting line positions are inaccurate. We therefore limited our analysis to the 5d7 6s − 5d7 6p transitions, correcting their level energies using the experimental values from Wyart et al. (1993). The strongest Hg V lines in EC 22536–5304 are shown in Fig. 10.
Oscillator strengths, experimental wavelengths and theoretical energies for Hg VI were reported by Tauheed & Rashid (2021), but only for transitions in the extreme ultraviolet. No additional line positions have been published, preventing the identification of the expected 5d66s − 5d66p transitions within the STIS wavelength range.
There are no clearly isolated mercury lines in the spectrum of LS IV–14°116. Hg IV 1360.952 Å is dominant enough to estimate an abundance, consistent with Hg IV 1157.627, 1158.191, and 1239.792 Å.
Thallium. The strongest thallium features in EC 22536–5304 are Tl IV transitions involving the lower 5d96s levels. These lines exhibit pronounced hyperfine splitting, first measured experimentally by Arvidsson (1930), with a more detailed analysis of Tl IV carried out later by Joshi et al. (1990). Additional line positions for the 6p-6d transitions, which show no hyperfine splitting, were reported by Wyart et al. (1992). Since no oscillator strengths are available in the literature, new values were computed for this work, as described in Sect. 3.1. The two dominant thallium isotopes (203Tl, 205Tl; nuclear spin I = 1/2) produce the observed hyperfine doublets if the 5d96s levels have magnetic dipole constants of A ≃ 70 GHz. The strongest detected lines are the hyperfine doublets at 1272.872 and 1272.946, 1337.081 and 1337.136, 1377.703 and 1377.797, and 1404.613 and 1404.668 Å (see Fig. 10), along with the single line at 1374.619 Å, in addition to several weaker transitions.
Raassen & Joshi (1991) performed spark spectroscopy for Tl V, providing accurate positions for 5d86s − 5d86p transitions, including many hyperfine doublets. More than 30 of these lines match otherwise unidentified lines in the HST spectrum of EC 22536–5304 (e.g. at 1258.148 Å), and some of the strongest are shown in Fig. A.3. Unfortunately, no oscillator strengths are available for Tl V. Energy levels for Tl VI were taken from Raassen et al. (1994) to compute the partition function. Several unidentified lines (1170.179, 1170.557, 1197.011 Å) are close to the their Tl VI positions, but given the absence of oscillator strengths, these cannot be confidently identified.
The strongest Tl III lines originate from 5d106s − 5d106p transitions, which Joshi & Raassen (1990) showed to exhibit pronounced hyperfine splitting. We adopt their hyperfine constants and the oscillator strengths from de Andrés-García et al. (2019). While Tl III 1558.78 Å is below the detection threshold in EC 22536–5304, the Tl III 1266.19/1266.29 Å hyperfine doublet is detected, but is weak and blended with O III 1266.13 Å. The feature is further predicted to be too strong relative to the more prominent Tl IV lines.
Tl IV 1337.081, 1337.136 Å are fairly strong and isolated in LS IV–14°116. Tl IV 1404.613, 1404.668 Å are strong but blended with Ni IV 1404.589 Å. While there are no other unblended lines, these two doublets are clearly detected and allow us to estimate the thallium abundance in LS IV–14°116.
Lead. As expected from its extreme enrichment, EC 22536–5304 shows very strong lead lines in the UV spectrum. Some of the most prominent features are displayed in Fig. 10, with a summary of all detected lines provided in Table A.6. Our analysis uses the atomic data of Dougan et al. (2025), calculated specifically for EC 22536–5304 and comprising photoionisation cross-sections and radiative data for Pb III–VI, allowing the construction of non-LTE model atoms. As discussed by Dougan et al. (2025), non-LTE effects weaken predicted line strengths for the strongest UV transitions, leading to slightly higher inferred abundances. These effects are even stronger for optical Pb III-IV lines, which appear weaker in non-LTE and would imply higher lead abundances. However, these transitions arise from highlying levels near the upper energy limits of the model atoms, and we therefore regard the low-lying UV transitions as more reliable.
For Pb III, transitions not included among the 20 levels analysed by Dougan et al. (2025) were supplemented with data from Alonso-Medina et al. (2009). These sources provide coverage for 16 observed Pb III lines in the UV spectrum of EC 22536–5304. Lyall (1965) analysed the spark spectrum of Pb I-IV, providing the most extensive experimental data for Pb III in the UV. Although they reported 0.01 Å precision, their wavelengths show systematic offsets of up to 0.04 Å relative to the STIS spectrum of EC 22536–5304, from which we remeasured the Pb III line positions. Their measurements remain useful for identifying Pb III lines without published oscillator strengths, notably those at 1220.49, 1275.69, 1290.33, and 1327.14 Å.
The Pb IV structure of Dougan et al. (2025) includes the lowest 30 energy levels, leaving several upper levels of observed transitions unaccounted for. For 13 additional transitions from lower 5d9 6s6p levels to upper 8s2S, 7d2S, and 5g2G levels, we adopted data from Alonso-Medina et al. (2011). Additional Pb IV lines measured by spark spectroscopy in Gutmann (1969) are also strong in the STIS spectrum of EC 22536–5304, but their oscillator strengths remain unavailable.
The strongest observed Pb V lines are 5d96s–5d96p transitions, which are covered by Dougan et al. (2025). The line list was further extended to include 5d96p–5d96d transitions from Colón et al. (2014); among these, only Pb V 1240.07 Å is clearly detected, while the others are blended with stronger features. Three additional lines were identified using wavelengths reported by Gutmann (1969). The strongest Pb VI lines in EC 22536–5304 are observed at 1151.59 Å and 1164.98 Å (blended with Pb III), next to an additional 12 weaker lines.
An accurate treatment of Stark broadening is important for the strong Pb IV-V lines in the UV spectrum of EC 22536–5304. This is most obvious for the strongly saturated Pb IV 1313 Å, for which we adopted the electron-impact Stark widths of Hamdi et al. (2013), implemented via the temperature-dependent fitting formula provided in the STARK-B database (Sahal-Bréchot et al. 2025). In addition to Pb IV 1313 Å, Stark broadening is significant for the Pb V lines at 1157.9 Å and 1189.9 Å. Only the latter is included in the calculations of Alonso-Medina & Colón (2012). When these widths are adopted, the synthetic profile is stronger than observed; we therefore do not use their Stark widths for this transition and exclude the line from the abundance analysis.
The Pb IV 1313 Å resonance line is known to show HFS, as discussed by O’Toole & Heber (2007). We include HFS splitting using their implementation; a more detailed discussion of lead HFS is beyond the scope of this paper and will be addressed in the future. In addition, the various Pb III-V lines in EC 22536–5304 may be used to probe vertical abundance stratification, as demonstrated by Scott et al. (2024). A detailed stratification analysis, is beyond the scope of this work; however, strong stratification is excluded by the good match between optical and UV lines, given that they form at different depths in the photosphere.
Pb IV 1313.1 Å and Pb V 1157.9, 1185.4, 1189.9 Å are clearly detected in LS IV–14°116, allowing a reliable abundance determination.
Bismuth. Several strong bismuth lines are observed in EC 22536–5304, using atomic data from Arya & Tauheed (2020, 2022, 2023) for Bi III-V. Because of its high nuclear spin (I = 9/2), bismuth exhibits pronounced hyperfine splitting (Arvidsson 1930). The strongest feature is the well-resolved Bi IV hyperfine triplet at 1316.939, 1317.067, and 1317.176 Å (Fig. 10). The Bi IV 1149.7, 1180.18 Å, the 1201.5 and 1207.1 Å HFS triplets, and 1437.6 Å are also observed.
Although Bi III is a minor ionisation stage at the high Teff of EC 22536–5304, the 1224.62 Å line and the unresolved 1346.088/1346.124 Å hyperfine doublet are still detected. Bi III lines were also identified in the HgMn star HR 7775 by Wahlgren et al. (2001), who provide the relevant HFS constants. The intercombination resonance HFS multiplet Bi III 1423.4 Å is also present in EC 22536–5304, albeit weak.
The Bi V 1171.233/1171.260/1171.296/1171.339 Å hyperfine complex is also detected in EC 22536–5304 but appears blended due to intrinsic line broadening; additional Bi V are observed at 1202.96, 1206, and 1306.95 Å. The Bi V 1139.55 Å resonance quadruplet is expected to be strong, but it lies outside the STIS range. It is likely present in other hot subdwarfs observed by the FUSE satellite. Overall, the predicted Bi V lines are too weak relative to Bi IV, possibly due to non-LTE effects.
The strongest bismuth feature in LS IV–14°116 is the Bi IV 1317 Å triplet. While this triplet is partially blended with unidentified lines, it is strong enough for an abundance estimate.
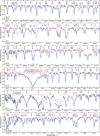 |
Fig. 10 Strongest Hg IV-V, Tl IV, Pb III–VI, and Bi III-V lines, next to Sn IV, in the STIS spectrum of EC 22536–5304 (cf. Fig. 1). |
5 Discussion
In total, we measure 40 surface metal abundances for LS IV–14°116 and 41 for EC 22536–5304; these abundance patterns are by far the most extensive obtained for any hot subdwarf to date. The measured abundances are listed in Table A.3 and compared with each other and with solar number fractions in Fig. 11.
5.1 Surface composition of EC 22536–5304
EC 22536–5304 has an sdF-type companion with a metallicity of [Fe/H] = −2 and significant α-enhancement (+0.4 dex; Dorsch et al. 2021). In contrast, EC 22536–5304 itself is enriched relative to the solar number fractions in carbon (+1.1 dex) and N (+0.5 dex), and only mildly subsolar in O (−0.1 dex; see Table A.3). The α-elements Ne, Mg, Si, and S appear at approximately −1 dex, consistently higher than the metallicity of the sdF companion. Phosphorus clearly deviates from this pattern: its abundance is about 0.9 dex higher than solar. The P/Si ratio in EC 22536–5304 is strongly enhanced (log n(P)/n(Si) = 0.0, compared with the solar value of −2.1). The iron-group elements display a distinct V-shaped pattern: the abundances decline from Ar and Ti (both −0.4 dex) through Cr (−0.8 dex) to a minimum at Fe (−2.5 dex), before increasing again from Co (−1.5 dex) and Ni (−1.0 dex) up to Zn (+0.6 dex). Heavy elements are moderately to extremely enhanced relative to solar, increasing from +1.4 dex in Ga to +4.2 dex in Tl. This corresponds to an approximately constant mass fraction (around −5.7 dex) with a pronounced even-odd effect (upper panel of Fig. 11). Lead is a notable exception, exhibiting an extremely high abundance of −2.1 dex by mass, i.e. a +6.1 dex enrichment relative to solar; bismuth shows a similar, though less extreme, enhancement, at −4.1 dex by mass (+5.3 dex enrichment).
A preliminary version of this surface abundance pattern was already discussed by Battich et al. (2025) in the context of their hot-flasher models, which focused on i-process nucleosynthesis. Their models reproduce the observed abundances remarkably well, including the CNO pattern, the phosphorous enrichment, the α-element abundances at approximately −1 dex relative to solar, the characteristic V-shaped iron-group pattern, and the enhancements in heavy metals (cf. Fig. 11). This excellent match is achieved specifically for an initial metallicity of [Fe/H] = −1.15 (or Z = 0.001) for the sdOB component9. Among their grid, models with hydrogen-envelope masses of 5.5 × 10⁻⁴ M⊙ (001–4) and 6.0 × 10⁻⁴ M⊙ (001–5) both provide good fits; as model 001–4 yields a marginally better agreement, we adopt it for the following comparisons.
Most of the observed elements are affected, to varying degrees, by nucleosynthesis during the formation of the sdOB. The abundances of H, He, C, N, and O are strongly modified by hydrogen and helium fusion. The increased phosphorus to silicon ratio is a clear signature of neutron capture10, given that P can be produced via 30Si(n, γ)31Si → 31P + β−. The V-shaped abundance pattern among the iron-group elements also reflects neutron-capture processing, in which the lighter iron-group nuclei act as seeds for the production of heavier species. By contrast, the α-elements Ne, Mg, Si, and S are only weakly affected by nuclear processing; their observed abundances close to −1 dex are consistent with the initial metallicity required by Battich et al. (2025). This agreement, however, raises the question why the sdF-companion has lower α-element abundances closer to −1.6 dex (only Mg is directly measured in the sdF; Dorsch et al. 2021). For the trans-iron elements, the predicted abundances generally agree well with the observations. The main exceptions are Ga to Kr, which are under-predicted by about 1 dex by Battich et al. (2025), and Pb and Bi, which are underpredicted by about 1.6 dex. Yb, Hf, and Ta are under-predicted by around 0.5 dex.
We thus conclude that the surface composition of EC 22536–5304 is dominated by nucleosynthesis during its initial helium flash. Atomic diffusion is not only unnecessary to explain the observed abundances, but its effect in this star must also be small for the majority of elements. The remaining differences between the predictions of Battich et al. (2025) and the observed surface abundances of EC 22536–5304 may instead arise from limitations in the nucleosynthesis models. In particular, the treatment of convection in one-dimensional, mixing-length-based models, may overestimate the entropy barrier between the H- and He-burning convection zones (Herwig et al. 2014; Battich et al. 2025). The under-predicted abundances of Yb to Ta, Pb and Bi, may point to a longer neutron exposure. However, differences in abundances particularly for Z > 40 may also arise from uncertainties in the neutron-capture reaction rates (Martinet et al. 2024).
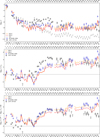 |
Fig. 11 Top: surface abundances of EC 22536–5304 and LS IV–14°116 by number, compared to the solar pattern of Asplund et al. (2009), supplemented with heavy-metal results from Grevesse et al. (2015), Lodders (2019), and Asplund et al. (2021). Middle: abundances relative to solar. Bottom: solar relative abundances, scaled to the same Fe abundance. Also shown are two models from Battich et al. (2025) with initial metallicity [Fe/H] = −1.15 and envelope masses of 0.00055 M⊙ (001-4) and 0.0006 M⊙ (001-5). |
5.2 Surface composition of LS IV–14°116
For Z < 25 and Z > 52, the surface composition of LS IV–14°116 is broadly similar to EC 22536–5304. Helium is enriched to a lesser degree (log n(He)/n(H) = −0.6 versus −0.1 in EC 22536–5304), and the C and O abundances are also lower, whereas N and Mg are nearly identical in the two stars. Ne is more abundant in LS IV–14°116, while Si is slightly less abundant. As in EC 22536–5304, the P/Si ratio in LS IV–14°116 is strongly enhanced (log n(P)/n(Si) = −0.4, compared with the solar value of −2.1). The Ar abundance is close to solar in LS IV–14°116 and therefore significantly higher than in EC 22536–5304. The iron-group elements show a similar V-shaped pattern in both stars, but in LS IV–14°116 the pattern is shifted upwards by about +2 dex relative to EC 22536–5304. Despite this, LS IV–14°116 remains Fe-poor with respect to the Sun (−0.8 dex).
These differences in the light-metal abundance pattern likely reflect differences in both initial metallicity and the formation histories of the two stars. EC 22536–5304 is known to have formed through Roche lobe overflow onto its sdF-type companion (Dorsch et al. 2021), which corresponds to the hot-flasher scenario modelled by Battich et al. (2025). In contrast, LS IV–14°116 is single (Dorsch et al. 2020) and has been proposed to originate from the merger of a He-core white dwarf with a less massive hybrid HeCO-WD (Miller Bertolami et al. 2022)11. Although detailed nucleosynthesis predictions for such WD mergers are not available, the surface composition of LS IV–14°116 suggests material processed by H- and He-burning, with slightly less He-processed material than in EC 22536–5304. Its strong phosphorus enrichment is plausibly produced by the same neutron-capture mechanism inferred for EC 22536–5304. The higher iron-group abundances may indicate a somewhat higher initial metallicity than that of EC 22536–5304, although LS IV–14°116 was likely still initially metal-poor, consistent with its halo-like kinematics (Randall et al. 2015).
LS IV–14°116 is substantially richer in heavy metals up to tellurium compared to EC 22536–5304, reaching maximum enhancements of 4 to 4.6 dex relative to solar in Sr to Sn (Fig. 11, middle panel). However, a more meaningful comparison is obtained by using Fe-normalised, solar-relative abundances, [X/Fe] = log n/nFe − log n⊙/nFe,⊙ (Fig. 11, bottom panel), which removes the offset caused by the different residual Fe abundances in the two stars. On this scale, the agreement between LS IV–14°116 and EC 22536–5304 in the Fe to Mo range is striking. Beyond Sb, LS IV–14°116 shows Fe-normalised abundances relative to solar of about 3 to 4 dex, whereas EC 22536–5304 reaches 6 to 7 dex up to Tl, 8 dex for Bi and 8.7 dex for Pb.
These similarities suggest that the neutron-capture process operated in a broadly comparable way in both stars between Fe and Mo; the differences in absolute abundances may reflect variations in the duration of neutron exposure or in the efficiency with which processed material was mixed to the surface. In contrast, the production of the heaviest elements appears less efficient in LS IV–14°116 than in EC 22536–5304. This difference may arise from variations in the initial metallicity, as well as in neutron densities and timing of mixing. In particular, a shorter nucleosynthesis timescale in LS IV–14°116 could limit the build-up of the heaviest species. Such variations are naturally expected given the different formation channels of EC 22536–5304 and LS IV–14°116.
We therefore propose that neutron capture plays a dominant role in the heavy-element enrichment of LS IV–14°116, operating in an analogous fashion to EC 22536–5304 but under conditions altered by the merger process. This highlights the need for nucleosynthesis calculations for both double He-WD mergers and He-WD + hybrid He/CO-WD mergers. Finally, we note that diffusion processes may still influence the surface composition of LS IV–14°116 without contradicting the i-process interpretation; their significance can only be assessed once detailed nucleosynthesis models for such mergers become available.
5.3 Diffusion
Atomic diffusion, encompassing gravitational settling and radiative levitation, operates efficiently in hot stars with radiative envelopes and is widely invoked to explain the surface abundance anomalies observed in He-poor hot subdwarfs and blue horizontal-branch stars. In He-poor sdB stars, diffusion leads to strong helium depletion12 (Michaud et al. 2011) and pronounced heavy-element overabundances, in some cases reaching 3 dex above solar (Chayer et al. 2006; O’Toole & Heber 2006; Blanchette et al. 2008). Similar chemical peculiarities are observed in HgMn and Ap/Bp stars, where diffusion is generally accepted as the dominant mechanism shaping the atmospheric composition (Michaud et al. 2015). Heavy-metal iHe-sdOB stars also show some resemblance to a small group of metal-rich DO and DAO white dwarfs, such as RE 0503–289, HD 149499B, HZ 21 (Chayer et al. 2005; Rauch et al. 2012), and BD–22°3467 (Löbling et al. 2020). These objects are thought to be post-AGB stars that experienced a late thermal pulse, or descendants of mergers involving a He-core white dwarf. Their surface compositions may therefore reflect s-process enrichment during the AGB phase, subsequently modified by radiative levitation. Interestingly, very late thermal pulses are also candidates for i-process nucleosynthesis (Herwig et al. 2011).
Given their high effective temperatures and largely radiative atmospheres, one might expect atomic diffusion to operate in iHe-sdOB stars similarly to hot DO and DAO white dwarfs. However, the heavy-metal enriched DO and DAO stars are significantly hotter (50 000–80 000 K) than the iHe-sdOBs discussed here (35 000–40 000 K), as well as less compact (log g ≈ 5.8, rather than ≈7.5 in DOs). This implies not only weaker gravitational settling, but also different dominant ions in the atmospheres of heavy-metal subdwarfs, whose atomic structure yields different opacities (lines and ionisation), thereby affecting radiative acceleration and diffusion efficiency. For EC 22536–5304, the close agreement between the observed abundances and the i-process predictions discussed in Sect. 5.1 argues against diffusion playing a dominant role in shaping the observed abundance pattern.
A plausible explanation for the decreased importance of diffusion is provided by the elevated helium abundances of iHe-sdOB stars and their intermediate temperature. The ionisation of He II produces an opacity peak that can drive shallow convection (Groth et al. 1985). Recent work shows that this instability extends into the iHe-sdOB regime, but not into He-poor sdO/B stars (see Appendix A.1 of Dorsch 2024). Consistent with this, our TLUSTY models of both LS IV–14°116 and EC 22536–5304 exhibit convective instability in the continuum-forming layers according to the Schwarzschild criterion (Fig. 12), enclosing a total mass of only ~10−12 M⊙. Although this convection does not significantly affect the radiative energy transport, even weak mixing may in principle inhibit atomic diffusion. Hydrodynamical simulations of analogous shallow convection zones in DA WDs suggest that overshoot can extend the mixed region by up to 2.5 orders of magnitude beyond the Schwarzschild boundary (Freytag et al. 1996; Cunningham et al. 2019) in terms of mixed mass. No quantitative diffusion-convection models exist for iHe-sdOB stars.
The mixed mass we find falls well short of the ~10−8 M⊙ that the simplified models of Unglaub (2010) require to preserve the initial surface composition of a Teff = 40 000 K He-sdO, and of the ~10−7.5 M⊙ of outer mixing invoked by Michaud et al. (2011) to reproduce the abundance pattern of He-poor sdB stars. In the latter case, He-driven convection is absent altogether, implying that additional mixing mechanisms are required. Line-driven wind calculations for hot subdwarfs similar to our targets predict mass-loss rates of ![Mathematical equation: $\[\dot{M} \sim 10^{-14}\]$](/articles/aa/full_html/2026/07/aa59774-26/aa59774-26-eq22.png) to 10−13 M⊙ yr−1 (Krtička et al. 2016), which can compete with gravitational settling in the outer-most layers (Unglaub & Bues 2001; Unglaub 2008)13. However, neither the shallow convection seen in our He-rich models nor a weak wind at these predicted rates match the mixing depths required by Unglaub (2010) and Michaud et al. (2011). The physical origin of the mixing, if it indeed exists, thus remains uncertain for hot subdwarf stars, and for iHe-sdOBs in particular.
to 10−13 M⊙ yr−1 (Krtička et al. 2016), which can compete with gravitational settling in the outer-most layers (Unglaub & Bues 2001; Unglaub 2008)13. However, neither the shallow convection seen in our He-rich models nor a weak wind at these predicted rates match the mixing depths required by Unglaub (2010) and Michaud et al. (2011). The physical origin of the mixing, if it indeed exists, thus remains uncertain for hot subdwarf stars, and for iHe-sdOBs in particular.
5.4 Stellar neutron capture in context
Since the discovery of radioactive technetium in AGB stars (Merrill 1952), neutron-capture nucleosynthesis has been firmly established in these objects (Burbidge et al. 1957), primarily via the slow neutron-capture s-process at low neutron densities (Busso et al. 1999). Clear s-process signatures are observed in several classes of chemically peculiar stars, including barium stars and related binaries (Jorissen et al. 2019), S stars (Shetye et al. 2020), carbon-enhanced metal-poor stars with s-process enrichment (CEMP-s; Aoki et al. 2007), post-AGB stars (De Smedt et al. 2016), and planetary nebulae (Sharpee et al. 2007). By contrast, metal-poor stars with strong europium enhancements and actinide-rich stars exhibit abundance patterns consistent with the high-density r-process nucleosynthesis (Roederer et al. 2010; Holmbeck et al. 2018).
A growing number of heavy-element-enriched stars show abundance patterns that cannot be explained by either a pure s- or r-process, nor by simple mixtures of the two (e.g. Hampel et al. 2016; Karinkuzhi et al. 2021). These stars typically display enhanced first- and second-peak neutron-capture elements together with relatively high Eu abundances, implying neutron capture at intermediate neutron densities. Such patterns are naturally produced by the i-process (see Wiedeking et al. 2025 for a review).
The i-process occurs at neutron densities of about 1013 to 1016 cm−3. These densities are only achievable in specific environments involving the sudden ingestion of protons into C-rich He-burning convective regions. Neutrons are released by the reaction chain 12C(p, γ)13N(β+)13C(α, n)16O. The 12C(p, γ)13N reaction occurs at the outer regions of the convective zone at about 150 MK. 13N is carried by convection to the hotter interior of the convective region where He burning is taking place. This allows the formation of 13C via β+ decay in an already very hot environment (300 MK) where the reaction 13C(α, n)16O takes place.
As reviewed by Wiedeking et al. (2025), such conditions may arise during the AGB phase of low-mass, low-metallicity stars, in very late thermal pulses of post-AGB stars, and in rapidly accreting white dwarfs. In hot subdwarfs, the i-process can occur during the initial helium flash, when helium ignition drives convection that ingests protons and establishes a secondary, hydrogen-burning convective zone. The resulting 13C is mixed into the helium-burning layer, where neutron production ensues. The best-fitting models of Battich et al. (2025, cf. Fig. 11) predict peak neutron densities of 1.7 × 10¹² (model 001-5) and 3.0 × 1013 cm−3 (model 001-4), at the low end of i-process densities. In these models, the two convective zones remain connected for about 500 yr14 before an entropy barrier formed by the hydrogen-burning shell (Iben 1976) separates them, halting further 13C supply and surface enrichment. Similar nucleosynthesis during the helium flash may also occur in very low-metallicity stars (Campbell et al. 2010). The specific conditions required for mixing i-processed material to the surface (e.g. a low initial metallicity; Battich et al. 2025), may in part explain the relative rarity of heavy-metal sdOBs.
Against this theoretical background, EC 22536–5304 and LS IV–14°116 currently provide some of the most direct evidence for i-process nucleosynthesis. This conclusion is supported by two main observations. First, their heavy-element enrichments exceed those of cool stars by several orders of magnitude, consistent with relatively undiluted in situ production. While even strongly enriched post-AGB stars typically show iron-scaled enhancements of [X/Fe] ≲ 2.5 dex (e.g. De Smedt et al. 2016), LS IV–14°116 reaches values >5 dex and EC 22536–5304 exceeds 8 dex. Secondly, EC 22536–5304 is securely identified as a post-RGB star, implying that its heavy elements must have been synthesised during the helium-flash phase itself, rather than being inherited from prior AGB evolution.
Although it cannot be excluded that EC 22536–5304 and LS IV–14°116 formed from material that was mildly enriched in neutron-capture elements, any such pre-enrichment would be negligible compared to their present abundance levels. In contrast to most other heavy-element-enhanced stars, whose compositions are likely influenced at least in part by s-process nucleosynthesis, the extreme and evolutionarily constrained abundance patterns of EC 22536–5304 and LS IV–14°116 strongly point to helium-flash-driven i-process nucleosynthesis as their dominant origin.
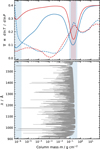 |
Fig. 12 Convection test for LS IV–14°116 (red) and EC 22536–5304 (blue). Top: adiabatic gradients (solid), computed following Groth et al. (1985), compared with the TLUSTY model gradients (dashed); shaded regions indicate layers unstable according to the Schwarzschild criterion. Bottom: UV line formation depths in EC 22536–5304; the strongest lines arise from C III-IV, while most others are due to heavy metals. |
6 Summary and conclusions
We have presented a detailed abundance analysis of the heavy-metal intermediate-helium hot subdwarfs LS IV–14°116 and EC 22536–5304 based on high-resolution HST/STIS spectroscopy. These stars exhibit some of the most extreme surface chemical compositions known among all stars. Our analysis provides the strongest observational evidence to date that their heavy-element (Z > 30) enrichment is predominantly the result of in situ nucleosynthesis via the intermediate neutron-capture (i-) process, linked directly to their formation histories.
We performed a comprehensive spectral analysis, deriving photospheric abundances for 40 metals in LS IV–14°116 and 39 metals in EC 22536–5304, making this the most detailed abundance study of any hot subdwarf star to date. At effective temperatures close to 40 000 K and high absolute abundances, both stars show many strong trans-iron transitions arising from ionisation stages III–V. Because standard atomic line lists are incomplete for these ions, we assembled a large atomic database by collecting experimental wavelengths and theoretical oscillator strengths from a wide range of individual atomic-physics studies.
Where no suitable data were available, we computed new atomic data, including oscillator strengths for As III, Se III, Hf IV, and Tl IV (Sect. 3.1; Deprince et al., in prep.), as well as photoionisation cross-sections for Pb III-VI (see Dougan et al. 2025). Using this expanded dataset, we identified numerous heavy-metal transitions for the first time in a stellar spectrum. In addition, several ions were found to exhibit clear signatures of hyperfine splitting, including In III, Sb V, Ta V, Tl IV-V, Pb IV, and Bi III-V, highlighting the importance of detailed atomic structure effects when modelling chemically extreme stars.
Both LS IV–14°116 and EC 22536–5304 are iron-poor compared to solar values: −0.8 dex in LS IV–14°116 and −2.5 dex in EC 22536–5304. Even so, both stars are extraordinarily enriched in all detectable trans-iron elements up to bismuth. Given the consistent enrichment across more than 20 heavy elements in each star, it is likely that all stable elements in this mass range are similarly enhanced. The two stars nevertheless show distinct abundance patterns. In LS IV–14°116, abundances rise to ~4.3 dex above solar up to the lanthanides, declining to ~3 dex at higher atomic numbers. In contrast, EC 22536–5304 exhibits a steady increase with atomic number, from ~1 dex in Ga to peak enrichments of 6.2 and 5.4 dex in Pb and Bi, respectively. Although LS IV–14°116 is known as a zirconium star, it does show a ~3 dex enrichment even in the heaviest elements, thus lower than EC 22536–5304. These systematic differences indicate that neutron capture operated under different physical conditions in the two stars.
The abundance pattern of EC 22536–5304 is remarkably well reproduced by the late hot-flasher models of Battich et al. (2025). In this scenario, a star is stripped to a thin hydrogen envelope near the RGB tip before undergoing a delayed helium flash, during which hydrogen-rich material is ingested into the helium-burning region, enabling i-process nucleosynthesis. This scenario is consistent with its nature as binary system with an sdF-type companion on an orbital period of 457 days (Dorsch et al. 2021). Most predicted abundances agree with the observations within 0.5 dex, with larger deviations (1.5 dex) confined to Pb and Bi. This close agreement strongly supports self-enrichment through i-process nucleosynthesis as the origin of the heavy-metal pattern in EC 22536–5304. The survival of a clear signature of nucleosynthesis, despite the possible action of diffusion, demonstrates that surface abundances in heavy-metal subdwarfs preserve a measurable imprint of their formation channel.
The abundance pattern of LS IV–14°116 closely resembles that of EC 22536–5304 up to approximately Mo, but shows systematically lower abundances for the heavier elements. We conclude that LS IV–14°116 also experienced i-process nucleosynthesis, most likely during its formation as a merger product (Miller Bertolami et al. 2022), where hydrogen ingestion into a helium-burning layer can occur under conditions distinct from the late hot-flasher scenario. This demonstrates that the i-process can operate in multiple post-RGB evolutionary pathways15.
Several avenues for future work follow naturally from this study. From an atomic physics perspective, oscillator strengths remain unavailable for several detected ions, including Rb IV, Cd IV, I IV, Ta IV, and Tl V, while the data are incomplete for As IV, Se IV, and Sn V. Experimental wavelengths are also lacking for a number of important ions, such as Rb V, Ru IV-V, Rh IV-V, and partially for Se III and Mo III, while Sm IV, Eu IV, Dy IV, and Ho IV lack both oscillator strengths and wavelength measurements (see Table A.4 for a summary). Photoionisation cross-sections for stages III-VI are currently only available for lead; new data for important species such as Ga, Ge, Zr, and Sn would be valuable to improve the accuracy of future abundance measurements by including non-LTE effects. In addition, unresolved hyperfine splitting and isotopic shifts may still influence measured line strengths; improved atomic data, including nuclear magnetic moments, magnetic dipole constants, and isotopic shifts, would benefit future modelling. A future study based on the same HST dataset used here will determine the isotopic composition of lead in EC 22536–5304 and HD 127493, providing a direct observational test of i-process nucleosynthesis predictions.
Further constraints on the origin of the heavy-metal enrichment in EC 22536–5304 may be obtained by analysing the surface composition of its sdF-type companion, which likely preserves the system’s initial abundance pattern. To date, only its overall metallicity and α-enhancement have been measured (Dorsch et al. 2021) and a more detailed abundance analysis, including heavy elements such as Ba, would be valuable.
More broadly, our results suggest that heavy-element self-enrichment via the i-process may be more widespread among He-rich hot subdwarfs than currently recognised, but often remains hidden owing to the lack of ultraviolet spectroscopy. Extremely He-rich sdO stars, thought to form predominantly through mergers similar to LS IV–14°116 (Zhang & Jeffery 2012), may undergo comparable nucleosynthetic processing that is undetectable in optical spectra. Heavy-metal hot subdwarfs therefore provide unique empirical laboratories for studying i-process nucleosynthesis under well-constrained evolutionary conditions. As some He-rich subdwarfs are sufficiently massive to evolve into helium giants and possibly towards the AGB, they may also represent an unrecognised channel for returning i-process material to the interstellar medium. Cooler extreme helium stars should likewise be examined for signatures of trans-iron element enrichment. Finally, nucleosynthesis models including i-process neutron capture should be applied to both double He-WD mergers and He-WD + hybrid He/CO-WD mergers.
Data availability
The updated SYNSPEC 51 version and the line list used here are available at https://github.com/mattidorsch/synspec51_fork. Plots of the full HST-STIS/E140M spectra of LS IV–14°116 and EC 22536–5304 compared with their best-fit models, as well as the Pb model atoms are available at https://zenodo.org/records/20073988.
Acknowledgements
We thank Claudio Mendoza for his preliminary Ge III data. MD was supported by the Deutsches Zentrum für Luft- und Raumfahrt (DLR) through grant 50-OR-2304. JD is supported by the FWO and F.R.S.-FNRS under the Excellence of Science (EOS) programme (numbers O.0004.22 and O022818F). PQ is F.R.S.-FNRS Research Director. The Armagh Observatory and Planetarium is funded by direct grant from the Northern Ireland Department for Communities. DJD thanks the Science and Technology Facilities Council (STFC) of the UK Research and Innovation (UKRI) body for their support through his studentship (Project Code: ST/Y509504/1). LJAS gratefully acknowledges UKRI for support in the form of a Frontier Research grant under the UK government’s ERC Horizon Europe funding guarantee (SYMPHONY; PI Bowman; grant number: EP/Y031059/1). This research is based on observations made with the NASA/ESA Hubble Space Telescope obtained from the Space Telescope Science Institute, which is operated by the Association of Universities for Research in Astronomy, Inc., under NASA contract NAS 5-26555. These observations are associated with program(s) 17072. The TOSS service (http://dc.g-vo.org/TOSS) used for this paper was constructed as part of the activities of the German Astrophysical Virtual Observatory. This research has made use of NASA’s Astrophysics Data System.
References
- Acquista, N., & Reader, J. 1980, J. Opt. Soc. Am., 70, 789 [Google Scholar]
- Alonso-Medina, A., & Colón, C. 2012, MNRAS, 427, 1312 [Google Scholar]
- Alonso-Medina, A., Colón, C., & Zanón, A. 2009, MNRAS, 395, 567 [Google Scholar]
- Alonso-Medina, A., Colón, C., & Porcher, P. 2011, At. Data Nucl. Data Tables, 97, 36 [Google Scholar]
- Andersen, T., & Lindgard, A. 1977, J. Phys. B At. Mol. Phys., 10, 2359 [Google Scholar]
- Ankita, S., & Tauheed, A. 2020, J. Quant. Spec. Radiat. Transf., 254, 107193 [Google Scholar]
- Ansbacher, W., Pinnington, E. H., Tauheed, A., & Kernahan, J. A. 1991, J. Phys. B At. Mol. Phys., 24, 587 [Google Scholar]
- Aoki, W., Beers, T. C., Christlieb, N., et al. 2007, ApJ, 655, 492 [NASA ADS] [CrossRef] [Google Scholar]
- Arvidsson, G. 1930, Nature, 126, 565 [Google Scholar]
- Arya, N. K., & Tauheed, A. 2020, J. Quant. Spec. Radiat. Transf., 255, 107253 [Google Scholar]
- Arya, N. K., & Tauheed, A. 2022, J. Quant. Spec. Radiat. Transf., 292, 108353 [Google Scholar]
- Arya, N. K., & Tauheed, A. 2023, Eur. Phys. J. D, 77, 150 [Google Scholar]
- Asplund, M., Grevesse, N., Sauval, A. J., & Scott, P. 2009, ARA&A, 47, 481 [NASA ADS] [CrossRef] [Google Scholar]
- Asplund, M., Amarsi, A. M., & Grevesse, N. 2021, A&A, 653, A141 [NASA ADS] [CrossRef] [EDP Sciences] [Google Scholar]
- Azarov, V. I., & Gayasov, R. R. 2016a, At. Data Nucl. Data Tables, 108, 154 [Google Scholar]
- Azarov, V. I., & Gayasov, R. R. 2016b, At. Data Nucl. Data Tables, 108, 81 [Google Scholar]
- Azarov, V. I., & Gayasov, R. R. 2016c, At. Data Nucl. Data Tables, 108, 118 [Google Scholar]
- Azarov, V. I., & Gayasov, R. R. 2018a, At. Data Nucl. Data Tables, 119, 175 [Google Scholar]
- Azarov, V. I., & Gayasov, R. R. 2018b, At. Data Nucl. Data Tables, 119, 218 [Google Scholar]
- Azarov, V. I., Raassen, A. J. J., Joshi, Y. N., Uylings, P. H. M., & Ryabtsev, A. N. 1997, Phys. Scr, 56, 325 [Google Scholar]
- Azarov, V. I., Raassen, A. J. J., Wyart, J. F., Joshi, Y. N., & Churilov, S. S. 2000, Phys. Scr, 61, 133 [Google Scholar]
- Bahr, J. L., Pinnington, E. H., Kernahan, J. A., & O’Neill, J. A. 1982, Can. J. Phys., 60, 1108 [Google Scholar]
- Barakat, M. M., van Kleef, T. A. M., & Joshi, Y. N. 1985a, Physica B+C, 132, 251 [Google Scholar]
- Barakat, M. M., Van Kleef, T. A. M., & Raassen, A. J. J. 1985b, Physica B+C, 132, 240 [Google Scholar]
- Battich, T., Miller Bertolami, M. M., Córsico, A. H., & Althaus, L. G. 2018, A&A, 614, A136 [NASA ADS] [CrossRef] [EDP Sciences] [Google Scholar]
- Battich, T., Miller Bertolami, M. M., Serenelli, A. M., Justham, S., & Weiss, A. 2023, A&A, 680, L13 [NASA ADS] [CrossRef] [EDP Sciences] [Google Scholar]
- Battich, T., Miller Bertolami, M. M., Weiss, A., et al. 2025, A&A, 699, A298 [NASA ADS] [CrossRef] [EDP Sciences] [Google Scholar]
- Bautista, M. A., Romano, P., & Pradhan, A. K. 1998, ApJS, 118, 259 [Google Scholar]
- Beck, D. R., & Datta, D. 1991, Phys. Rev. A, 44, 758 [Google Scholar]
- Blanchette, J. P., Chayer, P., Wesemael, F., et al. 2008, ApJ, 678, 1329 [NASA ADS] [CrossRef] [Google Scholar]
- Bonifacio, P., Castelli, F., & Hack, M. 1995, A&AS, 110, 441 [Google Scholar]
- Brauner, M., Pignatari, M., Masseron, T., García-Hernández, D. A., & Lugaro, M. 2024, A&A, 690, A262 [NASA ADS] [CrossRef] [EDP Sciences] [Google Scholar]
- Burbidge, E. M., Burbidge, G. R., Fowler, W. A., & Hoyle, F. 1957, Rev. Mod. Phys., 29, 547 [NASA ADS] [CrossRef] [Google Scholar]
- Burke, P. G. 2011, R-Matrix Theory of Atomic Collisions, 61 [Google Scholar]
- Busso, M., Gallino, R., & Wasserburg, G. J. 1999, ARA&A, 37, 239 [Google Scholar]
- Byrne, C. M., Jeffery, C. S., Tout, C. A., & Hu, H. 2018, MNRAS, 475, 4728 [NASA ADS] [CrossRef] [Google Scholar]
- Campbell, S. W., Lugaro, M., & Karakas, A. I. 2010, A&A, 522, L6 [NASA ADS] [CrossRef] [EDP Sciences] [Google Scholar]
- Carvajal Gallego, H., Palmeri, P., & Quinet, P. 2021, MNRAS, 501, 1440 [Google Scholar]
- Carvajal Gallego, H., Deprince, J., Berengut, J. C., Palmeri, P., & Quinet, P. 2023, MNRAS, 518, 332 [Google Scholar]
- Castelli, F., Parthasarathy, M., & Hack, M. 1997, A&A, 321, 254 [NASA ADS] [Google Scholar]
- Chayer, P., Fontaine, M., Fontaine, G., Wesemael, F., & Dupuis, J. 2006, Baltic Astron., 15, 131 [Google Scholar]
- Chayer, P., Vennes, S., Dupuis, J., & Kruk, J. W. 2005, ApJ, 630, L169 [Google Scholar]
- Chayer, P., Mendoza, C., Meléndez, M., Deprince, J., & Dupuis, J. 2023, MNRAS, 518, 368 [Google Scholar]
- Chikh, A., Deghiche, D., Meftah, A., et al. 2021, J. Quant. Spec. Radiat. Transf., 272, 107796 [Google Scholar]
- Churilov, S. S., & Joshi, Y. N. 1996, J. Opt. Soc. Am. B Opt. Phys., 13, 11 [Google Scholar]
- Churilov, S. S., Kildiyarova, R. R., & Joshi, Y. N. 1996, Can. J. Phys., 74, 145 [Google Scholar]
- Colón, C., & Alonso-Medina, A. 2010, J. Phys. B At. Mol. Phys., 43, 165001 [Google Scholar]
- Colón, C., Alonso-Medina, A., & Porcher, P. 2014, At. Data Nucl. Data Tables, 100, 272 [Google Scholar]
- Cowan, R. D. 1973, Nucl. Instrum. Methods, 110, 173 [Google Scholar]
- Cowan, R. D. 1981, The Theory of Atomic Structure and Spectra [Google Scholar]
- Crooker, A. M., & Joshi, Y. N. 1964, J. Opt. Soc. Am., 54, 553 [Google Scholar]
- Cunningham, T., Tremblay, P.-E., Freytag, B., Ludwig, H.-G., & Koester, D. 2019, MNRAS, 488, 2503 [NASA ADS] [CrossRef] [Google Scholar]
- Curtis, L. J. 1992, J. Opt. Soc. Am. B Opt. Phys., 9, 5 [Google Scholar]
- Dawson, H., Geier, S., Heber, U., et al. 2024, A&A, 686, A25 [NASA ADS] [CrossRef] [EDP Sciences] [Google Scholar]
- Dawson, H., Dorsch, M., Geier, S., et al. 2026, A&A, 707, A6 [NASA ADS] [CrossRef] [EDP Sciences] [Google Scholar]
- de Andrés-García, I., Alonso-Medina, A., & Colón, C. 2016, MNRAS, 455, 1145 [Google Scholar]
- de Andrés-García, I., Colón-Ruiz, C., & Colón, C. 2019, ApJ, 870, 131 [Google Scholar]
- De Smedt, K., Van Winckel, H., Kamath, D., et al. 2016, A&A, 587, A6 [NASA ADS] [CrossRef] [EDP Sciences] [Google Scholar]
- Dorsch, M. 2024, PhD thesis, Friedrich Alexander University of Erlangen-Nuremberg, Germany [Google Scholar]
- Dorsch, M., Latour, M., & Heber, U. 2019, A&A, 630, A130 [NASA ADS] [CrossRef] [EDP Sciences] [Google Scholar]
- Dorsch, M., Latour, M., Heber, U., et al. 2020, A&A, 643, A22 [EDP Sciences] [Google Scholar]
- Dorsch, M., Jeffery, C. S., Irrgang, A., Woolf, V., & Heber, U. 2021, A&A, 653, A120 [NASA ADS] [CrossRef] [EDP Sciences] [Google Scholar]
- Dorsch, M., Heber, U., Jeffery, C. S., & Scott, L. 2022, From atomic physics to stellar evolution: decoding the heavy-metal subdwarfs with HST, HST Proposal. Cycle 30, ID. #17072 [Google Scholar]
- Dougan, D. J., Dorsch, M., Scott, L. J. A., et al. 2025, MNRAS, 544, 4353 [Google Scholar]
- Dutta, N. N., & Majumder, S. 2011, ApJ, 737, 25 [Google Scholar]
- Dutta, N. N., Roy, S., Dixit, G., & Majumder, S. 2013, Phys. Rev. A, 87, 012501 [Google Scholar]
- Dyall, K. G., Grant, I. P., Johnson, C. T., Parpia, F. A., & Plummer, E. P. 1989, Comput. Phys. Commun., 55, 425 [NASA ADS] [CrossRef] [Google Scholar]
- Dzuba, V. A., Safronova, U. I., & Johnson, W. R. 2003, Phys. Rev. A, 68, 032503 [NASA ADS] [CrossRef] [Google Scholar]
- Ekman, J., Grumer, J., Hartman, H., & Jönsson, P. 2013, J. Phys. B At. Mol. Phys., 46, 095001 [Google Scholar]
- Elabidi, H. 2021, MNRAS, 503, 5730 [Google Scholar]
- Elabidi, H., Sahal-Bréchot, S., Dimitrijević, M. S., Belhadj, W., & Hamdi, R. 2023, MNRAS, 522, 819 [Google Scholar]
- Elias, L. R. 1972, PhD thesis, University of Wisconsin, Madison [Google Scholar]
- Enzonga Yoca, S., & Quinet, P. 2013, J. Phys. B At. Mol. Phys., 46, 145003 [Google Scholar]
- Enzonga Yoca, S., & Quinet, P. 2014, J. Phys. B At. Mol. Phys., 47, 035002 [Google Scholar]
- Enzonga Yoca, S., & Quinet, P. 2017, Atoms, 5, 28 [Google Scholar]
- Enzonga Yoca, S., Palmeri, P., Quinet, P., Jumet, G., & Biémont, É. 2012a, J. Phys. B At. Mol. Phys., 45, 035002 [Google Scholar]
- Enzonga Yoca, S., Quinet, P., & Biémont, É. 2012b, J. Phys. B At. Mol. Phys., 45, 035001 [Google Scholar]
- Enzonga Yoca, S., Quinet, P., Palmeri, P., & Biémont, É. 2012c, J. Phys. B At. Mol. Phys., 45, 065001 [Google Scholar]
- Epstein, G. L., & Reader, J. 1976, J. Opt. Soc. Am., 66, 590 [NASA ADS] [CrossRef] [Google Scholar]
- Epstein, G. L., & Reader, J. 1979, J. Opt. Soc. Am., 69, 511 [Google Scholar]
- Fermi, E. 1930, Z. Phys., 60, 320 [Google Scholar]
- Fernández-Menchero, L., Jeffery, C. S., Ramsbottom, C. A., & Ballance, C. P. 2020, MNRAS, 496, 2558 [Google Scholar]
- Fivet, V., Quinet, P., Biémont, E., & Xu, H.-L. 2006, J. Phys.: B At. Mol. Opt. Phys., 39 [Google Scholar]
- Fontaine, G., & Chayer, P. 1997, in The Third Conference on Faint Blue Stars, eds. A. G. D. Philip, J. Liebert, R. Saffer, & D. S. Hayes, 169 [Google Scholar]
- Fraga, S., & Saxena, K. 1976, Handbook of Atomic Data (Elsevier Amsterdam) [Google Scholar]
- Freytag, B., Ludwig, H.-G., & Steffen, M. 1996, A&A, 313, 497 [Google Scholar]
- Gautam, M. S., & Joshi, Y. N. 1972, Can. J. Phys., 50, 2059 [Google Scholar]
- Gayasov, R., Joshi, Y. N., Raassen, A. J. J., & Kaufman, V. 2000, Phys. Scr, 61, 164 [Google Scholar]
- Grevesse, N., Scott, P., Asplund, M., & Sauval, A. J. 2015, A&A, 573, A27 [CrossRef] [EDP Sciences] [Google Scholar]
- Groth, H. G., Kudritzki, R. P., & Heber, U. 1985, A&A, 152, 107 [NASA ADS] [Google Scholar]
- Gutmann, F. 1969, PhD thesis, University of British Columbia [Google Scholar]
- Hamdi, R., Ben Nessib, N., Dimitrijević, M. S., & Sahal-Bréchot, S. 2013, MNRAS, 431, 1039 [Google Scholar]
- Hampel, M., Stancliffe, R. J., Lugaro, M., & Meyer, B. S. 2016, ApJ, 831, 171 [Google Scholar]
- Han, Z., Podsiadlowski, P., Maxted, P. F. L., Marsh, T. R., & Ivanova, N. 2002, MNRAS, 336, 449 [Google Scholar]
- Haris, K., & Tauheed, A. 2012, Phys. Scr, 85, 055301 [Google Scholar]
- Heber, U. 2009, ARA&A, 47, 211 [Google Scholar]
- Heber, U. 2016, PASP, 128, 082001 [Google Scholar]
- Heber, U. 2024, arXiv e-prints [arXiv:2410.11663] [Google Scholar]
- Herwig, F., Pignatari, M., Woodward, P. R., et al. 2011, ApJ, 727, 89 [Google Scholar]
- Herwig, F., Woodward, P. R., Lin, P.-H., Knox, M., & Fryer, C. 2014, ApJ, 792, L3 [NASA ADS] [CrossRef] [Google Scholar]
- Holmbeck, E. M., Beers, T. C., Roederer, I. U., et al. 2018, ApJ, 859, L24 [NASA ADS] [CrossRef] [Google Scholar]
- Hu, H., Tout, C. A., Glebbeek, E., & Dupret, M. A. 2011, MNRAS, 418, 195 [NASA ADS] [CrossRef] [Google Scholar]
- Hubeny, I., & Lanz, T. 2017, arXiv e-prints [arXiv:1706.01859] [Google Scholar]
- Iben, Jr., I. 1976, ApJ, 208, 165 [NASA ADS] [CrossRef] [Google Scholar]
- Irrgang, A., Przybilla, N., Heber, U., et al. 2014, A&A, 565, A63 [NASA ADS] [CrossRef] [EDP Sciences] [Google Scholar]
- Jabeen, S., & Tauheed, A. 2015, J. Quant. Spec. Radiat. Transf., 154, 9 [Google Scholar]
- Jeffery, C. S., & Miszalski, B. 2019, MNRAS, 489, 1481 [Google Scholar]
- Jeffery, C. S., Ahmad, A., Naslim, N., & Kerzendorf, W. 2015, MNRAS, 446, 1889 [Google Scholar]
- Jeffery, C. S., Baran, A. S., Behara, N. T., et al. 2017, MNRAS, 465, 3101 [NASA ADS] [CrossRef] [Google Scholar]
- Johnson, W., Kolb, D., & Huang, K. 1983, At. Data Nucl. Data Tables, 28, 333 [Google Scholar]
- Jönsson, P., Verdebout, S., & Gaigalas, G. 2012, J. Phys. B At. Mol. Phys., 45, 165002 [Google Scholar]
- Jönsson, P., Gaigalas, G., Bieroń, J., Fischer, C. F., & Grant, I. P. 2013, Comput. Phys. Commun., 184, 2197 [CrossRef] [Google Scholar]
- Jorissen, A., Boffin, H. M. J., Karinkuzhi, D., et al. 2019, A&A, 626, A127 [NASA ADS] [CrossRef] [EDP Sciences] [Google Scholar]
- Joshi, Y. N., & Kleef, T. A. M. V. 1986, Can. J. Phys., 64, 330 [Google Scholar]
- Joshi, Y. N., & Raassen, A. J. J. 1990, Can. J. Phys., 68, 195 [Google Scholar]
- Joshi, Y. N., van Kleef, T. A. M. v., & Mazzoni, M. 1980, Can. J. Phys., 58, 737 [Google Scholar]
- Joshi, Y. N., Van Kleef, T. A. M., & Uylings, P. 1986, Phys. Lett. A, 113, 479 [Google Scholar]
- Joshi, Y. N., Raassen, A. J. J., & Valk, A. A. V. d. 1990, Can. J. Phys., 68, 284 [Google Scholar]
- Joshi, Y. N., Raassen, A. J. J., & Valk, A. A. V. d. 1990, Canadian Journal of Physics, 68, 284 [Google Scholar]
- Karaçoban Usta, B., & Eser, S. 2020a, Acta Phys. Polon. A, 137, 1187 [Google Scholar]
- Karaçoban Usta, B. & Eser, S. 2020b, Acta Phys. Polon. A, 137, S1 [Google Scholar]
- Karinkuzhi, D., Van Eck, S., Goriely, S., et al. 2021, A&A, 645, A61 [EDP Sciences] [Google Scholar]
- Kaufman, V., & Sugar, J. 1967, J. Res. Natl. Bur. Stand. (U.S.), Sect. A, 71, 583 [Google Scholar]
- Kaufman, V., & Sugar, J. 1978, J. Opt. Soc. Am., 68, 1529 [NASA ADS] [CrossRef] [Google Scholar]
- Kaur, M., Nakra, R., Arora, B., Li, C.-B., & Sahoo, B. K. 2020, J. Phys. B At. Mol. Phys., 53, 065002 [Google Scholar]
- Kelly, R. L. 1987, J. Phys. Chem. Ref. Data, 17 [Google Scholar]
- Kielkopf, J. F., & Crosswhite, H. M. 1970, J. Opt. Soc. Am., 60, 347 [Google Scholar]
- Kildiyarova, R. R., van der Valk, A. A., & Joshi, Y. N. 1995, Phys. Scr, 52, 522 [Google Scholar]
- Kildiyarova, R. R., Churilov, S. S., Joshi, Y. N., & Ryabtsev, A. N. 1996, Phys. Scr, 53, 454 [Google Scholar]
- Kitoviené, L., Gaigalas, G., Rynkun, P., Tanaka, M., & Kato, D. 2024, J. Phys. Chem. Ref. Data, 53, 033101 [Google Scholar]
- Klinkenberg, P., Van Kleef, T., & Noorman, P. 1961, Physica, 27, 1177 [Google Scholar]
- Kramida, A., Yu. Ralchenko, Reader, J., & NIST ASD Team 2024, NIST Atomic Spectra Database (ver. 5.12), [Online]. Available: https://physics.nist.gov/asd [2025, May 3]. National Institute of Standards and Technology, Gaithersburg, MD [Google Scholar]
- Krtička, J., Kubát, J., & Krtičková, I. 2016, A&A, 593, A101 [NASA ADS] [CrossRef] [EDP Sciences] [Google Scholar]
- Kurucz, R. L. 1993, SYNTHE spectrum synthesis programs and line data [Google Scholar]
- Kurucz, R. L. 1996, in Astronomical Society of the Pacific Conference Series, 108, M.A.S.S., Model Atmospheres and Spectrum Synthesis, eds. S. J. Adelman, F. Kupka, & W. W. Weiss, 160 [Google Scholar]
- Kurucz, R. L. 2018, in Astronomical Society of the Pacific Conference Series, 515, Workshop on Astrophysical Opacities, 47 [Google Scholar]
- Lang, R. J. 1928, Phys. Rev., 32, 737 [Google Scholar]
- Latour, M., Dorsch, M., & Heber, U. 2019, A&A, 629, A148 [NASA ADS] [CrossRef] [EDP Sciences] [Google Scholar]
- Löbling, L., Maney, M. A., Rauch, T., et al. 2020, MNRAS, 492, 528 [Google Scholar]
- Lodders, K. 2019, arXiv e-prints [arXiv:1912.00844] [Google Scholar]
- Loginov, A. V., & Tuchkin, V. I. 2001, Opt. Spectrosc., 91, 165 [Google Scholar]
- Lyall, K. R. 1965, PhD thesis, University of British Columbia [Google Scholar]
- Maison, L., Carvajal Gallego, H., & Quinet, P. 2022, Atoms, 10, 130 [CrossRef] [Google Scholar]
- Majlinger, Z., Simić, Z., & Dimitrijević, M. S. 2017, MNRAS, 470, 1911 [Google Scholar]
- Marcinek, R., & Migdalek, J. 1994, J. Phys. B At. Mol. Phys., 27, 5587 [Google Scholar]
- Martin, W. C., Zalubas, R., & Hagan, L. 1978, Atomic energy levels – The rareEarth elements [Google Scholar]
- Martinet, S., Choplin, A., Goriely, S., & Siess, L. 2024, A&A, 684, A8 [NASA ADS] [CrossRef] [EDP Sciences] [Google Scholar]
- Maxted, P. F. L., Heber, U., Marsh, T. R., & North, R. C. 2001, MNRAS, 326, 1391 [CrossRef] [Google Scholar]
- Meftah, A., Wyart, J.-F., Champion, N., & Tchang-Brillet, W.-Ü. L. 2007, Eur. Phys. J. D, 44, 35 [Google Scholar]
- Meftah, A., Wyart, J.-F., Sinzelle, J., et al. 2008, Phys. Scr, 77, 055302 [NASA ADS] [CrossRef] [Google Scholar]
- Meftah, A., Wyart, J.-F., Tchang-Brillet, W.-Ü. L., Blaess, C., & Champion, N. 2013, Phys. Scr, 88, 045305 [Google Scholar]
- Meijer, F. G., & Klinkenberg, P. F. A. 1973, Physica, 69, 111 [Google Scholar]
- Meijer, F. G., & Metsch, B. C. 1978, Physica B+C, 94, 259 [Google Scholar]
- Merrill, P. W. 1952, ApJ, 116, 21 [NASA ADS] [CrossRef] [Google Scholar]
- Meurer, A., Smith, C. P., Paprocki, M., et al. 2017, PeerJ Comput. Sci., 3, e103 [CrossRef] [Google Scholar]
- Michaud, G., Richer, J., & Richard, O. 2008, ApJ, 675, 1223 [NASA ADS] [CrossRef] [Google Scholar]
- Michaud, G., Richer, J., & Richard, O. 2011, A&A, 529, A60 [NASA ADS] [CrossRef] [EDP Sciences] [Google Scholar]
- Michaud, G., Alecian, G., & Richer, J. 2015, Atomic Diffusion in Stars [Google Scholar]
- Migdalek, J., & Siegel, W. 2014, J. Phys. B At. Mol. Phys., 47, 075003 [Google Scholar]
- Miller Bertolami, M. M., Althaus, L. G., Unglaub, K., & Weiss, A. 2008, A&A, 491, 253 [NASA ADS] [CrossRef] [EDP Sciences] [Google Scholar]
- Miller Bertolami, M. M., Battich, T., Córsico, A. H., Althaus, L. G., & Wachlin, F. C. 2022, MNRAS, 511, L60 [NASA ADS] [CrossRef] [Google Scholar]
- Morton, D. C. 2000, ApJS, 130, 403 [Google Scholar]
- Motoumba, E. B., Yoca, S. E., Quinet, P., & Palmeri, P. 2020, At. Data Nucl. Data Tables, 133, 101340 [Google Scholar]
- Naslim, N., Jeffery, C. S., Behara, N. T., & Hibbert, A. 2011, MNRAS, 412, 363 [CrossRef] [Google Scholar]
- Naslim, N., Jeffery, C. S., Hibbert, A., & Behara, N. T. 2013, MNRAS, 434, 1920 [NASA ADS] [CrossRef] [Google Scholar]
- Naslim, N., Jeffery, C. S., & Woolf, V. M. 2020, MNRAS, 491, 874 [Google Scholar]
- Németh, P. 2017, Open Astron., 26, 280 [NASA ADS] [Google Scholar]
- Németh, P., Vos, J., Molina, F., & Bastian, A. 2021, A&A, 653, A3 [Google Scholar]
- Nielsen, K. E., Wahlgren, G. M., Proffitt, C. R., Leckrone, D. S., & Adelman, S. J. 2005, AJ, 130, 2312 [Google Scholar]
- Østensen, R. H., Jeffery, C. S., Saio, H., et al. 2020, MNRAS, 499, 3738 [Google Scholar]
- O’Sullivan, G. 1989, J. Phys. B At. Mol. Phys., 22, 987 [Google Scholar]
- O’Toole, S. J., & Heber, U. 2006, A&A, 452, 579 [CrossRef] [EDP Sciences] [Google Scholar]
- O’Toole, S. J., & Heber, U. 2007, in Astronomical Society of the Pacific Conference Series, 372, 15th European Workshop on White Dwarfs, eds. R. Napiwotzki, & M. R. Burleigh, 209 [Google Scholar]
- Persson, W., & Pettersson, S.-G. 1984, Phys. Scr, 29, 308 [Google Scholar]
- Persson, W., & Wahlström, C.-G. 1985, Phys. Scr, 31, 487 [Google Scholar]
- Pinnington, E. H., Bahr, J. L., Kernahan, J. A., & Irwin, D. J. G. 1981, J. Phys. B: At. Mol. Phys., 14, 1291 [Google Scholar]
- Pinnington, E. H., Ansbacher, W., Kernahan, J. A., Gosselin, R. N., & Bahr, J. L. 1985, J. Opt. Soc. Am. B Opt. Phys., 2, 1653 [Google Scholar]
- Quinet, P., & Biémont, E. 2004, At. Data Nuclear Data Tables, 87, 207 [Google Scholar]
- Quinet, P., & Palmeri, P. 2020, Atoms, 8, 18 [Google Scholar]
- Quinet, P., Palmeri, P., Biémont, E., et al. 1999, MNRAS, 307, 934 [NASA ADS] [CrossRef] [Google Scholar]
- Quinet, P., Palmeri, P., Biémont, E., et al. 2002, J. Alloys Compounds, 344, 255 [CrossRef] [Google Scholar]
- Raassen, A. J. J., & Joshi, Y. N. 1991, J. Phys. B At. Mol. Phys., 24, 921 [Google Scholar]
- Raassen, A. J. J., Uylings, P. H. M., Joshi, Y. N., & Wyart, J.-F. 1994, Phys. Scr, 49, 682 [Google Scholar]
- Radžiūtė, L., & Gaigalas, G. 2022, At. Data Nucl. Data Tables, 147, 101515 [Google Scholar]
- Raineri, M., Reyna Almandos, J. G., Bredice, F., et al. 1998, J. Quant. Spec. Radiat. Transf., 60, 25 [Google Scholar]
- Rana, T., Tauheed, A., Tauheed, A., & Joshi, Y. N. 2001, Phys. Scr, 63, 108 [Google Scholar]
- Randall, S. K., Bagnulo, S., Ziegerer, E., Geier, S., & Fontaine, G. 2015, A&A, 576, A65 [NASA ADS] [CrossRef] [EDP Sciences] [Google Scholar]
- Rao, K. R., Badami, J. S., & Fowler, A. 1931, Proc. Roy. Soc. Lond. Ser. A, 131, 154 [Google Scholar]
- Rashid, A., & Tauheed, A. 2021, J. Quant. Spec. Radiat. Transf., 270, 107668 [Google Scholar]
- Rauch, T., Werner, K., Biémont, É., Quinet, P., & Kruk, J. W. 2012, A&A, 546, A55 [NASA ADS] [CrossRef] [EDP Sciences] [Google Scholar]
- Rauch, T., Werner, K., Quinet, P., & Kruk, J. W. 2014, A&A, 566, A10 [Google Scholar]
- Rauch, T., Quinet, P., Hoyer, D., et al. 2015, Tuebingen Oscillator Strengths Service Form Interface, VO resource provided by the GAVO Data Center [Google Scholar]
- Rauch, T., Werner, K., Quinet, P., & Kruk, J. W. 2015, A&A, 577, A6 [Google Scholar]
- Rauch, T., Quinet, P., Hoyer, D., et al. 2016a, A&A, 587, A39 [NASA ADS] [CrossRef] [EDP Sciences] [Google Scholar]
- Rauch, T., Quinet, P., Hoyer, D., et al. 2016b, A&A, 590, A128 [NASA ADS] [CrossRef] [EDP Sciences] [Google Scholar]
- Rauch, T., Gamrath, S., Quinet, P., et al. 2017a, A&A, 599, A142 [NASA ADS] [CrossRef] [EDP Sciences] [Google Scholar]
- Rauch, T., Quinet, P., Knörzer, M., et al. 2017b, A&A, 606, A105 [NASA ADS] [CrossRef] [EDP Sciences] [Google Scholar]
- Rauch, T., Gamrath, S., Quinet, P., et al. 2020, A&A, 637, A4 [EDP Sciences] [Google Scholar]
- Reader, J. 1983, J. Opt. Soc. Am., 73, 349 [Google Scholar]
- Reader, J. 2016, Atoms, 4, 31 [Google Scholar]
- Reader, J., & Acquista, N. 1997, Phys. Scr, 55, 310 [Google Scholar]
- Reader, J., & Epstein, G. L. 1972, J. Opt. Soc. Am., 62, 1467 [Google Scholar]
- Reader, J., & Wyart, J.-F. 2009, Phys. Rev. A, 80, 042517 [NASA ADS] [CrossRef] [Google Scholar]
- Riyaz, A., Rahimullah, K., & Tauheed, A. 2014a, J. Quant. Spec. Radiat. Transf., 133, 624 [Google Scholar]
- Riyaz, A., Tauheed, A., & Rahimullah, K. 2014b, J. Quant. Spec. Radiat. Transf., 147, 86 [Google Scholar]
- Roederer, I. U., Cowan, J. J., Karakas, A. I., et al. 2010, ApJ, 724, 975 [NASA ADS] [CrossRef] [Google Scholar]
- Roy, S., Dutta, N. N., & Majumder, S. 2014, Phys. Rev. A, 89, 042511 [Google Scholar]
- Ryabtsev, A. N., Litzén, U., & Isberg, B. 1993, Phys. Scr, 48, 326 [Google Scholar]
- Ryabtsev, A. N., Raassen, A. J. J., Tchang-Brillet, W. Ü., et al. 1998, Phys. Scr, 57, 82 [Google Scholar]
- Sahal-Bréchot, S., Dimitrijević, M.S., & Moreau N. 2025, STARK-B database, [online]. Available: http://stark-b.obspm.fr [2025, May 6]. Observatory of Paris, LERMA and Astronomical Observatory of Belgrade [Google Scholar]
- Saio, H., & Jeffery, C. S. 2000, MNRAS, 313, 671 [NASA ADS] [CrossRef] [Google Scholar]
- Saio, H., & Jeffery, C. S. 2019, MNRAS, 482, 758 [NASA ADS] [CrossRef] [Google Scholar]
- Schaffenroth, V., Casewell, S. L., Schneider, D., et al. 2021, MNRAS, 501, 3847 [Google Scholar]
- Scott, L. J. A., Jeffery, C. S., Byrne, C. M., & Dorsch, M. 2024, MNRAS, 530, 2039 [Google Scholar]
- Sharma, M. K., Rahimullah, K., & Tauheed, A. 2014, J. Quant. Spec. Radiat. Transf., 147, 102 [Google Scholar]
- Sharpee, B., Zhang, Y., Williams, R., et al. 2007, ApJ, 659, 1265 [NASA ADS] [CrossRef] [Google Scholar]
- Shetye, S., Van Eck, S., Goriely, S., et al. 2020, A&A, 635, L6 [NASA ADS] [CrossRef] [EDP Sciences] [Google Scholar]
- Spector, N., & Sugar, J. 1976, J. Opt. Soc. Am., 66, 436 [Google Scholar]
- Stark, M. A., & Wade, R. A. 2003, AJ, 126, 1455 [NASA ADS] [CrossRef] [Google Scholar]
- Stroeer, A., Heber, U., Lisker, T., et al. 2007, A&A, 462, 269 [NASA ADS] [CrossRef] [EDP Sciences] [Google Scholar]
- Sugar, J., & Kaufman, V. 1972, J. Opt. Soc. Am., 62, 562 [Google Scholar]
- Sugar, J., & Kaufman, V. 1974, J. Opt. Soc. Am., 64, 1656 [NASA ADS] [CrossRef] [Google Scholar]
- Sugar, J., & Kaufman, V. 1975, Phys. Rev. C, 12, 1336 [Google Scholar]
- Taghadomi, Z. S., Wan, Y., Flowers, A., et al. 2022, Atoms, 10, 94 [Google Scholar]
- Tauheed, A., & Reader, J. 2005, Phys. Scr, 72, 158 [Google Scholar]
- Tauheed, A., & Hala. 2012, Phys. Scr, 85, 025304 [Google Scholar]
- Tauheed, A., & Rashid, A. 2021, J. Quant. Spec. Radiat. Transf., 261, 107435 [Google Scholar]
- Tauheed, A., Joshi, Y. N., & Kaufman, V. 1991, J. Phys. B At. Mol. Phys., 24, 3701 [Google Scholar]
- Tauheed, A., Joshi, Y. N., & Pinnington, E. H. 1992, J. Phys. B At. Mol. Phys., 25, L561 [Google Scholar]
- Tauheed, A., Joshi, Y. N., & Pinnington, E. H. 1998, J. Phys. B At. Mol. Phys., 31, 393 [Google Scholar]
- Tauheed, A., Joshi, Y. N., & Zafaran, A. F. 2000, Phys. Scr, 62, 316 [Google Scholar]
- Unglaub, K. 2008, A&A, 486, 923 [NASA ADS] [CrossRef] [EDP Sciences] [Google Scholar]
- Unglaub, K. 2010, in American Institute of Physics Conference Series, 1273, 17th European White Dwarf Workshop, eds. K. Werner, & T. Rauch, 251 [Google Scholar]
- Unglaub, K., & Bues, I. 2001, A&A, 374, 570 [NASA ADS] [CrossRef] [EDP Sciences] [Google Scholar]
- van der Valk, A. A., Raassen, A. J. J., & Joshi, Y. N. 1990, J. Opt. Soc. Am. B Opt. Phys., 7, 1182 [Google Scholar]
- van Hoof, P. A. M. 2018, Galaxies, 6, 63 [NASA ADS] [CrossRef] [Google Scholar]
- van Kleef, T. A. M., & Joshi, Y. N. 1982, Phys. B+C, 114, 117 [Google Scholar]
- Varshney, S., & Tauheed, A. 2013, J. Quant. Spec. Radiat. Transf., 129, 31 [Google Scholar]
- Varshney, S., & Tauheed, A. 2016, J. Quant. Spec. Radiat. Transf., 168, 102 [Google Scholar]
- Varshney, S., & Tauheed, A. 2017, Atoms, 5, 23 [Google Scholar]
- Wahlgren, G. M., Brage, T., Brandt, J. C., et al. 2001, ApJ, 551, 520 [Google Scholar]
- Wajid, A., Tauheed, A., & Jabeen, S. 2021, J. Quant. Spec. Radiat. Transf., 258, 107387 [Google Scholar]
- Werner, K., Rauch, T., Ringat, E., & Kruk, J. W. 2012, ApJ, 753, L7 [Google Scholar]
- Werner, K., Rauch, T., Kučas, S., & Kruk, J. W. 2015, A&A, 574, A29 [NASA ADS] [CrossRef] [EDP Sciences] [Google Scholar]
- Werner, K., Rauch, T., Knörzer, M., & Kruk, J. W. 2018, A&A, 614, A96 [NASA ADS] [CrossRef] [EDP Sciences] [Google Scholar]
- Wiedeking, M., Goriely, S., Guttormsen, M., et al. 2025, Nat. Rev. Phys., 7, 696 [Google Scholar]
- Wigner, E. P. 1931, Gruppentheorie und ihre Anwendung auf die Quantenmechanik der Atomspektren, Die Wissenschaft: Einzeldarstellungen aus der Naturwissenschaft und der Technik (Braunschweig: F. Vieweg & Sohn) [Google Scholar]
- Wu, C.-M. 1967, PhD thesis, University of British Columbia [Google Scholar]
- Wyart, J.-F., Raassen, A. J. J., Joshi, Y. N., & Uylings, P. H. M. 1992, J. Phys. II, 2, 895 [Google Scholar]
- Wyart, J. F., Raassen, A. J. J., van het Hof, G. J., & Joshi, Y. N. 1993, Phys. Scr, 47, 784 [Google Scholar]
- Wyart, J.-F., Tchang-Brillet, W.-Ü. L., Spector, N., et al. 2001, Phys. Scr, 63, 113 [Google Scholar]
- Wyart, J.-F., Meftah, A., Tchang-Brillet, W.-Ü. L., et al. 2007, J. Phys. B At. Mol. Phys., 40, 3957 [Google Scholar]
- Yu, J., Zhang, X., & Lü, G. 2021, MNRAS, 504, 2670 [NASA ADS] [CrossRef] [Google Scholar]
- Zainab, A., & Tauheed, A. 2019, J. Quant. Spec. Radiat. Transf., 237, 106614 [Google Scholar]
- Zainab, A., Haris, K., Gamrath, S., Quinet, P., & Tauheed, A. 2023, ApJS, 267, 12 [NASA ADS] [CrossRef] [Google Scholar]
- Zhang, X., & Jeffery, C. S. 2012, MNRAS, 419, 452 [NASA ADS] [CrossRef] [Google Scholar]
- Zhang, W., Palmeri, P., & Quinet, P. 2014, Eur. Phys. J. D, 68, 104 [Google Scholar]
Except for Pm, which is radioactive and has only short-lived isotopes.
An exception might be the unpublished dissertation by Elias (1972), which is not accessible to us.
Battich et al. (2025) did not consider α-enhancement.
The connection between neutron capture and phosphorus enrichment has also been made for cool stars by Brauner et al. (2024). Silicon depletion by weak selective winds (Unglaub 2008) is negligible here because both hot subdwarfs are compact at log g ≈ 5.8.
This scenario is motivated largely by the rich pulsation spectrum of LS IV–14°116, which seems to require C/O enrichment in its envelope (Saio & Jeffery 2019).
Diffusion-only models fail to reproduce the observed helium abundances in sdB stars, implying the presence of additional atmospheric mixing processes, such as radiatively driven stellar winds (e.g. Fontaine & Chayer 1997) or an as-yet unidentified form of turbulence (Hu et al. 2011; Michaud et al. 2011).
Neither star shows signatures of a metallic wind, such as the C or Si depletions seen in some He-poor sdOBs (O’Toole & Heber 2006).
Given the lower abundances of very heavy elements in LS IV–14°116, the i-process in this star may have operated for a shorter duration, but with more efficient transport of processed material to the surface.
Note that not all lead-rich heavy-metal hot subdwarfs are found in binary systems like EC 22536–5304, meaning that mergers may be able to produce similar surface compositions.
The electric quadrupole term (B constant) can be neglected because it is typically two orders of magnitude smaller than the magnetic dipole term and vanishes entirely for states with J = 1/2.
Appendix A Additional material
A.1 Atomic structure models
Atomic models for As III, Se III, Hf IV, and Tl IV.
A.2 Hyperfine structure
The UV spectra of LS IV–14°116 and EC 22536–5304 feature strong resonance lines originating from low-lying states of heavy ions. Ground states, particularly s-configurations, exhibit large magnetic dipole hyperfine constants (A) due to substantial electron density at the nucleus. For isotopes with non-zero nuclear spin I, this can result in significant hyperfine splitting (HFS) of spectral lines involving these ground or low-lying s-states. In earlier UV studies of hot subdwarfs, HFS was considered only for the Pb IV 1313 Å resonance line, in attempts to constrain the 207Pb/208Pb isotopic ratio (O’Toole & Heber 2007); this is feasible because 207Pb exhibits a substantial HFS-induced triplet split. Beyond such wavelength shifts, HFS also increases line equivalent widths making it important to account for in abundance analyses.
Non-LTE model atoms used in the TLUSTY atmospheres for LS IV–14°116 and EC 22536–5304.
To model this splitting, we redistribute the original fine-structure line strength among the hyperfine components using Wigner 6j symbols (Wigner 1931), as implemented in SymPy (Meurer et al. 2017). In cases where experimentally measured wavelengths of the split components are not available, the hyperfine A constants of the lower and upper levels were adjusted to reproduce the observed line splits. As first described by Fermi (1930), the hyperfine energy16 due to the magnetic dipole interaction is Ehfs = K · (A/2), where K = F(F + 1) − I(I + 1) − J(J + 1) is the coupling strength between the nuclear spin I and electronic angular momentum J, and F is the total atomic angular momentum quantum number, ranging from I + J to |I − J|. This implies that significant HFS splits require at least three conditions to be met: J > 0, I > 0, and a significant hyperfine constant A, which is particularly large for low-lying s-orbital states. Even-Z, even-neutron isotopes have I = 0 due to nucleon pairing and thus exhibit no HFS.
A.3 Unidentified lines
Although many lines in EC 22536–5304 are attributable to heavy-metal transitions, nearly 200 remain unidentified. Because the LS IV–14°116 spectrum is more crowded and likely contaminated by unclassified iron-group lines, we restrict our analysis to unidentified features detected in EC 22536–5304. Given its low iron abundance, these are strong candidates for heavy-metal transitions, including unclassified lines of known ions or transitions from yet unidentified species. Some broader features may instead arise from very high-lying C III transitions, which are prominent in EC 22536–5304. A list of unidentified lines with equivalent widths greater than 5 mÅ is provided in Table A.7, measured from Gaussian fits to the normalised spectrum. Lines are classified as sharp (s) or broad (b).
Abundances of LS IV–14°116 and EC 22536–5304, stated as mass- and number fraction, and relative to solar.
Availability of atomic data and detection by ionisation stage in EC 22536–5304 and LS IV–14°116.
Se IV lines identified in LS IV–14°116.
Strongest detected lead lines in EC 22536–5304.
Positions, equivalent widths, FWHM, and line types for unidentified lines in the STIS spectrum of EC 22536–5304.
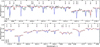 |
Fig. A.1 Strongest As III and Se III lines in the UVES spectrum of LS IV–14°116. |
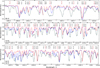 |
Fig. A.2 Possible identifications of As IV, Se IV, and Rb IV lines in the UV spectrum of LS IV–14°116, lacking oscillator strengths. |
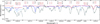 |
Fig. A.3 Tl V line identifications in EC 22536–5304, all of which lack oscillator strengths. |
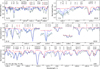 |
Fig. A.4 Strongest Sr, Y, and Zr lines in EC 22536–5304, and Ce, Hf, W, Hg, Tl, and Pb in LS IV–14°116. |
All Tables
Non-LTE model atoms used in the TLUSTY atmospheres for LS IV–14°116 and EC 22536–5304.
Abundances of LS IV–14°116 and EC 22536–5304, stated as mass- and number fraction, and relative to solar.
Availability of atomic data and detection by ionisation stage in EC 22536–5304 and LS IV–14°116.
Positions, equivalent widths, FWHM, and line types for unidentified lines in the STIS spectrum of EC 22536–5304.
All Figures
|
Fig. 1 Strongest Ga, Ge, Se, Kr, Sr, Y, and Zr lines in the STIS/E140M spectrum of LS IV–14°116 (grey), compared to our best model with (blue) and without (red) heavy metals (Z > 30). The light blue model further includes interstellar absorption. |
| In the text | |
|
Fig. 2 Top: strongest As III-IV lines in LS IV–14°116, with available oscillator strengths (see Fig. A.2 for As IV lines without). Bottom: similar, but for Br IV; we also note Hg IV 1158.191 Å (see Fig. 1 for line definitions). |
| In the text | |
|
Fig. 3 Nb (Z = 41), Mo (42), Pd (46), Cd (48), In (49), Sn (50), Te (52), I (53), and Xe (54) lines in LS IV–14°116 (cf. Fig. 1). |
| In the text | |
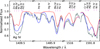 |
Fig. 4 Possible detection of Ag IV in LS IV–14°116 (cf. Fig. 1). |
| In the text | |
|
Fig. 5 Top: HFS splitting of Sb V 1226 Å in HD 127493, EC 22536–5304, and LS IV–14°116. Split component wavelengths are indicated. The HFS splits are clearly resolved in HD 127493 because it was observed at R = 114 000. Bottom: strongest Sb IV lines in LS IV–14°116 (cf. Fig. 1). |
| In the text | |
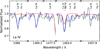 |
Fig. 6 Strongest La IV lines in EC 22536–5304 (cf. Fig. 1). |
| In the text | |
|
Fig. 7 Ce (Z = 58), Pr (59), Nd (60), Er (68), Yb (70), Lu (71), Hf (72), W (74), and Os (76) lines in EC 22536–5304 (cf. Fig. 1). |
| In the text | |
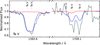 |
Fig. 8 HFS-split Ta V lines in EC 22536–5304, similar to Fig. 1. |
| In the text | |
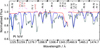 |
Fig. 9 Strong platinum lines in EC 22536–5304 (cf. Fig. 1). |
| In the text | |
|
Fig. 10 Strongest Hg IV-V, Tl IV, Pb III–VI, and Bi III-V lines, next to Sn IV, in the STIS spectrum of EC 22536–5304 (cf. Fig. 1). |
| In the text | |
|
Fig. 11 Top: surface abundances of EC 22536–5304 and LS IV–14°116 by number, compared to the solar pattern of Asplund et al. (2009), supplemented with heavy-metal results from Grevesse et al. (2015), Lodders (2019), and Asplund et al. (2021). Middle: abundances relative to solar. Bottom: solar relative abundances, scaled to the same Fe abundance. Also shown are two models from Battich et al. (2025) with initial metallicity [Fe/H] = −1.15 and envelope masses of 0.00055 M⊙ (001-4) and 0.0006 M⊙ (001-5). |
| In the text | |
|
Fig. 12 Convection test for LS IV–14°116 (red) and EC 22536–5304 (blue). Top: adiabatic gradients (solid), computed following Groth et al. (1985), compared with the TLUSTY model gradients (dashed); shaded regions indicate layers unstable according to the Schwarzschild criterion. Bottom: UV line formation depths in EC 22536–5304; the strongest lines arise from C III-IV, while most others are due to heavy metals. |
| In the text | |
|
Fig. A.1 Strongest As III and Se III lines in the UVES spectrum of LS IV–14°116. |
| In the text | |
|
Fig. A.2 Possible identifications of As IV, Se IV, and Rb IV lines in the UV spectrum of LS IV–14°116, lacking oscillator strengths. |
| In the text | |
|
Fig. A.3 Tl V line identifications in EC 22536–5304, all of which lack oscillator strengths. |
| In the text | |
|
Fig. A.4 Strongest Sr, Y, and Zr lines in EC 22536–5304, and Ce, Hf, W, Hg, Tl, and Pb in LS IV–14°116. |
| In the text | |
Current usage metrics show cumulative count of Article Views (full-text article views including HTML views, PDF and ePub downloads, according to the available data) and Abstracts Views on Vision4Press platform.
Data correspond to usage on the plateform after 2015. The current usage metrics is available 48-96 hours after online publication and is updated daily on week days.
Initial download of the metrics may take a while.