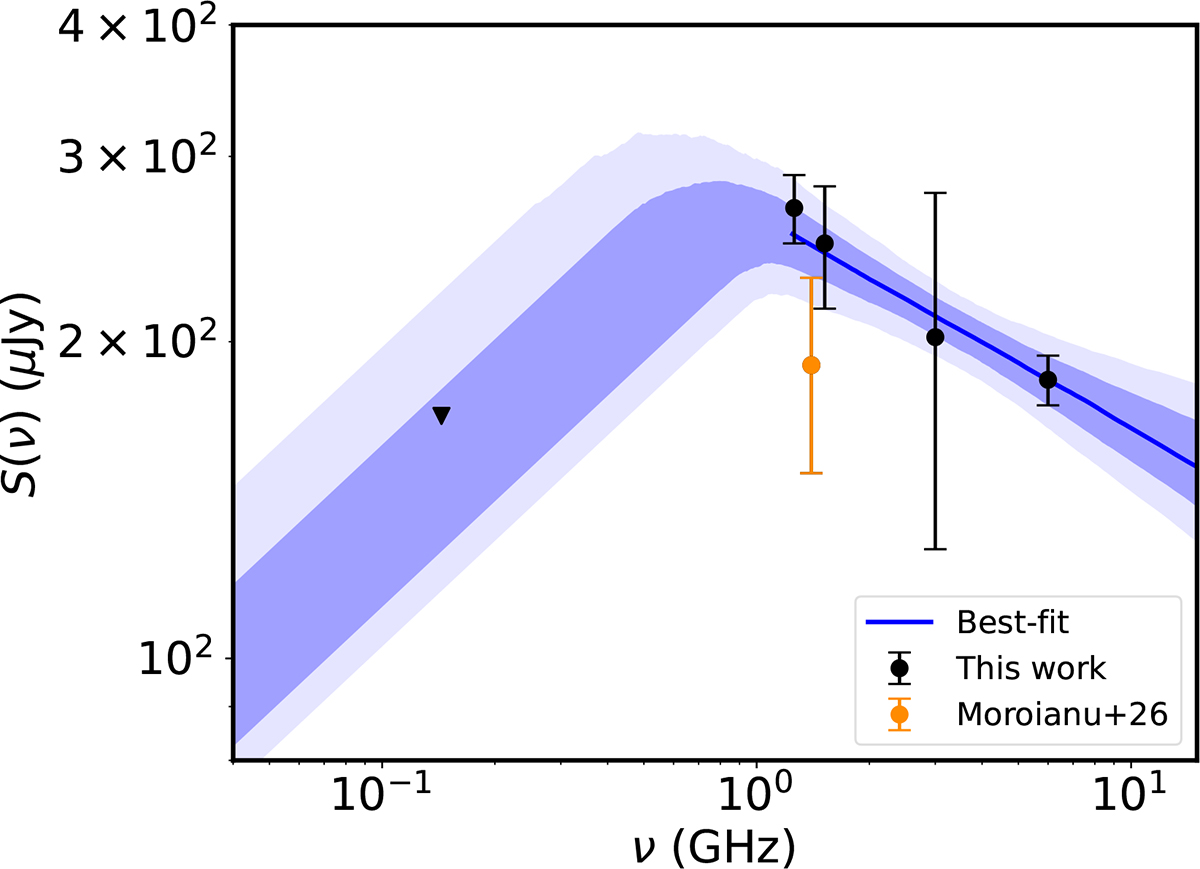
Fig. 2.
Download original image
Radio spectrum of the PRS. The flux densities (dots) and upper limit (triangle) were fitted with a broken power law (Eq. (1)) through the MCMC method. The shaded regions indicate the 68% (dark) and 95% (light) confidence levels. The posterior probability distributions of the fitted parameters (νto, S3, α) are shown in Fig. B.1.
Current usage metrics show cumulative count of Article Views (full-text article views including HTML views, PDF and ePub downloads, according to the available data) and Abstracts Views on Vision4Press platform.
Data correspond to usage on the plateform after 2015. The current usage metrics is available 48-96 hours after online publication and is updated daily on week days.
Initial download of the metrics may take a while.