


| Issue |
A&A
Volume 710, June 2026
|
|
|---|---|---|
| Article Number | L31 | |
| Number of page(s) | 6 | |
| Section | Letters to the Editor | |
| DOI | https://doi.org/10.1051/0004-6361/202660228 | |
| Published online | 23 June 2026 | |
Letter to the Editor
Milliarcsecond-scale spectrum of the persistent radio source associated with FRB 20190417A and constraints for FRB 20181030A
1
INAF – Istituto di Astrofisica e Planetologia Spaziali, via Fosso del Cavaliere 100, 00133 Rome, Italy
2
South-Western Institute for Astronomy Research, Yunnan University, Kunming, China
3
INAF – Osservatorio di Astrofisica e Scienza dello Spazio di Bologna, via Piero Gobetti 93/3, I-40129 Bologna, Italy
4
Dipartimento di Fisica, Universitá della Calabria, Arcavacata di Rende, Italy
5
Laboratori Nazionali di Frascati, INFN (Istituto Nazionale di Fisica Nucleare), Frascati, Italy
6
The Hong Kong Institute for Astronomy and Astrophysics, The University of Hong Kong, Pokfulam Road, Hong Kong, People’s Republic of China
7
Department of Physics, the University of Hong Kong, Pokfulam Road, Hong Kong, People’s Republic of China
8
Nevada Center for Astrophysics, University of Nevada, Las Vegas, NV, USA
9
Department of Physics and Astronomy, University of Nevada, Las Vegas, NV, USA
★ Corresponding author: This email address is being protected from spambots. You need JavaScript enabled to view it.
Received:
3
April
2026
Accepted:
3
June
2026
Abstract
Aims. We confirm the compact nature and constrain the radio spectra of candidate persistent radio sources (PRSs) associated with repeating fast radio bursts (FRBs), and we increase the number of PRSs with spectral indices measured using very long baseline interferometry (VLBI).
Methods. We performed observations with the European VLBI Network (EVN) at 5 and 8 GHz targeting two candidate PRSs that were identified in a recent VLA survey of repeating FRBs. We measured the flux densities and upper limits at milliarcsecond resolution and combined them with published data at lower frequencies to derive spectral constraints.
Results. We detect a compact source associated with FRB 20190417A at 5 GHz with a flux density of 150 ± 45 μJy, but no detection is obtained at 8 GHz. The source is unresolved on milliarcsecond scales, implying a projected physical size ≲15 pc and a brightness temperature Tb > 3.8 × 10⁵ K, confirming its non-thermal nature. The combination of our measurement with the 1.4 GHz VLBI data yields a spectral index α = −0.19 ± 0.29, consistent with a nearly flat spectrum. This makes FRB 20190417A only the second PRS with a spectral index constrained using VLBI data. The inferred luminosity places the source on the proposed Lν–|RM| relation. When this source is included, the scatter is σΔ = 0.67, corresponding to α̂|ϵ| ∼ 1.5. This value is roughly consistent with scenarios involving forward shocks in the free-expansion phase or young pulsar wind nebulae. For the candidate PRS associated with FRB 20181030A, we report 5σ upper limits of 80 μJy at 5 GHz and 150 μJy at 8 GHz, corresponding to L5 GHz ≲ 3.8 × 1025 erg s−1 Hz−1, and implying a steep spectral index (α ≲ −1.2) if the VLA emission arises from a compact component.
Conclusions. Our results highlight the importance of VLBI in isolating compact emission from FRB engines, and they provide one of the few spectral constraints for PRSs at milliarcsecond resolution. The consistency of FRB 20190417A with the Lν–|RM| relation supports a nebular origin for the persistent emission.
Key words: stars: magnetars
© The Authors 2026
 Open Access article, published by EDP Sciences, under the terms of the Creative Commons Attribution License (https://creativecommons.org/licenses/by/4.0), which permits unrestricted use, distribution, and reproduction in any medium, provided the original work is properly cited.
This article is published in open access under the Subscribe to Open model. This email address is being protected from spambots. You need JavaScript enabled to view it. to support open access publication.
1. Introduction
Fast radio bursts (FRBs) are bright millisecond-duration sources of extragalactic origin that have only been observed at radio wavelengths so far. The vast majority are singular events, and only a small fraction (∼2.5%) are currently observed to repeat (The CHIME/FRB Collaboration 2026). It is plausible that repetition is a common property that is often below current detection thresholds (Kirsten et al. 2024). Despite the large number of detections and extensive multi-wavelength follow-up campaigns, counterparts at other wavelengths remain elusive, with the notable exception of a Galactic magnetar (Bochenek et al. 2020). This observational landscape still accommodates a wide range of progenitor models.
Magnetars can reproduce many of the observed properties of FRBs (Zhang 2020), and they are among the leading candidates for their central engines. However, magnetars themselves can arise from different evolutionary channels, including core-collapse supernovae and compact binary mergers (Margalit et al. 2019; Niu et al. 2022). FRB 20200120E, located in a globular cluster (Kirsten et al. 2022), provides a possible example of the compact binary merger channel. These different formation pathways are expected to imprint distinct signatures on the host galaxies and local environments, but the current sample remains too limited to draw firm conclusions.
Significant progress has been achieved by probing FRB environments across multiple wavelengths and spatial scales. High-resolution radio interferometry, combined with optical/IR spectroscopy and X-ray observations, has enabled the identification and characterisation of host galaxies and star-forming regions down to sub-arcsecond scales (Tendulkar et al. 2017; Bhandari et al. 2020; Piro et al. 2021; Bhandari et al. 2022; Bruni et al. 2024). In a few remarkable cases, these efforts have also revealed compact persistent radio sources (PRSs) that are spatially coincident with the FRB position, such as in FRB 20121102A (Chatterjee et al. 2017; Marcote et al. 2017), FRB 20190520B (Niu et al. 2022), FRB 20201124A (Bruni et al. 2024), and more recently, FRB 20240114A (Bruni et al. 2025). In addition, VLBI follow-up observations have recently confirmed the compact nature of one of the candidate PRSs identified by Ibik et al. (2024), further supporting its association with the FRB 20190417A (Moroianu et al. 2026).
The presence of a compact PRS provides a unique probe of the immediate environment of the FRB central engine. In the magnetar scenario, this emission can arise from a magnetised nebula powered by continuous energy injection (Murase et al. 2016; Margalit & Metzger 2018). The large Faraday rotation measures (|RM|) observed in some FRBs indicate dense and highly magnetised surroundings, motivating a relation between the radio luminosity of the PRS and the |RM| (Yang et al. 2020, 2022). This relation has been reinforced by the discovery of the PRS associated with FRB 20201124A, which extended the explored parameter space by some orders of magnitude (Bruni et al. 2024).
A recent systematic survey with the Karl G. Jansky Very Large Array (VLA) of 37 repeating fast radio bursts (FRBs) discovered by the Canadian Hydrogen Intensity Mapping Experiment (CHIME) has identified two candidate PRSs consistent with the FRB positions (Ibik et al. 2024). The two sources lie in the region of the radio luminosity versus |RM| plane expected for magnetised nebulae, providing further support to the proposed correlation. However, due to the limited angular resolution of the VLA observations, contamination from star formation within the host galaxies cannot be excluded, leaving the nature of these sources uncertain.
Observations with very long baseline interferometry (VLBI) are crucial to confirm the compactness and association of these candidates with the FRB engine. Recently, one of the candidates reported by Ibik et al. (2024) has been followed up with the European VLBI Network (EVN), leading to the detection of a compact source at milliarcsecond scales (Moroianu et al. 2026). This result strongly supports the identification of this source as a genuine PRS and highlights the key role of VLBI in isolating the nuclear component from host galaxy emission. Further details on the optical photometric and spectroscopic properties of the host galaxies of FRB 20190417A and FRB 20181030A are presented in Moroianu et al. (2026) and Bhardwaj et al. (2021).
However, robust spectral information for PRSs at milliarcsecond resolution remains extremely scarce. To date, only the radio spectrum of the PRS associated with FRB 20121102A is constrained using VLBI data. Recent VLBI detections of candidate PRSs (Moroianu et al. 2026) have confirmed their compact nature, but lack the multi-frequency coverage required to derive a reliable spectral index.
In this Letter, we present EVN follow-up observations at 5 and 8 GHz of the two candidate persistent radio sources reported by Ibik et al. (2024), 20190417A-S1 and 20181030A-S1, with the goal of confirming their compact nature and constraining their radio spectra. We adopted a flat ΛCDM cosmology with H0 = 67.36 km s−1 Mpc−1, Ωm = 0.315, and ΩΛ = 0.685 (Planck Collaboration VI 2020).
2. Results
Details on observations, on the detection of 20190417A-S1, and on the non-detection of 20181030A-S1 and its implications, are given in the Appendices B and C, respectively. Here, we focus on the spectral properties of 20190417A-S1.
We compared our EVN integrated flux density at 5 GHz (S5 GHz = 150 ± 45 μJy) with the flux density at 1.4 GHz reported by Moroianu et al. (2026, S1.4 GHz = 191 ± 39 μJy). Assuming a power-law spectrum Sν ∝ να, we obtained α5/1.4 GHz = −0.19 ± 0.29, where the uncertainty was derived by propagating the fractional flux errors. This value indicates that the spectrum is approximately flat or only mildly declined between 1.4 and 5 GHz, without evidence of a steep spectrum.
Since the two measurements were obtained at different epochs, intrinsic variability cannot be ruled out. Importantly, both probe the compact PRS emission at milliarcsecond scales with negligible contamination from host-galaxy star formation. A recent reprocessing of the same VLA 1.52 GHz observations originally presented by Ibik et al. (2024) by Bruno et al. (2026) yielded S1.52 GHz ≈ 250 μJy after full primary-beam correction. This is higher by a factor of ∼1.3 than the original VLA value and the VLBI measurement. The resulting discrepance is ∼1.5σ, suggesting a possible contribution from extended emission at arcsecond scales, although at a moderate statistical confidence level.
The combination of the two VLBI points with the 2σ upper limit at 144 MHz from Bruno et al. (2026) shows that the spectrum of the compact component remains consistent with a single power law across the 0.14–5 GHz range (particularly for α ≳ 0). Consequently, a low-frequency turn-over is not required when only the milliarcsecond-scale emission is considered. Moreover, we note that Bruno et al. (2026) adopted a 2σ threshold for the LOFAR upper limit: a more conventional 3σ limit would make a low-frequency turn-over even less probable when combined with the VLBI data. However, this conclusion is largely sensitivity-limited given the relatively large uncertainties of the current VLBI data; only more sensitive low-frequency VLBI observations can provide a definitive comparison with the turn-over reported by Bruno et al. (2026). This makes FRB 20190417A only the second PRS, after FRB 20121102A (Marcote et al. 2017), for which the radio spectral slope is constrained using measurements obtained entirely at milliarcsecond resolution with VLBI.
3. Discussion
3.1. Nature of the persistent emission
The measured spectral index of α = −0.19 ± 0.29 indicates that the spectrum of the PRS associated with FRB 20190417A is nearly flat. When synchrotron radiation is assumed as the most plausible emission mechanism for PRSs, there are two possible interpretations of the observed spectral index. First, the spectrum between 1.5 and 5 GHz might represent the integrated emission from an electron population with a broad energy distribution, characterised by a power-law index of p = 1 − 2α = 1.4 ± 0.6. While the nominal value suggests p < 2, we note that p ∼ 2 remains consistent within the (1 − 2) σ uncertainty range. Therefore, standard shock acceleration, which typically yields p ∼ 2 − 3, cannot be ruled out. This is further supported by the spectral index reported by Ibik et al. (2024), which, with a smaller uncertainty, is consistent with p ∼ 2 − 3. On the other hand, the relatively flat spectrum in our measurement is also compatible with a population of fossil electrons, which often have p ∼ 1 − 1.5, as expected in the bubble of a pulsar wind nebula. Alternatively, the observed flux spectrum might correspond to the peak of a synchrotron spectrum. In this scenario, the peak frequency corresponds to the typical frequency νm related to the minimum Lorentz factor γm or the synchrotron self-absorption frequency νa. For the former scenario, we have
 (1)
(1)
where νpeak is the observed peak frequency that is likely at ∼1.5 GHz, and B is the magnetic field strength in the emission region. Then, we can obtain the following constraints:
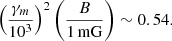 (2)
(2)
If the peak frequency corresponds to the synchrotron self-absorption frequency νa, we have (Yang et al. 2016; Bruni et al. 2025)
![Mathematical equation: $$ \begin{aligned} \nu _a=\nu _B\left[\frac{\pi e(p-1)n_{e,0}\gamma _m^{p-1}R}{2B}f_{\alpha }(p)\right]^{2/(p+4)}\sim \nu _{\rm peak}\sim 1.5\,\mathrm{GHz}, \end{aligned} $$](/articles/aa/full_html/2026/06/aa60228-26/aa60228-26-eq4.gif) (3)
(3)
where ne, 0 is the total electron number density, νB = eB/2πmec is the electron cyclotron frequency under a magnetic field B, and R is the radius of the nebula, fα(p)≡3(p + 1)/2Γ[(3p + 2)/12]Γ[(3p + 22)/12]. We assumed p ∼ 2 for a typical particle acceleration mechanism in a shock and obtained the following constraint:
 (4)
(4)
The origin of the nebula that causes PRS and RM remains unsettled, with several viable interpretations. An FRB embedded in a self-absorbed synchrotron nebula can reshape the electron spectrum and generate a spectral hump near the absorption frequency (Yang et al. 2016; Li et al. 2020). Alternatively, the PRS might arise from a young magnetar wind nebula powered by synchrotron emission through interactions with supernova ejecta (Murase et al. 2016; Metzger et al. 2017; Margalit & Metzger 2018; Rahaman et al. 2025) or the interstellar medium (Dai et al. 2017; Yang & Dai 2019). Other possibilities include a hypernebula driven by super-Eddington outflows in compact binaries (Sridhar & Metzger 2022) and accreting wandering massive black holes in dwarf galaxies (Eftekhari et al. 2020; Reines et al. 2020; Dong et al. 2024).
3.2. The Lradio–|RM| relation
While the precise origin has yet to be determined, a physical connection between the burst source and the PRS can be generally inferred from the concurrent requirements for particle acceleration and Faraday rotation within a magnetised medium. In this context, Yang et al. (2020, 2022) proposed that the RM of a repeating FRB and its accompanying PRS might originate in a common physical region, leading to a straightforward and nearly model-agnostic connection between the FRB RM and the PRS luminosity. Building upon this framework, Yang (2026) further developed a method that interprets the intrinsic scatter in the Lν − |RM| relation as a probe of nebular physics. This scatter reflects the growth history of the nebula, parametrised as  . Using a general scaling Lν ∝ Rϵ|RM| and examining residuals from the FRB-PRS sample, we can infer the combination of the evolutionary index of
  . The latter represents the product of the nebular expansion index (
 ) and the scaling of the radio luminosity with size (Lν ∝ Rϵ), offering a robust approach to distinguish between competing models of nebular evolution. Recent studies have also explored the use of the Lν–|RM| relation as a potential standardisable candle for cosmological applications, although its current constraining power is limited by the small sample size, intrinsic scatter, and remaining systematic uncertainties (Zhang & Zhang 2025; Gao et al. 2025).
Because all currently confirmed PRSs have measurements in the 5–6 GHz band, we adopted the flux densities listed in Table 2 of Yang (2026). For FRB 20190417A, we updated the newly reported flux in this work, Fν = 150 μJy at 5 GHz. In addition, we included the upper limit of the flux density of the PRS candidate 20181030A-S1 in Fig. 1, but excluded it from the calculation of the Lν − |RM| relation and its scatter. Following the approach of Yang (2026), we estimated the standard deviation of the residuals using the five currently confirmed PRSs. The measurement uncertainties are negligible compared to the intrinsic scatter and were therefore ignored. We first took the base-10 logarithm of Lν and |RM| and fitted a linear relation of the form log Lν, fit = log|RM|+C0, where the mathematical symbol “log” refers to the logarithm to base 10, and C0 represents the mean offset. We note that the unit slope was adopted here not as a statistical best fit, but as a physically motivated detrending procedure (see Sect. 3 of Yang 2026 for details). Given the relation Lν ∝ Rϵ|RM|, enforcing a slope of unity effectively removes the explicit |RM| dependence and isolates the contribution from the stochastic variable R in the residuals. Importantly, this approach does not require |RM| and R to be independent. Any intrinsic coupling between them would manifest as a systematic trend in the residuals, but does not affect the global dispersion. In this case, the resulting scatter provides a robust measure of the dynamic range of R without introducing bias from the fitting procedure. The residuals were then defined as Δ = log Lν − log Lν, fit. The resulting standard deviation of Δ, σΔ = 0.67, corresponds to  . Since FRB 20190417A exhibits a flat spectrum across the observed bands, our results remain consistent with those of Yang (2026). This result is roughly more consistent with scenarios involving forward shocks in the free-expansion phase of SNR/ISM and PWN/SNR systems (
 –2.8) and also with young PWNe powered by a nearly steady wind (
 ).
).
 |
Fig. 1. Lν–|RM| relation for five confirmed PRSs and one candidate. Top: Confirmed sources (black circles, labelled), and the candidate 20181030A-S1 (Ibik et al. 2024) is shown as a grey point. The solid red line indicates the best-fit relation with a fixed unit slope, and the shaded region shows its 1σ scatter (σΔ = 0.67). Bottom: Logarithmic residuals (Δ; left) with ±1σ limits (dashed lines) and their distribution (right) with a Gaussian fit (solid red). Sources with |RM|≲100 rad m−2 (left of the dashed green line) may deviate due to contributions of the host ISM. |
4. Conclusions
In this Letter, we reported on observations made with the European VLBI Network (EVN) at 5 and 8 GHz of the persistent radio source associated with FRB 20190417A, and we provided upper limits for the candidate PRS associated with FRB 20181030A. Our main results are summarised below.
-
At 5 GHz, we detected a compact source at milliarcsecond scales in a location that is consistent with the PRS linked with FRB 20190417A by previous studies (Moroianu et al. 2026). The source is unresolved, with a projected physical size ≲15 pc, and a high brightness temperature (Tb > 3.8 × 10⁵ K), supporting a non-thermal synchrotron origin. At 8 GHz, we derived a constraining upper limit on its emission.
-
By combining our measurement with VLBI observations at 1.4 GHz, we derived a radio spectral index α = −0.19 ± 0.29. This makes FRB 20190417A only the second PRS, after FRB 20121102A, with a spectral index constrained entirely using VLBI data. The measured value indicates a relatively flat spectrum, corresponding to an electron power-law index p = 1 − 2α = 1.4 ± 0.6. While the nominal value favours a hard spectrum (p < 2), the conventional value p ≈ 2 (as expected from diffusive shock acceleration) remains consistent within the ∼1σ uncertainty range. The nearly flat spectrum can also be interpreted as the peak of a synchrotron spectrum, providing constraints on the physical conditions of the emitting region (e.g. magnetic field, particle density, and size).
-
We placed FRB 20190417A in the Lν–|RM| plane, where it is consistent with the proposed relation linking PRS luminosity and Faraday rotation measure. When we included this source, we estimated a scatter of σΔ = 0.65, corresponding to
 , which is consistent with scenarios involving young pulsar wind nebulae or forward shocks in the free-expansion phase.
 -
For the candidate PRS 20181030A-S1, we reported non-detections at 5 and 8 GHz. At 5 GHz, the upper limit implies a spectral luminosity L5 GHz ≲ 3.8 × 1025 erg s−1 Hz−1 and constrains the spectral index to α ≲ −1.2 relative to the VLA measurement at 1.5 GHz. This would indicate an unusually steep spectrum if the emission were to arise from a compact source. Alternatively, the VLA detection might be dominated by diffuse host-galaxy emission (e.g. star-forming regions) and not directly associated with the FRB.
Acknowledgments
We thank A. Moroianu for helping us compare the results from the PRECISE collaboration with those presented in this work. Y.P.Y is supported by the National Natural Science Foundation of China (No. 12473047), the National Key Research and Development Program of China (No. 2024YFA1611603) and the Yunnan Key Laboratory of Survey Science (No. 202449CE340002). The research leading to these results has received funding from the European Union’s Horizon 2020 programme under the AHEAD2020 project (grant agreement no. 871158). The European VLBI Network is a joint facility of independent European, African, Asian, and North American radio astronomy institutes. Scientific results from data presented in this publication are derived from the following EVN project codes: EB116A and EB116B.
References
- Bhandari, S., Sadler, E. M., Prochaska, J. X., et al. 2020, ApJ, 895, L37 [NASA ADS] [CrossRef] [Google Scholar]
- Bhandari, S., Heintz, K. E., Aggarwal, K., et al. 2022, AJ, 163, 69 [NASA ADS] [CrossRef] [Google Scholar]
- Bhardwaj, M., Kirichenko, A. Y., Michilli, D., et al. 2021, ApJ, 919, L24 [NASA ADS] [CrossRef] [Google Scholar]
- Bochenek, C. D., Ravi, V., Belov, K. V., et al. 2020, Nature, 587, 59 [NASA ADS] [CrossRef] [Google Scholar]
- Bruni, G., Piro, L., Yang, Y.-P., et al. 2024, Nature, 632, 1014 [CrossRef] [Google Scholar]
- Bruni, G., Piro, L., Yang, Y.-P., et al. 2025, A&A, 695, L12 [NASA ADS] [CrossRef] [EDP Sciences] [Google Scholar]
- Bruno, L., Pelliciari, D., Bernardi, G., et al. 2026, A&A, 709, L1 [NASA ADS] [CrossRef] [EDP Sciences] [Google Scholar]
- Chatterjee, S., Law, C. J., Wharton, R. S., et al. 2017, Nature, 541, 58 [NASA ADS] [CrossRef] [Google Scholar]
- Dai, Z. G., Wang, J. S., & Yu, Y. W. 2017, ApJ, 838, L7 [CrossRef] [Google Scholar]
- Dong, Y., Eftekhari, T., Fong, W., et al. 2024, ApJ, 973, 133 [Google Scholar]
- Eftekhari, T., Berger, E., Margalit, B., Metzger, B. D., & Williams, P. K. G. 2020, ApJ, 895, 98 [NASA ADS] [CrossRef] [Google Scholar]
- Gao, R., Gao, H., Li, Z., & Yang, Y.-P. 2025, ApJ, 994, 239 [Google Scholar]
- Greisen, E. W. 2003, Astrophys. Space Sci. Lib., 285, 109 [NASA ADS] [Google Scholar]
- Ibik, A. L., Drout, M. R., Gaensler, B. M., et al. 2024, ApJ, 961, 99 [NASA ADS] [CrossRef] [Google Scholar]
- Kirsten, F., Marcote, B., Nimmo, K., et al. 2022, Nature, 602, 585 [NASA ADS] [CrossRef] [Google Scholar]
- Kirsten, F., Ould-Boukattine, O. S., Herrmann, W., et al. 2024, Nat. Astron., 8, 337 [NASA ADS] [CrossRef] [Google Scholar]
- Li, Q.-C., Yang, Y.-P., & Dai, Z.-G. 2020, ApJ, 896, 71 [Google Scholar]
- Marcote, B., Paragi, Z., Hessels, J. W. T., et al. 2017, ApJ, 834, L8 [CrossRef] [Google Scholar]
- Margalit, B., & Metzger, B. D. 2018, ApJ, 868, L4 [NASA ADS] [CrossRef] [Google Scholar]
- Margalit, B., Berger, E., & Metzger, B. D. 2019, ApJ, 886, 110 [NASA ADS] [CrossRef] [Google Scholar]
- Metzger, B. D., Berger, E., & Margalit, B. 2017, ApJ, 841, 14 [NASA ADS] [CrossRef] [Google Scholar]
- Moroianu, A. M., Bhandari, S., Drout, M. R., et al. 2026, ApJ, 996, L16 [Google Scholar]
- Murase, K., Kashiyama, K., & Mészáros, P. 2016, MNRAS, 461, 1498 [NASA ADS] [CrossRef] [Google Scholar]
- Niu, C. H., Aggarwal, K., Li, D., et al. 2022, Nature, 606, 873 [NASA ADS] [CrossRef] [Google Scholar]
- Piro, L., Bruni, G., Troja, E., et al. 2021, A&A, 656, L15 [NASA ADS] [CrossRef] [EDP Sciences] [Google Scholar]
- Planck Collaboration VI. 2020, A&A, 641, A6 [NASA ADS] [CrossRef] [EDP Sciences] [Google Scholar]
- Rahaman, S. M., Acharya, S. K., Beniamini, P., & Granot, J. 2025, ApJ, 988, 276 [Google Scholar]
- Reines, A. E., Condon, J. J., Darling, J., & Greene, J. E. 2020, ApJ, 888, 36 [NASA ADS] [CrossRef] [Google Scholar]
- Shepherd, M. C. 1997, ASP Conf. Ser., 125, 77 [Google Scholar]
- Sridhar, N., & Metzger, B. D. 2022, ApJ, 937, 5 [NASA ADS] [CrossRef] [Google Scholar]
- Tendulkar, S. P., Bassa, C. G., Cordes, J. M., et al. 2017, ApJ, 834, L7 [NASA ADS] [CrossRef] [Google Scholar]
- The CHIME/FRB Collaboration (Abbott, T., et al.) 2026, ApJS, 283, 34 [Google Scholar]
- Wang, K.-S., Simmonds, R., Comrie, A., et al. 2026, PASP, 138, 024506 [Google Scholar]
- Yang, Y. P. 2026, arXiv e-prints [arXiv:2603.17615] [Google Scholar]
- Yang, Y.-H., & Dai, Z.-G. 2019, ApJ, 885, 149 [NASA ADS] [CrossRef] [Google Scholar]
- Yang, Y.-P., Zhang, B., & Dai, Z.-G. 2016, ApJ, 819, L12 [NASA ADS] [CrossRef] [Google Scholar]
- Yang, Y.-P., Li, Q.-C., & Zhang, B. 2020, ApJ, 895, 7 [NASA ADS] [CrossRef] [Google Scholar]
- Yang, Y.-P., Lu, W., Feng, Y., Zhang, B., & Li, D. 2022, ApJ, 928, L16 [NASA ADS] [CrossRef] [Google Scholar]
- Zhang, B. 2020, Nature, 587, 45 [CrossRef] [Google Scholar]
- Zhang, Z.-L., & Zhang, B. 2025, ApJ, 984, L40 [Google Scholar]
Appendix A: EVN observations and data processing
Observations were performed with the EVN in two sessions, EB116A (May 30, 2025) and EB116B (June 18, 2025), at central frequencies of 8 (X-band) and 5 GHz (C-band), respectively. The observations were conducted in phase-referencing mode to enable accurate astrometry and high sensitivity to faint compact emission. The target source 20181030A-S1 was calibrated using the phase-reference source J1048+7143. The target source 20190417A-S1 was calibrated using the phase-reference source J1934+6138. A phase referencing cycle of ∼5 minutes was scheduled for both bands. These were dedicated continuum observations aimed at detecting the persistent radio sources only. No dedicated real-time or offline search for bursts was performed on these data. However, no bursts from either FRB 20190417A or FRB 20181030A were detected with other telescopes during the EVN observations.
The EB116A experiment was carried out with five antennas: Westerbork (Wb), Effelsberg (Ef), Onsala (O6), Toruń (Tr), and Irbene (Ib). Nine antennas participated in EB116B: Jodrell Bank (Jb), Westerbork (Wb), Effelsberg (Ef), Onsala (O8), Tianma (T6), Urumqi (Ur), Toruń (Tr), Irbene (Ib), and Sardinia Radio Telescope (Sr). In both sessions, data were recorded in dual circular polarisation. The data were correlated at the Joint Institute for VLBI ERIC (JIVE) using the SFXC correlator with 1-second integrations, producing eight 32-MHz subbands with 64 spectral channels.
The data were calibrated following standard EVN procedures within the Astronomical Image Processing System (AIPS, Greisen 2003). This included a priori amplitude calibration using system temperatures and gain curves (ANTAB and APCAL tasks), parallactic angle correction, and global fringe fitting on nearby phase calibrators. No amplitude self-calibration was performed, as the target sources are too faint for reliable self-calibration. The amplitudes of the phase calibrators were verified to agree with their catalog values within a few percent, confirming the reliability of the a-priori flux scale (typical uncertainty ∼10%). The calibrated visibilities were imaged in Difmap (Shepherd 1997) using natural weighting (to minimize image noise) and the CLEAN algorithm. Due to the low signal to noise ratio (∼10), and to preserve the astrometric information of the target, no amplitude or phase self-calibration were applied. The resulting clean images were then imported into CARTA (Wang et al. 2026), where an elliptical Gaussian component was fitted in the image plane to measure the position and integrated flux density of the source. In case of non-detection, the RMS noise was measured in a region centred on the expected PRS position from Ibik et al. (2024).
Table A.1 summarizes the EVN observations and results.
EVN observations and main results for the two candidate persistent radio sources.
Appendix B: Detection and localisation of 20190417A-S1
In our EVN 5 GHz observations, we detect a compact radio source at a position consistent with 20190417A-S1. The synthesised beam (FWHM) is 6.5 × 3.4 mas with a position angle of −13.8°, and the image RMS noise is 16 μJy beam−1. The source is well described by a single Gaussian component. The best-fit position (referenced to the FK5 system) is

The corresponding ICRS coordinates are α = 19h39m05.8942s ± 0.7 mas and δ = +59° 19′36.8057″±0.7 mas. To account for systematic uncertainties, the quoted positional error of ∼0.7 mas in both coordinates is the quadratic sum of (i) the formal Gaussian-fit uncertainty, (ii) 10% of the synthesised-beam major axis (to conservatively include residual phase-referencing and atmospheric contributions), and (iii) the absolute positional uncertainty of the phase calibrator. After calibration, the measured position of the phase calibrator agrees with its catalog position to within 0.1 mas, confirming that phase-referencing errors are negligible. The location of our counterpart is consistent within 3-σ with that of Moroianu et al. (2026), considering the larger uncertainties of their 1.4 GHz measurement of ∼4 mas). In Fig. B.1 we show both detections, with the 1.4 GHz EVN image from Moroianu et al. (2026), reproduced from archival data, project EK050G) displayed in contours.
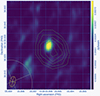 |
Fig. B.1. EVN 5 GHz image of the persistent radio source associated with FRB 20190417A (colour scale). Contours show the EVN 1.4 GHz detection from Moroianu et al. (2026), drawn at levels of 5, 6, 7, 8, 9 and 10 times the RMS noise (21 μJy beam−1). The synthesised beams are indicated in the lower left corner (grey ellipse for 1.4 GHz and yellow ellipse for 5 GHz). |
The source has an integrated flux density of S5 GHz = 150 ± 45 μJy, as extracted via Gaussian fitting. The given uncertainty includes both the Gaussian fit error and a 10% uncertainty on the absolute flux density scale, added in quadrature. The fitted source size is θmaj = 6.4 ± 1.4 mas and θmin = 3.8 ± 0.5 mas, consistent with the synthesised beam. We therefore consider the source as unresolved at milliarcsecond scales. Adopting the beam major axis as the most conservative upper limit on the angular size, this implies a projected physical size ≲ 15 pc at the redshift of the host galaxy (z = 0.12817, Ibik et al. 2024), and a brightness temperature Tb > 3.8 × 10⁵ K, supporting a non-thermal synchrotron origin for the emission. Finally, the integrated flux density measured with the EVN corresponds to a spectral luminosity of L5 GHz = (6.2 ± 1.9)×1028 erg s−1 Hz−1, consistent within errors with the one reported by Moroianu et al. (2026). At 8 GHz, the source is not detected, resulting in a 5-σ upper limit of 250 μJy.
Appendix C: Upper limits on 20181030A-S1
For the candidate PRS 20181030A-S1 we obtained a non-detection both at 5 and 8 GHz. Assuming the host distance of ∼20 Mpc for FRB 20181030A – as it was associated with NGC 3252, see Bhardwaj et al. (2021) – our 5 GHz upper limit of 80 μJy (5-σ) corresponds to a spectral luminosity upper limit of L5 GHz ≲ 3.8 × 1025 erg s−1 Hz−1. At 8 GHz, the non detection is less stringent, with a 5-σ upper limit of 150 μJy.
At 5 GHz, the non-detection places a strong constraint on the radio spectral index, implying a very steep spectrum (α ≲ −1.2) when compared with the VLA flux density measured at 1.5 GHz by Ibik et al. (2024). Alternatively, the emission detected at VLA resolution may be dominated by diffuse components within the host galaxy (e.g. star-forming regions), rather than being directly associated with the FRB.
All Tables
EVN observations and main results for the two candidate persistent radio sources.
All Figures
|
Fig. 1. Lν–|RM| relation for five confirmed PRSs and one candidate. Top: Confirmed sources (black circles, labelled), and the candidate 20181030A-S1 (Ibik et al. 2024) is shown as a grey point. The solid red line indicates the best-fit relation with a fixed unit slope, and the shaded region shows its 1σ scatter (σΔ = 0.67). Bottom: Logarithmic residuals (Δ; left) with ±1σ limits (dashed lines) and their distribution (right) with a Gaussian fit (solid red). Sources with |RM|≲100 rad m−2 (left of the dashed green line) may deviate due to contributions of the host ISM. |
| In the text | |
|
Fig. B.1. EVN 5 GHz image of the persistent radio source associated with FRB 20190417A (colour scale). Contours show the EVN 1.4 GHz detection from Moroianu et al. (2026), drawn at levels of 5, 6, 7, 8, 9 and 10 times the RMS noise (21 μJy beam−1). The synthesised beams are indicated in the lower left corner (grey ellipse for 1.4 GHz and yellow ellipse for 5 GHz). |
| In the text | |
Current usage metrics show cumulative count of Article Views (full-text article views including HTML views, PDF and ePub downloads, according to the available data) and Abstracts Views on Vision4Press platform.
Data correspond to usage on the plateform after 2015. The current usage metrics is available 48-96 hours after online publication and is updated daily on week days.
Initial download of the metrics may take a while.