| Issue |
A&A
Volume 709, May 2026
|
|
|---|---|---|
| Article Number | L10 | |
| Number of page(s) | 7 | |
| Section | Letters to the Editor | |
| DOI | https://doi.org/10.1051/0004-6361/202659631 | |
| Published online | 07 May 2026 | |
Letter to the Editor
The environmental imprint on molecular layering in the dusty streamer of M512
1
European Southern Observatory, Karl-Schwarzschild-Straße 2, D-85478 Garching bei München, Germany
2
European Southern Observatory, Alonso de Córdova 3107, Vitacura, Region Metropolitana de Santiago, Chile
3
SUPA, School of Physics & Astronomy, University of St Andrews, North Haugh, St Andrews, KY16 9SS, UK
4
INAF, Osservatorio Astrofisico di Arcetri, Largo E. Fermi 5, I-50125 Firenze, Italy
5
Department of Astronomy, University of Virginia, Charlottesville, VA 22904, USA
6
Department of Astronomy, University of Florida, Gainesville, FL 32611, USA
7
Earth and Planets Laboratory, Carnegie Institution for Science, 5241 Broad Branch Road, NW, Washington, DC 20015, USA
8
Department of Astronomy, Boston University, 725 Commonwealth Avenue, Boston, MA 02215, USA
★ Corresponding author: This email address is being protected from spambots. You need JavaScript enabled to view it.
Received:
27
February
2026
Accepted:
13
April
2026
Abstract
Protostellar streamers are elongated structures that channel material from larger scale onto disks, influencing their physical and chemical evolution. The M512 protostar in Orion/Lynds 1641 hosts one of the most massive and extended streamer discovered so far, offering a unique opportunity to study these processes. We investigated the morphology, chemistry, and origin of this streamer, along with its potential impact on the protostellar disk. Using archival ALMA observations of C18O, DCO+, N2D+, and HCO+, we compared their spatial distributions through moment maps and spatial profiles. The streamer shows clear chemical stratification: C18O lies on the western side of the protostar, N2D+ is farther out to the east, and DCO+ is in the middle. This suggests that the structure has been shaped by environmental effects, rather than tracing a single coherent infalling flow, with only the densest gas near the protostar likely to accrete onto the disk. Overall, the bulk of the streamer reflects the physical and chemical imprint of the surrounding cloud, highlighting the importance of environmental shaping in interpreting streamer–disk connections and their role in disk growth.
Key words: ISM: bubbles / ISM: molecules / submillimeter: ISM
© The Authors 2026
 Open Access article, published by EDP Sciences, under the terms of the Creative Commons Attribution License (https://creativecommons.org/licenses/by/4.0), which permits unrestricted use, distribution, and reproduction in any medium, provided the original work is properly cited.
This article is published in open access under the Subscribe to Open model. This email address is being protected from spambots. You need JavaScript enabled to view it. to support open access publication.
1. Introduction
Recent interferometric observations have reached unprecedented spatial and spectral resolution, along with a high level of sensitivity to detect molecular line emission revealing complex and extended gas structure around young stellar objects. On scales from ∼150 au to 10 000 au, elongated and asymmetric features have been detected toward both Class 0 (e.g., Pineda et al. 2020; Cabedo et al. 2021; Murillo et al. 2022; Thieme et al. 2022) and Class I sources (e.g., Bianchi et al. 2022; Valdivia-Mena et al. 2022; Hsieh et al. 2023; Harada et al. 2023; Podio et al. 2024; Tanious et al. 2024), as well as even more evolved system showing late infall (e.g., Gupta et al. 2024). Molecular tracers not only enable the detection of these structures, but also provide insights into their physical and chemical properties. These observational results contrast with the traditionally symmetric picture of the protostellar phase (Shu 1977; Andre et al. 2000; Frank et al. 2014), indicating that protostellar accretion is nonaxisymmetric and influenced by the surrounding environment.
These structures, known as streamers, trace material funneling from the outer envelope to the disk. They can be associated with disk misalignments, resulting from environmental interactions or captured material (Gupta et al. 2026). Observed in tracers as CO, HCO+, HC3N, they might contribute to protostellar accretion and disk substructure, while carrying enough mass to significantly replenish the disk (Pineda et al. 2023; Kuffmeier et al. 2023; Hennebelle et al. 2017; Kuznetsova et al. 2022; Tanious et al. 2025) or alter its composition through shocks (Sakai et al. 2014; Garufi et al. 2022; Artur de la Villarmois et al. 2022; Podio et al. 2024).
One peculiar elongated structures is toward the low-mass Class I protostar M512 in Orion A/Lynds 1641 (∼420 pc; Gaia Collaboration 2022). This structure, detected in both gas and millimeter dust (Grant et al. 2021), was interpreted as a streamer by Cacciapuoti et al. (2024), who used a streamline model of the C18O emission for its study. These authors found that it is tentatively consistent with infall, deriving a mass of ∼80 MJ and a mass infall rate of 2 × 10⁻⁶ M⊙ yr−1. However, their narrow (∼1 km s−1) line is only resolved by four to five channels in that dataset, preventing a robust kinematic characterization. If even a fraction of this material ends up reaching the disk, it could significantly affect its physical and chemical evolution, making it important to understand the structure’s nature. More details on the source are given in Appendix A
In this work, we investigate the emission of HCO+, DCO+, N2D+, and C18O to explore the chemistry of the M512 elongated structure. The species distribution reveals chemical stratification and an offset between gas and dust peaks associated with the gas temperature structure. This raises the question of whether this structure is an accretion flow channeling material onto the disk or whether it mainly traces cloud material shaped by the environment. Understanding this will provide new insights into the interplay between the cloud, disk, and environment.
2. Observations
M512 (RA: 05h40′13.789″, Dec: −07d32m16.02s) was observed with ALMA in Band 6 on December 2019 (2019.1.00951.S, PI: Grant, S.) and in Band 3 on January 2023 (program 2022.1.00126.S, PI: Wendeborn, J.). Both programs achieved a resolution of  , and maximum recoverable scales of
  for Band 6 and
  for Band 3. Further details on data calibration are in Grant et al. (2021) and Cacciapuoti et al. (2024). For the purposes of the present work, we used the 12m data of C18O, HCO+, DCO+, and N2D+ (see Table 1). The two latter belong to a low spectral resolution spectral window (channel width ∼5 km s−1; see Table 1) and their detection is limited to one single channel. The cubes have been self-calibrated mapping the continuum-based gain solutions found in Cacciapuoti et al. (2024) to the line spectral windows closest in frequency, continuum-subtracted, and primary beam-corrected. They were imaged in CASA1 using tclean with a natural weighting, multiscale deconvolution (scales = [0, 5, 15, 30]) with a pixel size of 0.2″, and automasking. The resulting synthesized beams and root mean square (rms) values are reported in Table 1. We analyzed the cube and produced moment maps using CARTA2, GILDAS3 and in-home python routines. We assumed a 10% flux calibration uncertainty (Remijan et al. 2019).
Spectroscopic and image parameters of the detected lines.
3. Analysis and results
Figure 1(a) shows the large-scale moment 0 emission (integrated intensity) of HCO+ over 2.4–4 km s−1. As expected for relatively abundant species with low transition, the emission seems to be dominated by the envelope. In addition to the central curved feature associated with the streamer identified by Cacciapuoti et al. (2024), HCO+ also traces an elongated structure to the south east and a cavity in the opposite direction. The envelope-dominated nature of HCO+ is further supported by the comparison between HCO+ and C18O channel maps shown in Appendix B. The streamer feature identified by Cacciapuoti et al. (2024) is clearly traced by C18O over a narrow velocity range (< 1 km s−1), spread across a few channels, indicating it traces the densest part of the structure. In contrast, HCO+ is more extended and peaks close to the systemic velocity (∼3.3–3.5 km s−1), where strong envelope emission is expected. Therefore, the streamer signature in HCO+ is clearly contaminated by the envelope, while C18O provides a cleaner view of its kinematics.
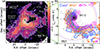 |
Fig. 1. (a): HCO+ emission toward M512. Beam is in the lower right corner (b): Zoom-in on DCO+ (blue), N2D+ (orange) and C18O (magenta) moment 0, with 5σ dust continuum (gray) from Cacciapuoti et al. (2024). Separated maps are in Figure C.1. Dashed gray lines show the spatial profiles paths (Figure 2). Beams are the colored filled circles, and the solid lines the primary beams. The green arrow is the TIPSY stream-model trajectory from Cacciapuoti et al. (2024). Contours starts at 3σ with 2σ steps (σ = 0.32, 0.24, 0.22 mJy beam−1 km s−1 for DCO+ N2D+ and C18O, respectively), and 5σ steps for HCO+ (σ= 3 mJy beam−1 km s−1). |
In the inner 25″, Figure 1(b) shows the moment 0 maps of C18O, integrated over 2.8–4 km s−1, and DCO+, and N2D+, integrated over the single channel of emission, overlaid on the dust continuum. The same maps can be seen separately in Figure C.1. All three species show a similar arc-like structure following the dusty streamer from Cacciapuoti et al. (2024) and they show a clear stratification: C18O is primarily on the western side on the eastern side of the cavity, N2D+ is farther and toward the east and DCO+ seems to lie in between for most part of the streamer. The emission extends over ∼25″ (∼10 500 au) along the arc, with widths of ∼3–5″ (1200–2000 au depending on the tracer), reaching a maximum projected distance of ∼17″ (∼7000 au) from the protostar. To better characterize the stratification, we extracted spatial profiles along cuts intersecting the molecular emission peaks and oriented to highlight the differences between tracers (Figure 2). To better trace the morphology, the cuts (Figure 1b) were chosen to follow the streamer’s dust curvature, rather than being perpendicular to the streamer or radial to the protostar.
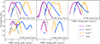 |
Fig. 2. Normalized continuum (gray), C18O (magenta), DCO+ (blue), and N2D+ (orange) profiles along 5 cuts across the streamer (Figure 1). Fluxes are averaged over 3 pixels; error bars are 3×3-pixel standard deviation. Offsets are relative to the C18O peak. |
The flux at each position along the cuts was computed as the mean intensity along three pixels ( , ∼250 au) perpendicular to the path, while the associated errors correspond to the standard deviation within a 3×3 pixel box around each point. The profiles are normalized by their maximum value to emphasize the relative spatial variation, enabling a direct comparison of the tracers. The profiles extracted along these cuts (Figure 2) confirm the chemical stratification: in the three north-east cuts (1, 2, 3), DCO+ lies between C18O and N2D+; whereas in the two south-west cuts (4, 5), N2D+ is located between C18O and DCO+. We note that the DCO+ emission in cuts 4 and 5 lie near the edge of the primary beam, where the sensitivity decreases and, thus, it appears fragmented and so, the observed profiles there should be interpreted with caution. In addition, the apparent inversion of DCO+ and N2D+ could also be a result of projection effects not knowing the 3D structure. Nevertheless, the overall stratification is evident, indicating variations in chemical composition and/or physical conditions across the streamer.
Given the detection of both HCO+ and DCO+ along the streamer, we estimated the deuteration ratio (N(DCO+)/N(HCO+)) to probe chemical variations along the structure. This estimate, however, is subject to significant caveats: HCO+ is likely optically thick and contaminated by the envelope, while DCO+ is spectrally diluted due to the low spectral resolution preventing a determination as to whether both species trace the same gas. To compute the ratio, we derived the column densities of both species, under the assumptions of local thermal equilibrium (LTE) and optically thin emission (Eq. (D.1)). We assumed a 10–30 K temperature range, for a cold dense cloud (∼10 K) and warmer gas in streamer (up to 30 K; Codella et al. 2024) to account the spectroscopy of the two transitions (Table 1). To minimize envelope contamination, the HCO+ column density was estimated integrating the emission overlapping with C18O (2.9–3.5 km s−1; Figure B.1). We derived N(HCO+) and N(DCO+) along the streamer of 0.2–2 × 1013 cm−2 and 0.3–0.9 × 1013 cm−2, respectively. HCO+ becomes optically thick in the 10–30 K range with a column density higher than 1 × 10¹³; thus, the derived column densities should be treated as lower limits and the resulting ratio as an upper limit. We estimated N(DCO+)/N(HCO+) of ∼0.2–5, depending on temperature (10–30 K) and position along the streamer (Figure D.1 at 30 K). These values should be taken with caution as they are are upper limits for the reasons mentioned above. Additionally, deuteration seems enhanced in the south, where DCO+ shows stronger emission (see Figure 1, D.1). However, this occurs at the edge of the primary beam. For completeness, we computed the column density of N2H+ and C18O (see Appendix D). Although HCO+/DCO+ could be used to estimate the ionization fraction and the cosmic ray ionization rate (e.g., Pineda et al. 2024), the Caselli et al. (1999) method requires cold ∼10 K pre-stellar conditions and co-spatial tracers, which are not met here, so the derived values would end up overestimated (Sabatini et al. 2023).
4. Environmental shaping of the M512 streamer
The molecular stratification observed along the streamer provides insights into its physical and chemical structure. The arrangement of N2D+ in the outer eastern regions, DCO+ in the middle, and C18O on the west close to the cavity reflects the interplay between temperature, CO depletion, and deuterium chemistry. In particular, the enhanced outer N2D+ indicates CO depletion (that happens below 25 K), DCO+ forms where some CO remains and where N2D+ and CO coexist (Caselli 2002; Pagani et al. 2011; Ceccarelli et al. 2014). In addition, the inner C18O reflects regions where CO has sublimated. Dust accumulation near the eastern edge may enhance CO shielding and the increase of local density. The presence of C18O emission at the eastern edge of the streamer cannot be explained by the protostar: with ∼1 L⊙, at ∼7000 au, the dust temperature is below the CO sublimation temperature (20–25 K), while CO should be frozen onto dust grain. Detecting gas-phase CO at this location suggests the presence of an additional local heating source, such as compression or external irradiation.
The chemical stratification and the dust morphology identified in our analysis suggest that the elongated structure could have been shaped by external feedback, potentially pushing material from north-east (NE) to south-west (SE). These signatures naturally arise in a swept-up layer that produces dust accumulation, a localized temperature increase that leads to the release of C18O, and the preservation of deuterated species in the outer regions. These signatures are found to be consistent with the tentative NE–SW velocity gradient seen in C18O (Cacciapuoti et al. 2024). In this scenario, shown in Figure 3, the observed molecular layering and morphology are more naturally explained than in the alternative interpretations discussed by Grant et al. (2021) and Cacciapuoti et al. (2024) (see Appendix A). In addition, the lack of FIR nebulosity and the normal Class-I–like SED (see Appendix A) suggest that any external influence is mild, consistent with the moderate heating or compression required to produce the observed stratification. Filamentary and streamer-like structures are ubiquitous in star-forming regions, but their formation and role are still under debate (e.g., Hennebelle & Inutsuka 2019; Robitaille et al. 2020). Often they are influenced by external triggers, such as expanding bubbles, shocks, or nearby stellar activity (e.g., Hacar et al. 2018; Socci et al. 2024; De Simone et al. 2022; Chahine et al. 2022). Orion shows a filamentary environment with cavities and feedback-driven structures (Feddersen et al. 2018; Zheng et al. 2021), while intermediate FUV radiation fields from nearby A–B stars are known to influence the surrounding gas and disks (van Terwisga & Hacar 2023), even though the local FUV field around M512 is modest (Appendix A). We note that the field covered by Feddersen et al. (2018) do not include M512, but they do indicate that small-scale feedback is widespread in Orion A (Figure A.1). In this view, the morphology and chemical stratification of the M512 structure are more naturally explained by environmental shaping than by a single coherent gravitational accretion flow. It is only its densest inner region that is likely to accrete onto the disk, while the bulk of the elongated feature reflects the imprint of the surrounding cloud, possibly channeled through the parent filament (Valdivia-Mena et al. 2024), with limited impact on the disk itself. Higher resolution (< 0.1 km s−1) data would be needed for kinematics, while slightly larger-scale shock and dense-gas mapping could probe gentle compression or illumination in the surrounding filament.
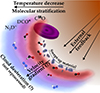 |
Fig. 3. Scheme of the proposed external feedback scenario shaping the M512 structure. N2D+ (blue), traces the cold outer regions, DCO+ (purple) the intermediate layer, and C18O (red) the warmer gas. The M512 protostar+disk is at the center. Arrows indicate feedback direction and the resulting velocity and temperature gradients. The figure is qualitative and not to scale. |
Acknowledgments
We thank the referee for helping improve the manuscript. We thank Prof. C. Ceccarelli and Dr. G. Sabatini for the useful discussions. This paper makes use of the following ALMA data: ADS/JAO.ALMA#2019.1.00951.S and ADS/JAO.ALMA#2022.1.00126. ALMA is a partnership of ESO (representing its member states), NSF (USA) and NINS (Japan), together with NRC (Canada), NSTC and ASIAA (Taiwan), and KASI (Republic of Korea), in cooperation with the Republic of Chile. The Joint ALMA Observatory is operated by ESO, AUI/NRAO and NAOJ. D.C. acknowledge support from the 2024 ESO Summer Research Programme.
References
- Amano, T., Hirao, T., & Takano, J. 2005, J. Mol. Spectroscopy, 234, 170 [Google Scholar]
- Andre, P., Ward-Thompson, D., & Barsony, M. 2000, in PPIV, 59 [Google Scholar]
- Artur de la Villarmois, E., Guzmán, V. V., Jørgensen, J. K., et al. 2022, A&A, 667, A20 [NASA ADS] [CrossRef] [EDP Sciences] [Google Scholar]
- Bianchi, E., López-Sepulcre, A., Ceccarelli, C., et al. 2022, ApJ, 928, L3 [NASA ADS] [CrossRef] [Google Scholar]
- Cabedo, V., Maury, A., Girart, J. M., & Padovani, M. 2021, A&A, 653, A166 [NASA ADS] [CrossRef] [EDP Sciences] [Google Scholar]
- Cacciapuoti, L., Macias, E., Gupta, A., et al. 2024, A&A, 682, A61 [NASA ADS] [CrossRef] [EDP Sciences] [Google Scholar]
- Caratti o Garatti, A., Garcia Lopez, R., Antoniucci, S., et al. 2012, A&A, 538, A64 [NASA ADS] [CrossRef] [EDP Sciences] [Google Scholar]
- CASA Team (Bean, B., et al.) 2022, PASP, 134, 114501 [NASA ADS] [CrossRef] [Google Scholar]
- Caselli, P. 2002, Planet. Space Sci., 50, 1133 [NASA ADS] [CrossRef] [Google Scholar]
- Caselli, P., & Dore, L. 2005, A&A, 433, 1145 [NASA ADS] [CrossRef] [EDP Sciences] [Google Scholar]
- Caselli, P., Walmsley, C. M., Tafalla, M., Dore, L., & Myers, P. C. 1999, ApJ, 523, L165 [Google Scholar]
- Ceccarelli, C., Caselli, P., Bockelée-Morvan, D., et al. 2014, in PPVI, 859 [Google Scholar]
- Chahine, L., López-Sepulcre, A., Podio, L., et al. 2022, A&A, 667, A6 [NASA ADS] [CrossRef] [EDP Sciences] [Google Scholar]
- Codella, C., Podio, L., De Simone, M., et al. 2024, MNRAS, 528, 7383 [NASA ADS] [CrossRef] [Google Scholar]
- Comrie, A., Wang, K. S., Hwang, Y. H., et al. 2026, https://doi.org/10.5281/zenodo.18477253 [Google Scholar]
- De Simone, M., Codella, C., Ceccarelli, C., et al. 2022, MNRAS, 512, 5214 [CrossRef] [Google Scholar]
- Feddersen, J. R., Arce, H. G., Kong, S., et al. 2018, ApJ, 862, 121 [NASA ADS] [CrossRef] [Google Scholar]
- Frank, A., Ray, T. P., Cabrit, S., et al. 2014, in PPVI, 451 [Google Scholar]
- Gaia Collaboration (Klioner, S. A., et al.) 2022, A&A, 667, A148 [NASA ADS] [CrossRef] [EDP Sciences] [Google Scholar]
- Garufi, A., Podio, L., Codella, C., et al. 2022, A&A, 658, A104 [CrossRef] [EDP Sciences] [Google Scholar]
- Gildas Team 2013, GILDAS software, Astrophysics Source Code Library [record ascl:1305.010] [Google Scholar]
- Goldsmith, P. F., & Langer, W. D. 1999, ApJ, 517, 209 [Google Scholar]
- Grant, S. L., Espaillat, C. C., Megeath, S. T., et al. 2018, ApJ, 863, 13 [Google Scholar]
- Grant, S. L., Espaillat, C. C., Wendeborn, J., et al. 2021, ApJ, 913, 123 [NASA ADS] [CrossRef] [Google Scholar]
- Gupta, A., Miotello, A., Williams, J. P., et al. 2024, A&A, 683, A133 [NASA ADS] [CrossRef] [EDP Sciences] [Google Scholar]
- Gupta, A., Hales, A. S., Cleeves, L. I., et al. 2026, ApJ, 998, 105 [Google Scholar]
- Hacar, A., Tafalla, M., Forbrich, J., et al. 2018, A&A, 610, A77 [NASA ADS] [CrossRef] [EDP Sciences] [Google Scholar]
- Harada, N., Tokuda, K., Yamasaki, H., et al. 2023, ApJ, 945, 63 [NASA ADS] [CrossRef] [Google Scholar]
- Hennebelle, P., & Inutsuka, S.-I. 2019, Front. Astron. Space Sci., 6, 5 [NASA ADS] [CrossRef] [Google Scholar]
- Hennebelle, P., Lesur, G., & Fromang, S. 2017, A&A, 599, A86 [NASA ADS] [CrossRef] [EDP Sciences] [Google Scholar]
- Hsieh, T.-H., Segura-Cox, D. M., Pineda, J. E., et al. 2023, A&A, 669, A137 [NASA ADS] [CrossRef] [EDP Sciences] [Google Scholar]
- Jørgensen, J. K., van Dishoeck, E. F., Visser, R., et al. 2009, A&A, 507, 861 [NASA ADS] [CrossRef] [EDP Sciences] [Google Scholar]
- Kuffmeier, M., Jensen, S. S., & Haugbølle, T. 2023, Eur. Phys. J. Plus, 138, 272 [NASA ADS] [CrossRef] [Google Scholar]
- Kuznetsova, A., Bae, J., Hartmann, L., & Mac Low, M.-M. 2022, ApJ, 928, 92 [NASA ADS] [CrossRef] [Google Scholar]
- Lattanzi, V., Walters, A., Drouin, B. J., & Pearson, J. C. 2007, ApJ, 662, 771 [NASA ADS] [CrossRef] [Google Scholar]
- Mangum, J. G., & Shirley, Y. L. 2015, PASP, 127, 266 [Google Scholar]
- Megeath, S. T., Gutermuth, R., Muzerolle, J., et al. 2012, AJ, 144, 192 [NASA ADS] [CrossRef] [Google Scholar]
- Müller, H. S. P., Schlöder, F., Stutzki, J., & Winnewisser, G. 2005, J. Mol. Struct., 742, 215 [Google Scholar]
- Murillo, N. M., van Dishoeck, E. F., Hacar, A., Harsono, D., & Jørgensen, J. K. 2022, A&A, 658, A53 [NASA ADS] [CrossRef] [EDP Sciences] [Google Scholar]
- Pagani, L., Daniel, F., & Dubernet, M.-L. 2009, A&A, 494, 719 [NASA ADS] [CrossRef] [EDP Sciences] [Google Scholar]
- Pagani, L., Roueff, E., & Lesaffre, P. 2011, ApJ, 739, L35 [NASA ADS] [CrossRef] [Google Scholar]
- Pineda, J. E., Segura-Cox, D., Caselli, P., et al. 2020, Nature Astronomy, 4, 1158 [CrossRef] [Google Scholar]
- Pineda, J. E., Arzoumanian, D., Andre, P., et al. 2023, in PPVII, 534, 233 [Google Scholar]
- Pineda, J. E., Sipilä, O., Segura-Cox, D. M., et al. 2024, A&A, 686, A162 [NASA ADS] [CrossRef] [EDP Sciences] [Google Scholar]
- Podio, L., Ceccarelli, C., Codella, C., et al. 2024, A&A, 688, L22 [NASA ADS] [CrossRef] [EDP Sciences] [Google Scholar]
- Remijan, A., Biggs, A., Cortes, P. A., et al. 2019, ALMA Techn Handbook, 7.3 [Google Scholar]
- Robitaille, J.-F., Abdeldayem, A., Joncour, I., et al. 2020, A&A, 641, A138 [NASA ADS] [CrossRef] [EDP Sciences] [Google Scholar]
- Sabatini, G., Bovino, S., & Redaelli, E. 2023, ApJ, 947, L18 [NASA ADS] [CrossRef] [Google Scholar]
- Sakai, N., Oya, Y., Sakai, T., et al. 2014, ApJ, 791, L38 [Google Scholar]
- Shu, F. H. 1977, ApJ, 214, 488 [Google Scholar]
- Socci, A., Hacar, A., Bonanomi, F., Tafalla, M., & Suri, S. 2024, A&A, 690, A375 [NASA ADS] [CrossRef] [EDP Sciences] [Google Scholar]
- Tanious, M., Le Gal, R., Neri, R., et al. 2024, A&A, 687, A92 [NASA ADS] [CrossRef] [EDP Sciences] [Google Scholar]
- Tanious, M., Le Gal, R., Faure, A., et al. 2025, A&A, 703, A244 [NASA ADS] [CrossRef] [EDP Sciences] [Google Scholar]
- Thieme, T. J., Lai, S.-P., Lin, S.-J., et al. 2022, ApJ, 925, 32 [NASA ADS] [CrossRef] [Google Scholar]
- Tinti, F., Bizzocchi, L., Degli Esposti, C., & Dore, L. 2007, ApJ, 669, L113 [NASA ADS] [CrossRef] [Google Scholar]
- Valdivia-Mena, M. T., Pineda, J. E., Segura-Cox, D. M., et al. 2022, A&A, 667, A12 [NASA ADS] [CrossRef] [EDP Sciences] [Google Scholar]
- Valdivia-Mena, M. T., Pineda, J. E., Caselli, P., et al. 2024, A&A, 687, A71 [NASA ADS] [CrossRef] [EDP Sciences] [Google Scholar]
- van Terwisga, S. E., & Hacar, A. 2023, A&A, 673, L2 [CrossRef] [EDP Sciences] [Google Scholar]
- Wang, K.-S., Simmonds, R., Comrie, A., et al. 2026, PASP, 138, 024506 [Google Scholar]
- Winnewisser, M., Winnewisser, B. P., & Winnewisser, G. 1985, NATO-ASI Ser. C, 157, 375 [Google Scholar]
- Zheng, Y.-Q., Wang, H.-C., Ma, Y.-H., & Li, C. 2021, RAA, 21, 188 [Google Scholar]
Common Astronomical Software Applications (CASA Team 2022): https://casa.nrao.edu/
Cube Analysis and Rendering Tool for Astronomy (Comrie et al. 2026; Wang et al. 2026): https://carta.almascience.nrao.edu/
Grenoble Image and Line Data Analysis Software (Gildas Team 2013): https://www.iram.fr/IRAMFR/GILDAS/
Appendix A: Source description
M512 (also known as [MGM2012] 512 or 2MASS J05401378-0732160) is a young stellar object located in the Lynds 1641 region of the Orion A molecular cloud at a distance of ∼420 pc, based on the Gaia DR3 parallax (p ∼ 2 38; Gaia Collaboration 2022). Although the source has been identified as young star with a disk (Megeath et al. 2012), Caratti o Garatti et al. (2012) classify it as a Class I based on the 2–25 μm spectral index (α2 − 25μm∼ 0.33;), with a stellar mass of 0.15 M⊙ and a luminosity of 0.9 L⊙ derived from SED modeling. Extended millimeter continuum and CO isotopologue emission surrounding the disk were first reported by Grant et al. (2021), revealing a large-scale elongated structure connected to the central source. The CO emission does not show clear signatures of outflow emission (through morphology and/or velocty structure) and it is primarily associated with the elongated structure, while the disk kinematics and orientation remain uncertain. The dust mass of the extended emission is estimated to be 65±32 M⊕, corresponding to about 50% of the disk mass; if this material belongs to an envelope, the envelope-to-disk mass ratio would be consistent with a Class I source (Jørgensen et al. 2009), although the disk mass may be underestimated due to optical depth effects. The origin of this elongated structure is uncertain. Grant et al. (2021) discussed several possible scenarios, including an envelope or accretion streamer, an outflow cavity wall, perturbations from a companion, or interaction with the parent cloud. They concluded that the detection of the structure in dust continuum implies the presence of relatively large grains and dense material, and that interaction between the young system and the surrounding cloud may play an important role. More recently, Cacciapuoti et al. (2024) modeled the structure as a streamer using C18O emission and derived a mass of ∼80 MJ and a high infall rate of 2 × 10⁻⁶ M⊙ yr−1, suggesting that, if fully accreted, this structure could significantly affect the disk and the protostar. However, the nature of the structure and the extent to which this material is effectively accreting onto the disk remain uncertain. In this context, studying the chemical structure of the elongated feature can provide important constraints on its physical origin and its role in the star-disk system. To place these properties in context, it is important to consider the larger scale environment in which M512 is embedded. M512 lies within the southern part of Orion A, an environment that contains numerous cavities and feedback-driven structures on (sub-)parsec scales. Although the field mapped by Feddersen et al. (2018) do not intersect this specific region, such structures illustrate that small-scale feedback is common across Orion A and may influence the local gas distribution around M512. Additionally, several A-B stars in L1641 contribute to a moderate FUV radiation field (van Terwisga & Hacar 2023), but no individual irradiating source can be uniquely associated with M512. The local radiation field seems to be relatively weak (< 10 G0) (van Terwisga & Hacar 2023). Additionally, Herschel 70 μm maps show no extended nebulosity around M512 (Grant et al. 2018), indicating the absence of strong local heating or illuminated cavity walls on ∼103 − 4 au scales. Furthermore, the source’s SED closely resembles that of a normal Class I protostar viewed at low inclination (Grant et al. 2018, with no excess emission that would suggest strong external irradiation. These FIR and SED characteristics imply that any environmental influence on the extended material must be relatively mild, acting primarily on the surrounding cloud rather than on the protostar itself. While this rules out strong photo-evaporation or intense shock heating, it remains consistent with a scenario in which moderate external compression, low-level FUV illumination, or larger-scale cloud dynamics shape the morphology and chemistry of the material surrounding M512.
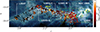 |
Fig. A.1. Herschel SPIRE observations at 250, 300, and 500 μm (background) overlapped with external FUV flux estimated map in the Orion A cloud from van Terwisga & Hacar (2023). The cyan stars mark possible ionizing stars in their vicinity and crosses show the Class II disks. Active star-forming regions and the location of the M512 protostar are indicated. The yellow circles show the CO shells identified by Feddersen et al. (2018) in the yellow square field. |
Appendix B: Channel maps of C18O and HCO+
The channel maps in Figure B.1 illustrate the kinematics of C18O and HCO+ around the M512 streamer. C18O emission is confined to a narrow velocity range (∼2.9–3.5 km s−1), tracing the densest parts of the structure, while HCO+ is more extended and peaks near the systemic velocity, indicating significant contribution from the surrounding envelope. Only a few channels show HCO+ emission coincident with the streamer, highlighting the difficulty of isolating the streamer in this tracer due to spectral dilution. These maps therefore demonstrate that C18O provides a cleaner probe of the streamer kinematics, while HCO+ is better suited for tracing the overall envelope, supporting its use as a complementary rather than primary tracer.
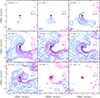 |
Fig. B.1. Kinematics of C18O (magenta) and HCO+ (blue) shown through channel maps. The synthesized beams are shown in the lower left corner. The velocity bins are depicted in the upper right corner. Contours are [3, 5, 7, 11, 15] σ for C18O with σ = 0.26 mJy beam−1 and [3, 5, 7, 11, 13, 15, 20, 25, 30] σ for HCO+ with σ = 5 mJy beam−1. |
Appendix C: Moment comparison of N2D+, DCO+ and C18O with dust emission
Figure C.1 shows the individual moment 0 maps of C18O, DCO+, and N2D+ over the same field as Figure 1(b). Displaying the tracers separately highlights their different spatial extents and relative offsets with respect to the dust continuum, which are discussed in detail in Sect. 3. These maps provide a complementary view to the overlaid representation shown in the main text.
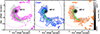 |
Fig. C.1. Same as Figure 1(b) but shown in separated panels for clarity. The green arrow represent the TIPSY stream-model trajectory for 0.15 M⊙ and vsys of 3.25 km s−1 from Cacciapuoti et al. (2024). |
Appendix D: Column densities and abundance ratio
The column densities were computed under the assumptions of Local Thermal equilibrium (LTE) and optically thin emission, using the integrated intensity (∫TbDv) of each line as (Mangum & Shirley 2015; Goldsmith & Langer 1999):
 (D.1)
(D.1)
where Ntot is the total column density, k, h the Boltzmann and Plank constants, c is the speed of light, ν is the line rest frequency, Aul, gu, Eu are the line spectroscopic parameters, and Q(Trot) is the partition function at rotational temperature, Trot.
Figure D.1 shows the map of the column density ratio of DCO+ and HCO+ (values in Section 3). We computed as well the column density of N2D+ and C18O using the same assumption of LTE and optically thin emission, in the 10–30 K temperature range. We found N(N2D+) of 3–8 1011 cm−2 and N(C18O) of 0.7–1.7 1014 cm−2 along the streamer.
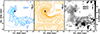 |
Fig. D.1. N(DCO+)/N(HCO+) column density ratio computed assuming 30 K (right panel) and using the moment 0 intensity map of HCO+ (middle panel in orange) and DCO+ (left panel in blue). Contours starts at 3σ with 3σ steps (σ = 0.32 mJy beam−1 km s−1) for DCO+ and 6σ steps (σ = 3 mJy beam−1 km s−1) for HCO+. Note that the ratio values represent an upper limit due to optical thickness and contamination of HCO+ (see text). Primary beam and beams are reported. |
All Tables
All Figures
|
Fig. 1. (a): HCO+ emission toward M512. Beam is in the lower right corner (b): Zoom-in on DCO+ (blue), N2D+ (orange) and C18O (magenta) moment 0, with 5σ dust continuum (gray) from Cacciapuoti et al. (2024). Separated maps are in Figure C.1. Dashed gray lines show the spatial profiles paths (Figure 2). Beams are the colored filled circles, and the solid lines the primary beams. The green arrow is the TIPSY stream-model trajectory from Cacciapuoti et al. (2024). Contours starts at 3σ with 2σ steps (σ = 0.32, 0.24, 0.22 mJy beam−1 km s−1 for DCO+ N2D+ and C18O, respectively), and 5σ steps for HCO+ (σ= 3 mJy beam−1 km s−1). |
| In the text | |
|
Fig. 2. Normalized continuum (gray), C18O (magenta), DCO+ (blue), and N2D+ (orange) profiles along 5 cuts across the streamer (Figure 1). Fluxes are averaged over 3 pixels; error bars are 3×3-pixel standard deviation. Offsets are relative to the C18O peak. |
| In the text | |
|
Fig. 3. Scheme of the proposed external feedback scenario shaping the M512 structure. N2D+ (blue), traces the cold outer regions, DCO+ (purple) the intermediate layer, and C18O (red) the warmer gas. The M512 protostar+disk is at the center. Arrows indicate feedback direction and the resulting velocity and temperature gradients. The figure is qualitative and not to scale. |
| In the text | |
|
Fig. A.1. Herschel SPIRE observations at 250, 300, and 500 μm (background) overlapped with external FUV flux estimated map in the Orion A cloud from van Terwisga & Hacar (2023). The cyan stars mark possible ionizing stars in their vicinity and crosses show the Class II disks. Active star-forming regions and the location of the M512 protostar are indicated. The yellow circles show the CO shells identified by Feddersen et al. (2018) in the yellow square field. |
| In the text | |
|
Fig. B.1. Kinematics of C18O (magenta) and HCO+ (blue) shown through channel maps. The synthesized beams are shown in the lower left corner. The velocity bins are depicted in the upper right corner. Contours are [3, 5, 7, 11, 15] σ for C18O with σ = 0.26 mJy beam−1 and [3, 5, 7, 11, 13, 15, 20, 25, 30] σ for HCO+ with σ = 5 mJy beam−1. |
| In the text | |
|
Fig. C.1. Same as Figure 1(b) but shown in separated panels for clarity. The green arrow represent the TIPSY stream-model trajectory for 0.15 M⊙ and vsys of 3.25 km s−1 from Cacciapuoti et al. (2024). |
| In the text | |
|
Fig. D.1. N(DCO+)/N(HCO+) column density ratio computed assuming 30 K (right panel) and using the moment 0 intensity map of HCO+ (middle panel in orange) and DCO+ (left panel in blue). Contours starts at 3σ with 3σ steps (σ = 0.32 mJy beam−1 km s−1) for DCO+ and 6σ steps (σ = 3 mJy beam−1 km s−1) for HCO+. Note that the ratio values represent an upper limit due to optical thickness and contamination of HCO+ (see text). Primary beam and beams are reported. |
| In the text | |
Current usage metrics show cumulative count of Article Views (full-text article views including HTML views, PDF and ePub downloads, according to the available data) and Abstracts Views on Vision4Press platform.
Data correspond to usage on the plateform after 2015. The current usage metrics is available 48-96 hours after online publication and is updated daily on week days.
Initial download of the metrics may take a while.