Open Access
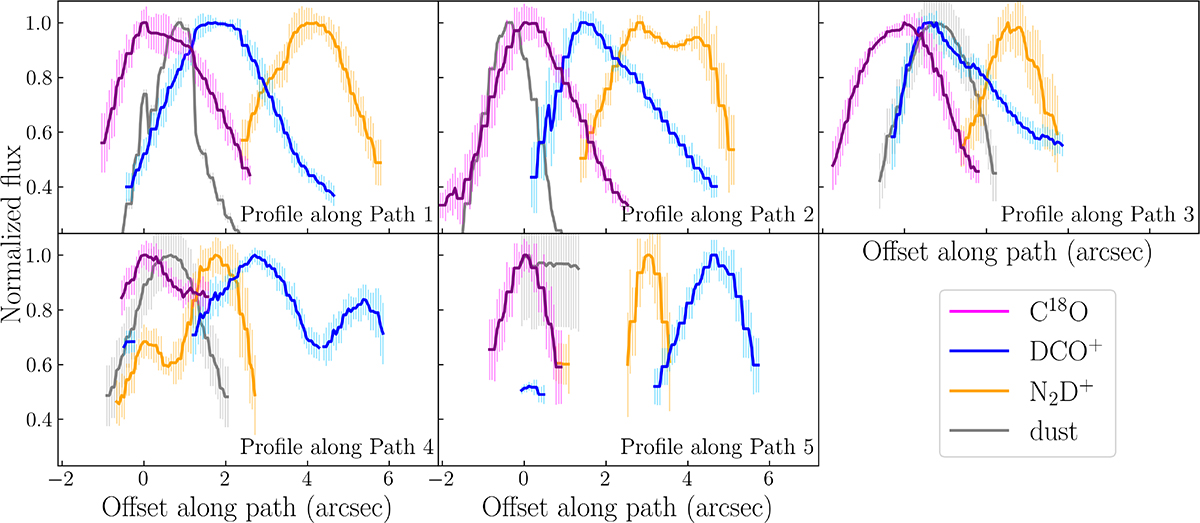
Fig. 2.
Download original image
Normalized continuum (gray), C18O (magenta), DCO+ (blue), and N2D+ (orange) profiles along 5 cuts across the streamer (Figure 1). Fluxes are averaged over 3 pixels; error bars are 3×3-pixel standard deviation. Offsets are relative to the C18O peak.
Current usage metrics show cumulative count of Article Views (full-text article views including HTML views, PDF and ePub downloads, according to the available data) and Abstracts Views on Vision4Press platform.
Data correspond to usage on the plateform after 2015. The current usage metrics is available 48-96 hours after online publication and is updated daily on week days.
Initial download of the metrics may take a while.