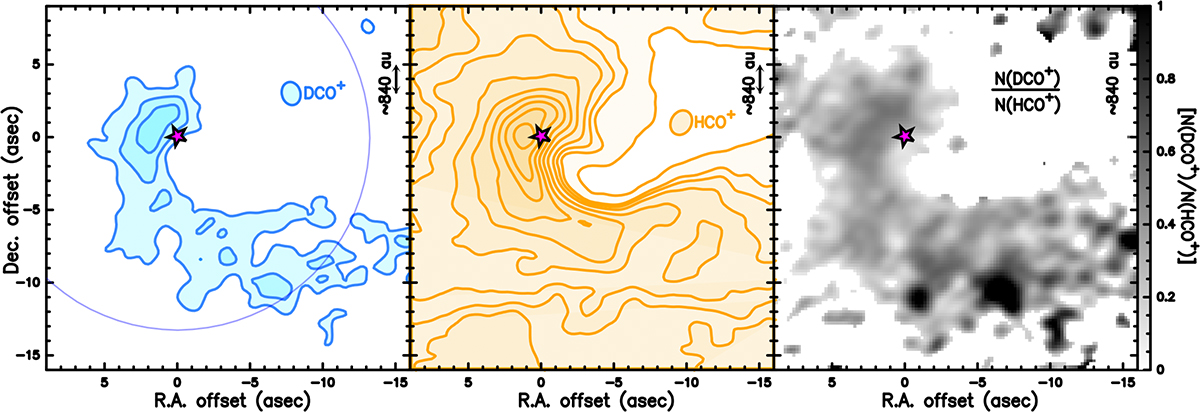
Fig. D.1.
Download original image
N(DCO+)/N(HCO+) column density ratio computed assuming 30 K (right panel) and using the moment 0 intensity map of HCO+ (middle panel in orange) and DCO+ (left panel in blue). Contours starts at 3σ with 3σ steps (σ = 0.32 mJy beam−1 km s−1) for DCO+ and 6σ steps (σ = 3 mJy beam−1 km s−1) for HCO+. Note that the ratio values represent an upper limit due to optical thickness and contamination of HCO+ (see text). Primary beam and beams are reported.
Current usage metrics show cumulative count of Article Views (full-text article views including HTML views, PDF and ePub downloads, according to the available data) and Abstracts Views on Vision4Press platform.
Data correspond to usage on the plateform after 2015. The current usage metrics is available 48-96 hours after online publication and is updated daily on week days.
Initial download of the metrics may take a while.