Fig. 1.
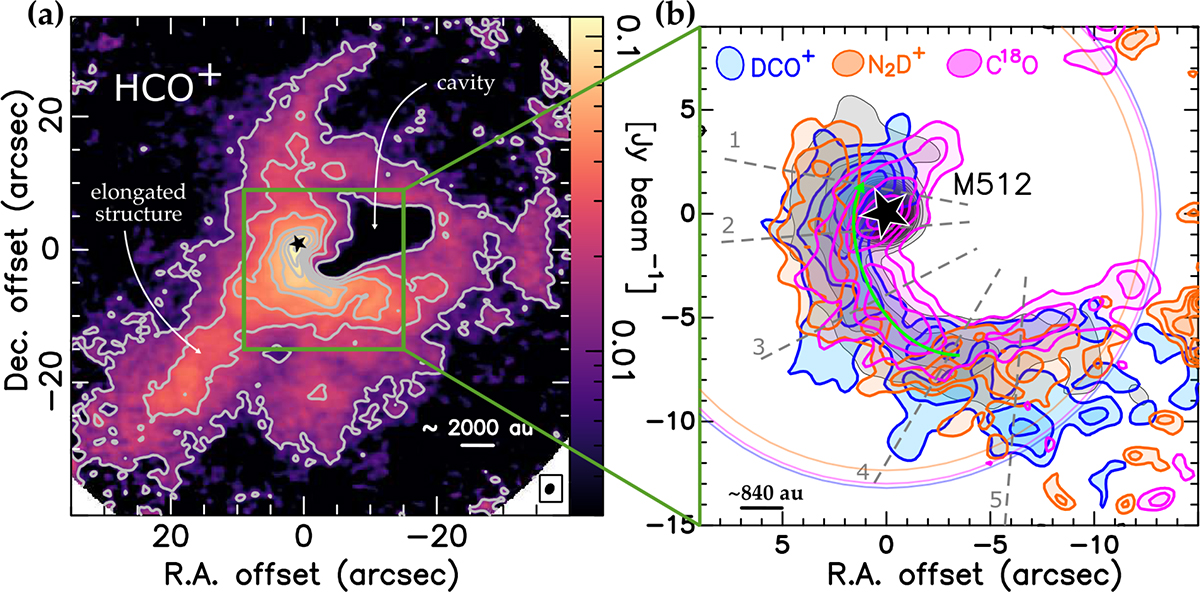
Download original image
(a): HCO+ emission toward M512. Beam is in the lower right corner (b): Zoom-in on DCO+ (blue), N2D+ (orange) and C18O (magenta) moment 0, with 5σ dust continuum (gray) from Cacciapuoti et al. (2024). Separated maps are in Figure C.1. Dashed gray lines show the spatial profiles paths (Figure 2). Beams are the colored filled circles, and the solid lines the primary beams. The green arrow is the TIPSY stream-model trajectory from Cacciapuoti et al. (2024). Contours starts at 3σ with 2σ steps (σ = 0.32, 0.24, 0.22 mJy beam−1 km s−1 for DCO+ N2D+ and C18O, respectively), and 5σ steps for HCO+ (σ= 3 mJy beam−1 km s−1).
Current usage metrics show cumulative count of Article Views (full-text article views including HTML views, PDF and ePub downloads, according to the available data) and Abstracts Views on Vision4Press platform.
Data correspond to usage on the plateform after 2015. The current usage metrics is available 48-96 hours after online publication and is updated daily on week days.
Initial download of the metrics may take a while.