| Issue |
A&A
Volume 709, May 2026
|
|
|---|---|---|
| Article Number | A212 | |
| Number of page(s) | 14 | |
| Section | Galactic structure, stellar clusters and populations | |
| DOI | https://doi.org/10.1051/0004-6361/202659349 | |
| Published online | 19 May 2026 | |
The multi-age stellar populations of Terzan 5 as revealed by JWST★
1
Dipartimento di Fisica e Astronomia, Università degli Studi di Bologna,
Via Piero Gobetti 93/2,
40129
Bologna,
Italy
2
INAF – Osservatorio di Astrofisica e Scienza dello Spazio di Bologna (OAS),
Via Piero Gobetti 93/3,
40129
Bologna,
Italy
3
Dept. of Astronomy, Indiana University,
Bloomington,
IN
47401,
USA
4
Institute for Astronomy, University of Edinburgh, Royal Observatory,
Blackford Hill,
Edinburgh,
EH93HJ,
UK
5
Department of Physics and Astronomy, UCLA,
430 Portola Plaza, Box 951547,
Los Angeles,
CA
90095-1547,
USA
6
European Southern Observatory,
Karl-Schwarzschild-Strasse 2,
85748
Garching bei Munchen,
Germany
7
Excellence Cluster ORIGINS,
Boltzmann-Strasse 2,
85748
Garching Bei Munchen,
Germany
★★ Corresponding author: This email address is being protected from spambots. You need JavaScript enabled to view it.
Received:
6
February
2026
Accepted:
30
March
2026
Abstract
The James Webb Space Telescope (JWST) provides an exciting opportunity to investigate stellar systems located in heavily obscured regions such as the Galactic bulge. Possibly the most enigmatic among them is Terzan 5; long classified as a globular cluster, it is now known to host distinct stellar populations with different iron abundances (ranging from approximately [Fe/H]=-0.8 to [Fe/H]=+0.3 dex). Indeed, the chemical and structural properties collected so far suggest that it is the remnant of one of the primordial clumps that contributed to the early assembly of the bulge, a so-called “Bulge Fossil Fragment.” Here we present a new photometric analysis of Terzan 5 based on JWST/NIRCam observations in the F115W and F200W filters, as well as archival HST/ACS optical (F606W and F814W) data. The dataset overcomes the severe and spatially variable extinction along the line of sight and yields the deepest color-magnitude diagram ever obtained for Terzan 5. Proper motion selections and high-resolution differential reddening corrections allowed us to isolate bona fide cluster members and to provide an unprecedented view of the main-sequence turn-off region. We clearly identify two main components and determine their respective ages: the old, sub-solar component has an age of 12.5 ± 0.5 Gyr, while the super-solar component is significantly younger with an age of 4.7 ± 0.5 Gyr. Interestingly, we also find hints of an even younger main sequence turn-off and sub-giant branch, consistent with the presence of a further stellar component with an age of 3.8 ± 0.5 Gyr. There is also evidence of a blue plume populated by stars as bright as mF115W ~ 17.4, suggesting a prolonged period of star formation extending up to 2.5 Gyr ago.
Key words: techniques: photometric / Hertzsprung-Russell and C-M diagrams / Galaxy: bulge / Galaxy: stellar content / globular clusters: individual: Terzan 5
Based on observations made with the NASA/ESA/CSA James Webb Space Telescope under program ID GO5502 (PI: Ferraro).
© The Authors 2026
 Open Access article, published by EDP Sciences, under the terms of the Creative Commons Attribution License (https://creativecommons.org/licenses/by/4.0), which permits unrestricted use, distribution, and reproduction in any medium, provided the original work is properly cited.
This article is published in open access under the Subscribe to Open model. This email address is being protected from spambots. You need JavaScript enabled to view it. to support open access publication.
1 Introduction
Terzan 5 stands out as one of the most enigmatic stellar systems in the Galactic bulge. Located at approximately 2 kpc from the Galactic center and obscured by severe and spatially variable extinction with an average color excess of E(B – V) = 2.38 ± 0.55 (Valenti et al. 2010; Massari et al. 2012), it has long been both alluring and challenging to observe. Among its notable characteristics are its unusually high mass - with published stellar-mass estimates of (2 ± 1) × 106 M⊙ (Lanzoni et al. 2010) and (1.09 ± 0.08) × 106 M⊙ (Baumgardt & Vasiliev 2021) - and the presence of the largest known population of confirmed millisecond pulsars in any Galactic globular cluster (GC), with the most recent count reaching 49 objects (Ransom et al. 2005; Cadelano et al. 2018; Padmanabh et al. 2024). Additionally, Terzan 5 displays the highest collision rate among Galactic GCs (Lanzoni et al. 2010). However, its most remarkable feature has emerged from extensive photometric and spectroscopic studies conducted over the last sixteen years, following the identification of at least two main stellar sub-populations characterized by distinct iron abundances (Ferraro et al. 2009; Massari et al. 2014; Origlia et al. 2011). Initially suggested by the presence of two clearly separated horizontal branches in the color-magnitude diagram (CMD; Ferraro et al. 2009), this was later confirmed by subsequent spectroscopic studies (Massari et al. 2014; Origlia et al. 2011, 2013, 2025), which revealed two major [Fe/H] peaks at −0.25 ± 0.07 and +0.27 ± 0.04 dex, alongside a third, less prominent component at [Fe/H] = −0.79 ± 0.04 dex. Such a broad, multi-peaked [Fe/H] distribution is unprecedented among Galactic GCs. Moreover, Terzan 5 shows no sign of an AlO anticorrelation (Origlia et al. 2011) as typically observed in GCs. The main metal-poor population was also found to be α-enhanced ([α/Fe] ≈ +0.34 dex), whereas the metal-rich component exhibits nearly solar abundances ([α/Fe] ≈ 0.03 dex; Origlia et al. 2011, 2013, 2019, 2025). The position of the knee in the [α/Fe]-[Fe/H] relation implies an early star-formation efficiency significantly higher than those of the Galactic halo (Helmi 2020), the Galactic disk (Haywood et al. 2018), and dwarf galaxies (Tolstoy et al. 2009). On the contrary, the chemical abundances measured from the entire high-resolution spectroscopic dataset acquired so far for Terzan 5 fully match the chemical pattern of the Galactic bulge itself (Origlia et al. 2025). This strongly supports a tight evolutionary link that points to a bulge in situ formation for Terzan 5. The first age estimates for Terzan 5’s sub-populations were obtained by Ferraro et al. (2016) using data acquired with the Hubble Space Telescope’s Advanced Camera for Surveys (HST/ACS) and the Multi-Conjugate Adaptive Optics Demonstrator (MAD) at the ESO Very Large Telescope (VLT). They successfully identified two distinct main-sequence turn-offs (MS-TOs) in the (K, I – K) CMD. A comparison with isochrones yielded ages of ∼12 Gyr for the metal-poor population and 4-5 Gyr for the metal-rich one. This confirmed that Terzan 5 underwent at least two significant periods of star formation separated by several gigayears. These ages are consistent with results obtained through star formation history studies, which indicate a major burst of star formation 12-13 Gyr ago responsible for roughly 70% of the current stellar mass, followed by additional events at cosmic times around 7 and 4 Gyr (Crociati et al. 2024). Further indication of the presence of the younger sub-population comes from variable star studies. Origlia et al. (2019) identified a long-period Mira variable whose radial velocity and chemical abundances are consistent with the super-solar population, as expected for a thermally pulsing asymptotic giant branch star arising from an intermediate-age component.
Substantial observational evidence has led to growing agreement that Terzan 5 does not fit the conventional definition of a GC, and numerous scenarios for the true nature of this system have been proposed in the literature. The notion identifying Terzan 5 with an accreted dwarf galaxy, in analogy to the case of ω Centauri (Bekki & Freeman 2003), is disfavored by the star formation rate (SFR) implied by the observed chemical pattern, since this is incompatible with the SFR of known dwarfs (Tolstoy et al. 2009). In addition, the reconstructed orbit of the system (Baumgardt et al. 2019; Baumgardt & Vasiliev 2021), with an apocenter of merely 2.8 kpc, strongly argues for an in situ origin (Massari et al. 2019; Callingham et al. 2022). Other mechanisms have been suggested, including the possibility of rare GC-GC mergers (Khoperskov et al. 2018; Mastrobuono-Battisti et al. 2019), but these fail to account for the extreme stellar mass of the sub-populations and for the young, metal-rich component, whose properties do not resemble those of any Galactic GC. The alternative scenario involving the interaction between a GC and a giant molecular cloud (hereafter GC+GMC; McKenzie & Bekki 2018; Bastian & Pfeffer 2022) can in principle trigger a secondary episode of star formation producing stars with features comparable to those of the second observed component. However, these events require fine-tuned conditions and cannot easily explain the presence of a third population or of an extended star formation period (see also the discussion in Dalessandro et al. 2022). Furthermore, the large population of millisecond pulsars requires many type II supernova explosions in a deep potential well to form and retain neutron stars. These conditions arise naturally in scenarios of bulge-like (i.e., high star formation rate) enrichment within a very massive primordial system. In turn, these properties, combined with the high collision rate observed in Terzan 5 (Lanzoni et al. 2010), can explain the formation of many millisecond pulsars through an efficient recycling of old neutron stars. Taken together, these pieces of evidence seem to converge toward the interpretation that Terzan 5 is the remnant of a massive primordial structure that contributed to the early formation of the Galactic bulge - a Bulge Fossil Fragment (BFF; Ferraro et al. 2021). This view links Terzan 5 to theoretical frameworks of bulge formation through the early fragmentation of gas-rich, turbulent disks. When efficient gas cooling is present, gravitationally unstable disks are expected to break into massive clumps ranging from 108 to 109 M⊙ (Immeli et al. 2004). Observational data for such clumps have been obtained across redshifts from z ∼ 1-10; HST has revealed turbulent disks hosting stellar clumps with masses reaching up to 109 M⊙ at z ∼ 1-5 (Elmegreen et al. 2008; Bournaud & Elmegreen 2009; Genzel et al. 2011), while the James Webb Space Telescope (JWST) has uncovered similar structures at z ∼ 10 (Messa et al. 2024; Adamo et al. 2024). While simulations predict that most clumps migrate inward and merge to form the bulge (Ceverino et al. 2010), a small fraction may survive (Bournaud 2016). Terzan 5 may represent one such survivor, which avoided destruction by remaining in the bulge’s outskirts and thus retained supernova ejecta and triggered subsequent star formation episodes through dynamic interactions with bulge substructures such as the bar. Terzan 5 does not appear to be a unique case. Liller 1, another massive system (M ≈ 1.5 × 10⁶ M⊙; Saracino et al. 2015) traditionally cataloged as a GC and located at about 0.8 kpc from the Galactic center, exhibits remarkably similar properties: multiple stellar populations spanning an age interval from 1-3 Gyr to 12 Gyr (Ferraro et al. 2021; Dalessandro et al. 2022), a metallic-ity range of ∼1 dex (Crociati et al. 2023) with an α-enhanced old component and solar-scaled young population (Alvarez Garay et al. 2024; Fanelli et al. 2024), and chemical patterns matching the bulge field (Ferraro et al. 2025).
Improving our understanding of Terzan 5 is thus crucial for providing observational benchmarks to guide future theoretical endeavors to explain the formation of BFFs and galactic bulges. The accurate reconstruction of the formation history of BFFs is also crucial to properly estimate the overall amount of compact objects generated during their evolution, which makes these primordial building blocks of galaxy bulges the most likely efficient factories of gravitational wave sources in spirals (see Ferraro et al. 2026b).
Previous datasets were limited by severe extinction, differential reddening and crowding, restricting age analyses to small subregions such as the 600 arcsec2 field of view (FoV) used in Ferraro et al. 2016. JWST, with its high performance capabilities at near-infrared (NIR) wavelengths, presents an exciting new opportunity to study Terzan 5’s stellar populations and obtain a deeper, global, and minimally reddening-affected CMD.
As first result of the JWST exploration of Terzan 5, here we present the deepest and highest-quality CMD ever obtained for this system. The proper motion cleaned and differential reddening corrected CMD provided an unprecedented view of the MS-TO region and allowed us to further investigate the star formation history of this stellar system, revealing that it is even more complex than previously thought.
This paper is organized as follows. In Sect. 2, we describe the dataset and the photometric reduction procedures. Section 3 is devoted to the proper motion computation and the assessment of cluster membership. In Sect. 4, we present the adopted method for differential reddening correction. The isochrone fitting technique and age determination through the MS-TO are presented in Sect. 5. Finally, in Sect. 6 we summarize the main results and discuss their implications.
2 Data analysis
2.1 Dataset
The photometric analysis of Terzan 5 presented in this work relies on a combination of space-based NIR and optical data, which are summarized briefly here. The primary dataset consists of observations obtained with JWST using the Near-Infrared Camera (NIRCam). NIRCam is composed of two identical modules (A and B), each covering a 2.2′ × 2.2′ FoV. In each module, four short-wavelength (SW) detectors with a pixel scale of 0.031″/pixel and one long-wavelength (LW) detector with 0.062″/pixel can operate simultaneously, enabling parallel acquisition in multiple filters. The observations targeting Terzan 5 (proposal ID: GO 5502, PI: F. Ferraro; see Fig. 1) were collected in two epochs. During the first epoch (2024), observations were obtained in both the F115W and F200W SW filters, while the second epoch (2025) consisted exclusively of F115W imaging. The simultaneous LW detector images acquired in filters F277W and F356W were not used for the analysis presented here. We also excluded exposures acquired with chip A of NIR-Cam as they sample the outskirts of the system and do not overlap with the HST images’ FoV. Both BRIGHT2 and RAPID readout patterns were employed to combine deep and short integrations, ensuring optimal sampling of the magnitude range, from the faintest to the brightest stars.
We also made use of archival optical HST observations obtained with the ACS Wide Field Channel (WFC), retrieved from the Mikulski Archive for Space Telescopes (MAST). The WFC provides a 0.05″/pixel resolution and a 202″ × 202″ FoV. The archival observations span three epochs - 2003 (proposal ID: SNAP 9799, PI: Rich), 2013 (proposal ID: GO 12933, PI: Ferraro), and 2015 (proposal ID: GO/DD 14061, PI: Ferraro) - all in the F606W and F814W filters. Their main purpose is to provide complementary optical coverage and offer multiple observational epochs over a long temporal baseline to compute proper motions. The illustration of the FoV coverage of the JWST and HST datasets is shown in Fig. 2. A complete summary of the observational data employed in this work is provided in Table 1.
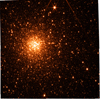 |
Fig. 1 JWST/NIRCam mosaic of Terzan 5 obtained with module B in the F115W filter (composite of all dithered exposures from SW detectors onto a common grid). |
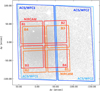 |
Fig. 2 Illustration of FoV coverage for the dataset of observations of Terzan 5 used in this work. Gray dots represent stars detected in the optical filters. Blue rectangles show the HST/ACS field of view for the first two epochs (SNAP 9799, PI: Rich; GO 12933, PI: Ferraro), while light blue rectangles indicate the third epoch (GO/DD 14061, PI: Ferraro). Red rectangles mark the JWST/NIRCAM module B SW detector boundaries from the first observing cycle (GO 5502, PI: Ferraro, 2024), and orange rectangles show the corresponding fields from the second cycle (GO 5502, PI: Ferraro, 2025). Each of the FoVs shown here corresponds to the pointing of the first exposure in each dataset. All coordinates are expressed as projected offsets in arcseconds (Δx, Δy) relative to the center of Terzan 5 (αJ2000 = 17h48m4.85s, δJ2000 = -24°46′44.6″; Lanzoni et al. 2010). |
2.2 Pre-reduction procedures: the JWST calibration pipeline
The NIR dataset was retrieved from the JWST MAST archive in its uncalibrated (uncal) format. This choice allowed us to fine-tune specific parameters of the JWST Science Calibration Pipeline (Bushouse et al. 2025) to better suit the requirements of our science case. In particular, we modified some Stage 1 processing steps, where the detector-level corrections were applied to ensure an accurate estimation of the flux recorded in each pixel. The most significant adjustment consisted of the recovery of information collected during the first segment of each exposure (“Frame 0”). In this frame the level of saturation is modest and limited to the brightest stars; this allows the measurement of stars along the entire red giant branch and up to one magnitude above the horizontal branch level. As a result, valuable information is preserved in high-signal regions, such as the most crowded central areas of the stellar system, that would otherwise be lost. Particular care was also devoted to the stage of the pipeline that handles the correction of “snowball” artifacts induced by cosmic-rays. After extensive testing, the parameter “expand_large_events” was set to “False” to prevent the misidentification of saturated stellar cores as snowballs, which produced spurious artifacts in the crowded field of Terzan 5 (an issue also denoted in Regan 2024). The subsequent Stage 2 of the pipeline was applied to each exposure without significant modifications. This performed sky background subtraction, flat-field and flux calibration, and it assigned the World Coordinate System information. For compatibility with DAOPHOT, the flux values that the pipeline expresses in mJy/sr were converted first to DN/s and then multiplied by the single frame time of 10.74 s to obtain raw counts. All images were also corrected using the pixel area map (PAM), which is stored in a dedicated extension of the calibrated data products, to account for variations in projected pixel size across the detector. The resulting calibrated and corrected images constituted the input for the photometric analysis. Optical HST/ACS images were downloaded in the _flc format, meaning calibrated, flat-fielded, and Charge Transfer Efficiency (CTE)-corrected single exposures. They required the application of the PAM correction, which was done using “stsci.skypac” and the contained function “pamutils.pam_from_file.”
JWST/NIRCam and HST/ACS datasets used in this work, including observational epochs, filters, number of exposures and readout modes (if appropriate), and exposure times.
2.3 Photometric analysis
The photometric reduction was performed through a dual approach designed to maximize the potential of the dataset, using two independent software packages. The main analysis was carried out using the DAOPHOT II package (Stetson 1987, 2011). For each individual image in both the JWST and HST datasets, an optimal point spread function (PSF) model was constructed from bright, isolated stars using the PSF routine. These were subsequently applied to each exposure using ALLSTAR to measure instrumental magnitudes for all sources detected 3σ above the local background. To generate a comprehensive catalog of detected sources, we first produced six independent source lists, one for each filter-instrument combination (F606W/WFC1, F814W/WFC1, F606W/WFC2, F814W/WFC2, F115W/NIRCam, and F200W/NIRCam). They were produced using DAOMASTER, retaining only sources detected in at least four individual frames within each dataset. Geometric transformations among these sub-catalogs were derived and used to report them all onto a common reference frame corresponding to the ACS/WFC1 detector scale. Using DAOMASTER we crossidentified sources across epochs and instruments to produce one single master list including every star detected in at least one of the available subsets. This master list served as the input for the ALLFRAME algorithm, which automatically detects and fits each of these sources in the individual exposures across all epochs and filters. At this stage, the joint use of optical and NIR data in the creation of a common master list proved to be particularly effective. The greater depth of the JWST observations enables detection of faint sources, providing information on their position and magnitude, which improves their recovery and the treatment of blends in the HST photometry. In addition, the spatial resolution and wavelength range of the HST images are better suited for bright stars close to saturation in the NIR data. Overall, the complementary behavior of stars at different wavelengths, combined with the use of a single master list, leads to a more robust PSF fitting and enhances the reliability of the final photometry in all the four filters. The resulting files containing positions and magnitudes of the fitted sources for each image were then organized again into filter-specific groups, following the same subdivision and requirements adopted for the initial subsets. This approach was already adopted in the study by Cadelano et al. (2023) and will be fully described in Pallanca et al. (in prep.). This last step gave the final magnitude values in each filter, homogenized to the reference frame of the first image in each subset. Once these sub-catalogs had been produced, they were cross-matched and merged into a single catalog containing all four filters. In this final DAOMASTER run, sources were retained only if they had valid measurements in at least two filters.
The JWST images were also independently reduced with the jwst1pass photometric pipeline, an adaptation of the hst1pass code originally developed for HST and recently extended to JWST (Anderson 2022; Libralato et al. 2023). This complementary reduction was specifically aimed at recovering reliable fluxes for bright stars approaching the nonlinear or partially saturated regime of the NIRCam detectors, where standard PSF fitting through DAOPHOT becomes unreliable. The jwst1pass pipeline makes use of empirical NIRCam ePSFs (Nardiello et al. 2023) and applies a perturbation procedure (as described in Anderson & King 2006; Anderson et al. 2008; Nardiello et al. 2018) in which isolated bright stars in each image are used to erive specific corrections to the library models. This procedure enables accurate photometry even for stars with mild saturation. Positions and fluxes of stars were thus extracted, and multiple images were combined through the iterative use of the xym2mat and xym2bar routines (see Anderson & King 2006; Anderson et al. 2008). Up to this stage, magnitudes obtained from different SW detectors were kept separate. The resulting four sub-catalogs were then transformed onto a common frame, adopting the B1 chip as reference.
Vegamag Zero Point values for NIRCam and ACS recovered from the NIRCam documentation STScI (2024b) and the ACS Zeropoint Calculator STScI (2024a).
2.4 Photometric and astrometric calibrations
Both catalogs were calibrated onto the Vegamag photometric system. For the DAOPHOT-based reductions, instrumental magnitudes were corrected using the Zero Points associated with the reference detector of each filter (Table 2) and adjusted for the corresponding exposure time (340 s for HST and 10.74 s for JWST reference frames). Aperture corrections were derived as the mean difference between PSF and aperture magnitudes measured with the PHOTO routine, and the missing flux outside the adopted aperture was accounted for using the encircled energy corrections (JWST Science Calibration Pipeline Team 2024, Bohlin 2016). Geometric distortion effects were corrected following the prescriptions of Bellini et al. (2011).
Fluxes measured with jwst1pass were first converted from MJy sr−1 to DN s−1, and we then calibrated the four sub-catalogs corresponding to the NIRCam SW detectors using their individual Vegamag Zero Points. Measurements of stars detected in multiple chips were averaged to yield a single photometric estimate per source. Aperture and encircled-energy corrections were then computed in the same way as for the DAOPHOT photometry. Since jwst1pass internally applies geometric-distortion corrections as part of its astrometric solution, no further distortion correction was required. For both catalogs, we obtained the final astrometric calibration by matching common stars with Gaia DR3 (Gaia Collaboration 2023) using the CataXcorr software (Montegriffo et al. 1995). Finally, the two independently calibrated and astrometrized catalogs were then merged and used jointly for the subsequent analysis.
2.5 CMDs of Terzan 5
Once calibrated, the catalog could be employed for the construction of preliminary CMDs associated with optical and NIR magnitudes. A comparison of these diagrams is shown in Fig. 3. To ensure high-quality photometry in the CMDs, we applied dedicated selection criteria to the HST and JWST datasets. For the DAOPHOT reductions, we only retained sources with sharpness, χ2, and magnitude errors consistent with well-fit point sources. These selections were performed through σ-clipping, with the acceptable values traced via spline interpolation in successive magnitude bins. For the jwst1pass photometry, we relied on the photometric error and on the quality parameter QFIT, which measures the goodness of the PSF fit; well-measured point sources cluster around QFIT ≈0, and we therefore retained stars with QFIT <0.3 in the final CMDs. An exception was made for stars whose magnitudes were recovered through the dedicated procedure for partially saturated sources, for which the pipeline automatically assigns large QFIT values; in these cases no stringent QFIT-based cut was applied.
In constructing the CMDs, we made use of both catalogs, with the goal of exploiting the respective advantages of the different reduction methods. After applying the described photometric quality criteria, we compared the source recovery of the DAOPHOT and jwst1pass reductions as a function of magnitude. In the MS-TO region, which is the primary focus of this work and corresponds to 18 < mF115W < 19.5, the DAOPHOT catalog contains ≈30% more stars than the jwst1pass one. This reflects the advantages of the strategy implemented with DAOPHOT at faint magnitudes in crowded environments, where the joint use of the JWST and HST datasets improves source recovery especially in the central regions. At brighter magnitudes along the red giant branch (RGB; mF115W ≳ 18) region, the number of recovered sources becomes comparable, while approaching mF115W ≈ 16, corresponding to the HB level, saturation starts affecting the DAOPHOT measurements. Instead, the jwst1pass reduction remains reliable at these regimes, and we therefore adopted jwst1pass photometry for saturated sources, while using DAOPHOT measurements elsewhere.
The comparison between the two panels in Fig. 3 emphasizes the complementary nature of the datasets and the significant advantage offered by the new NIR observations. JWST confirms its capability of resolving and providing accurate measurements of much fainter magnitudes along the MS, extending beyond the MS knee. The JWST/NIRCam diagram is by far the deepest CMD ever obtained for Terzan 5, with the previous ones (Ferraro et al. 2016) reaching just 1-2 magnitudes below the MS-TO point corresponding to mF115W ∼ 21. This newly obtained CMD is thus at least four magnitudes deeper than any previous result. Moreover, the joint reduction with the HST images resulted in an improvement of the optical photometry itself.
3 Proper motions
Terzan 5 lies in a highly crowded region in the bulge direction, which results in significant contamination from stars belonging to the disk and bulge along the line of sight. An effective method to identify genuine Terzan 5 members and decontaminate the CMD from Galactic field interlopers is to rely on proper motion analysis. The combination with the HST dataset proved to be crucial at this stage, providing a total temporal baseline of more than 20 years.
The first step of the analysis in the adopted procedure was the precise determination of stellar centroid positions. Centroids were extracted from the PSF-fitting results of the photometric reduction, as provided in the output files of the ALLFRAME routine. JWST coordinates were rectified and transformed onto a common reference system using the routine by Griggio et al. (2023), while HST data were corrected with the solution by Bellini et al. (2011). The images were then grouped by epoch and filter and aligned to the respective reference frames using CataXcorr. For each detection, the relevant quantities - position, magnitude, error, χ2, and sharpness - were retained, and a quality selection similar to the one previously explained was applied to select only well-measured stars. For each epoch, the sources satisfying these criteria were used to compute the mean (x, y) positions and associated uncertainties, taken as the standard deviation. When two valid position measurements from different filters were available for the same epoch, their average value was adopted. Mean stellar positions in detector coordinates were then matched and transformed into a common reference frame, defined by the first-epoch ACS/WFC1 image, which covers the central region of the system. The alignment was performed with CataXcorr in two steps: an initial transformation limited to first-order terms established a robust preliminary match among catalogs; then a higher order polynomial transformation was used to refine the solution and maximize the number of matched stars. Proper motions were derived by performing weighted linear fits of stellar positions as a function of time, using the modified Julian Dates (MJD) of each observational epoch. The fits were computed for the x and y directions and weighted by the positional uncertainties, considering only stars with at least two valid measurements across the available epochs. To ensure robustness, only proper motions derived from temporal baselines exceeding three years were retained, since shorter intervals - such as those involving only the two JWST epochs -are more affected by positional uncertainties. The resulting displacements (μx, μy) were converted into units of mas/yr using the appropriate pixel scale and associated with stars from the main catalog through cross-matching with CataXcorr. To separate cluster members from field interlopers, we analyzed the distribution of the total proper motion,  , in the vector point diagram (VPD) in separate F814W magnitude bins, where δμx and δμy are the x and y components relative to the mean cluster proper motion. Since proper motions were computed in the cluster’s reference frame, the distribution of μ is expected to be centered around zero for Terzan 5 members. Within each magnitude bin, an iterative 3σ-clipping procedure was applied to the μ distribution to exclude outliers and retain only stars consistent with the systemic motion of the cluster. The proper motion analysis was implemented through a two-stage approach. After this first iteration, which identified a preliminary sample of likely cluster members, we used the latter as a reliable reference frame for a second iteration of the procedure. This last step led to the final proper motion computation and membership selection. The results of this selection are illustrated in Fig. 4, which shows the VPDs for the adopted magnitude bins. Because the proper motion measurements rely on the availability of a valid mF814W or mF606W magnitude to guarantee multi-epoch coverage, stars detected only in the NIR do not have associated proper motions. This results in the sharp faint-end truncation observed in the NIR-membership-selected CMD of Fig. 4, where sources lacking an optical counterpart cannot be assigned a membership flag.
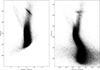 |
Fig. 3 (mF814W, mF606W - mF814w) and (mF115W, mF115W - mF200W) CMDs for Terzan 5 obtained from the joint catalog of HST and JWST datasets. This bipanel visualization highlights the complementary wavelength coverage of optical (left panel) and NIR (right panel) data for studying systems such as Terzan 5. |
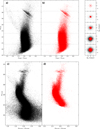 |
Fig. 4 Proper motion selection of Terzan 5 members. Panels a and b: optical CMDs (mF606W - mF814W, mF814W). Panels c and d: NIR CMDs (mF115W - mF200W, mF115W). The left panels in each row show all the stars that satisfy the photometric-quality criteria in black, while panels b and d highlight only those classified as likely cluster members from the proper motion analysis in red. The horizontal dashed lines mark the mF814W magnitude bins adopted in the proper motion selection. The panel in the upper right shows the corresponding VPDs for each magnitude interval: in each subpanel, the red dots mark stars retained as members and the black dots indicate rejected (Galactic field) sources. The effectiveness of the proper motion membership selection is clearly demonstrated by the rejection of Galactic field MS stars drawing the evident blue plume (bluer and brighter than Terzan 5’s MS-TO) in panels a and c. |
4 Differential reddening
Being located in the bulge, Terzan 5 is affected by severe and spatially variable extinction along the line of sight (Massari et al. 2012). This translates to position-dependent shifts of stars within the CMD because of significant variations of the local E(B – V) with respect to the mean value associated with the system. This produces an apparent broadening of the evolutionary sequences along the direction of the reddening vector. A precise treatment of differential reddening is thus essential for a detailed photometric analysis. Differential reddening in Terzan 5 has already been addressed in previous works from our group using different observational datasets (Massari et al. 2012; Crociati et al. 2024). Nevertheless, the availability of the new JWST observations -providing NIR depth, reduced extinction effects, and a larger spatial coverage compared to the MAD FoV - calls for an independent determination of the differential reddening correction. Typically, the wavelength-dependent effect of interstellar extinction is described by laws such as those of Cardelli et al. (1989); Fitzpatrick & Massa (1990); O’Donnell (1994), in which the extinction ratio RV = AV/E(B – V) regulates the slope of the attenuation curve. While a “canonical” value of RV = 3.1 characterizes the diffuse Galactic interstellar medium along most lines of sight within the Galaxy (Sneden et al. 1978), several studies have shown that lower values (corresponding to steeper extinction laws) are more appropriate in the bulge direction (e.g., Udalski 2003; Nataf et al. 2013; Alonso-García et al. 2017; Pallanca et al. 2021a). Dedicated tests and simultaneous isochrone fitting to the optical and the NIR CMDs show that this is also the case for Terzan 5. Indeed, under the assumption of the standard value (RV = 3.1) isochrones only provide a reasonable fit to the NIR CMD; they fail to reproduce the optical one (see the black lines in Fig. 5) due to the wavelength dependence of the extinction law. In agreement with previous analyses of star clusters in the bulge (see Pallanca et al. 2021a,b), a consistent match across all bands can be achieved only by assuming RV = 2.5 (see the red lines in Fig. 5). Using the O’Donnell (1994) extinction law leads to extinction coefficients RF606W = 2.297, RF814W = 1.433, RF115W = 0.732, and RF200W = 0.305.
Assuming these values, we followed the method of Pallanca et al. (2021a, see also references therein), and we computed the differential reddening correction for Terzan 5. The procedure first builds the mean ridge line (MRL) of each CMD by determining the average locus of selected samples of high photometric quality and confirmed member stars along the MS, sub-giant branch (SGB), and RGB. These MRLs provide the fiducial reference against which reddening deviations are measured. For each individual source, we then considered a local sample of nearby reference cluster stars. These stars are required to satisfy quality criteria analogous to those described in the previous section. A grid of trial differential color excess values of δE(B – V) was applied to the reference stars; for each trial value, the CMD positions of the local sample were compared to the MRL, and a distance metric, quantifying residual deviations from the intrinsic MRL, was computed. The optimal value of δE(B - V) is defined as the one that minimizes this distance and is then converted into magnitude corrections using the adopted extinction coefficients. By construction, this procedure yields a star-by-star differential reddening estimate, with the highest angular resolution (below 1" ) in the center, which progressively decreases to −3"-4" in the more external regions due to lower local density. The resulting two-dimensional reddening maps, constructed independently for the NIRCam and ACS datasets, are shown in Fig. 6. Both maps reveal a patchy and spatially variable dust distribution across the FoV, with colorexcess variations spanning a total range of ΔE(B - V) − 0.8 mag (from approximately -0.4 to +0.4 mag relative to the mean extinction characterizing the adopted MRL). Despite the different wavelength regime and stellar sampling, the maps display consistent morphology in the overlapping area. In the central region of the system, the same large-scale reddening structures and local maxima and minima are recovered by both datasets. A prominent morphological feature close to the system’s center is evident in both maps: an elongated, filamentary structure of extinction δE(B – V) − 0.3-0.4. This consistency strongly validates the robustness of the differential reddening correction method. The total amplitude of differential reddening is comparable to that observed in other heavily extincted bulge clusters such as Terzan 6 (ΔE(B – V) − 0.8 mag ; Loriga et al. 2025), Liller 1 (ΔE(B – V) − 0.5 mag; Pallanca et al. 2021a), and NGC 6256 (ΔE(B – V) − 0.5 mag; Cadelano et al. 2020), confirming that Terzan 5 lies in one of these challenging directions for photometric studies in the inner Galactic bulge. The obtained values of differential extinction were used to correct the magnitudes of each star, leading to significantly tightened stellar sequences in all CMDs (see Fig. 7). The proper-motion-selected and differential-reddening-corrected CMDs shown in the right panels are those used in all subsequent steps of this analysis, as they best reproduce the intrinsic features of the evolutionary sequences.
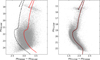 |
Fig. 5 Effect of different assumptions of the RV parameter on the isochrone position in the CMDs. The dashed black line is the 12.5 Gyr isochrone (Bressan et al. 2012) that best fits the NIR CMD (right panel) under the assumption of the (O’Donnell 1994) extinction law with the standard value RV = 3.1, requiring E(B - V) = 2.08. Clearly, this isochrone is unable to also match the optical CMD (see the dashed black line in the left panel). The solid red line is the same isochrone plotted assuming the same extinction law, but adopting RV = 2.5: it clearly simultaneously reproduces both the NIR and the optical CMDs well, with E(B - V) = 2.86. |
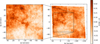 |
Fig. 6 Differential reddening maps derived from JWST/NIRCam (left) and HST/ACS (right) photometry. Both panels show the spatial distribution of δE(B - V) across the respective FoVs. The coordinates Δx and Δy (in arcseconds) indicate the angular offsets from the center of the system. The color-scale traces variations in δE(B - V) with respect to the mean value, highlighting the highly patchy and non-uniform extinction pattern affecting the region. |
5 Age determination
5.1 Constraining the color excess and distance modulus
Isochrone fitting in a complex system hosting numerous distinct populations is intrinsically challenging. For this reason, we attempted to simplify the problem by developing a twostep procedure. In the first step, we aimed to constrain global parameters characterizing all the populations, such as the mean extinction (E(B - V)) and the distance modulus (μ0). To this aim, we selected isochrones from the PARSEC (Bressan et al. 2012; Tang et al. 2014; Chen et al. 2015) stellar evolution library, spanning ages and metallicities consistent with those reported in the literature for the oldest (12-13 Gyr) sub-solar population (see Ferraro et al. 2009; Ferraro et al. 2016; Massari et al. 2014; Origlia et al. 2025). The isochrones were then shifted in magnitude and color by adopting the O’Donnell (1994) extinction law with RV = 2.5 and assuming several trial pairs of values for E(B - V) and μ0. These quantities were treated as free parameters together with age and metallicity. The models were compared to the data through a χ2 metric in the CMD, computed as
![Mathematical equation: \chi^2 \;=\; \sum_i \min_j \Bigg[ \begin{pmatrix} \Delta C_{ij} & \Delta J_{ij} \end{pmatrix} \begin{pmatrix} \sigma_{K,i}^{-2} & -\sigma_{K,i}^{-2}\\[2pt] -\sigma_{K,i}^{-2} & \dfrac{\sigma_{J,i}^2+\sigma_{K,i}^2}{\sigma_{J,i}^2\,\sigma_{K,i}^2} \end{pmatrix} \begin{pmatrix} \Delta C_{ij}\\[2pt] \Delta J_{ij} \end{pmatrix} \Bigg],](/articles/aa/full_html/2026/05/aa59349-26/aa59349-26-eq2.png) (1)
(1)
where ΔCij and ΔJij are the color and F115W magnitude differences between the i-th star and the j-th point along the isochrone, and  are the photometric error variances in the F115W and F200W magnitudes for that star, respectively. The fitting procedure was carried out simultaneously on optical, NIR, and hybrid CMDs, considering the whole extent of the evolutionary sequences. This approach exploits the distinct reddening and luminosity sensitivity of each dataset, thus reducing degeneracy between age, metallicity, reddening, and distance. Exploring the parameter space across a dense grid of color excess and distance modulus values yielded the overall best-fitting solution, corresponding to E(B - V) = 2.86 and μ0 = 14.15. These values were subsequently fixed and adopted for all stellar populations in the second step of the analysis, where the ages of the individual sub-populations were independently determined using the MS-TO. Although the resulting extinction is slightly different from some literature estimates (see Valenti et al. 2010, Massari et al. 2012), the discrepancy is expected given the adoption of a different extinction law. The derived distance modulus, on the other hand, is fully consistent with the recent independent estimate for Terzan 5 (d = 6.78 ± 0.22 kpc, corresponding to μ0 = 14.15) obtained with the latest Gaia DR3 data (Baumgardt & Vasiliev 2021).
5.2 A new age estimate for Terzan 5's sub-populations
Having fixed the extinction and distance modulus, we proceeded to derive the ages of the stellar populations hosted in Terzan 5. The analysis was carried out on the NIR CMD that has the best quality at the MS-TO level. The presence of two clearly distinct MS-TOs can be appreciated in unprecedented detail in the left panels of Figs. 8 and 9. To reduce blend contamination, we only considered stars in an annular region located between 10″ and 40″ from the system’s center. In addition, stringent cuts were applied to the sharpness parameter to further suppress residual contamination from unresolved blends (Stetson 1987). For quantitative age estimates, we adopted the isochrone fitting technique, searching for the isochrones that best reproduce the observed MS-TO and SGB region of the two main sub-populations of Terzan 5, as drawn by member stars included within appropriate selection boxes in the differential-reddening-corrected NIR CMD (see the left panel of Fig. 8). We first extracted isochrones of different ages (with a 0.1 Gyr step) from the PARSEC (Bressan et al. 2012) database by adopting metallicities consistent with the spectroscopic measurements for the two main components of the system ([Fe/H]≈ - 0.3 and [Fe/H]≈ + 0.3; Massari et al. 2014; Origlia et al. 2011). We therefore assumed Z = 0.0077, Y = 0.26 for the sub-solar population and Z = 0.03, Y = 0.29 for the super-solar one (with the adopted values of the helium abundance following the standard enrichment scenario; Girardi et al. 2002). Each model was then shifted according to the derived best-fit values of E(B - V) and μ0 (Sect. 5.1), and we used the χ2 test to identify the isochrones that best fit the data.
The resulting χ2 versus age profiles (Fig. 10) exhibit well-defined minima, yielding two distinct best-fitting solutions: an old population with an age of 12.5 ± 0.5 Gyr and a younger population with an age of 4.7 ± 0.5 Gyr. The formal statistical uncertainties from the parabolic fit to the χ2 profile are, respectively, ±0.02 Gyr and ±0.01 Gyr. The final quoted uncertainties conservatively take into account this statistical error, together with systematics mainly due to intrinsic uncertainties in stellar models and degeneracies between E(B – V) and metallicity. The best-fit isochrones are shown in the right panel of Fig. 8. The adopted solutions reproduce the observed morphology of both the MS-TO and the SGB well, supporting the reliability of the derived ages. We verified that small variations in the boundaries of the adopted selection boxes do not significantly affect the resulting ages. We also repeated the fitting procedure with BaSTI isochrones (Pietrinferni et al. 2024) of matching metallicity. As expected because of the different underlying parameterizations and physical assumptions of the model sets, BaSTI requires slightly shifted parameters (E(B – V) = 2.92 and μ0 = 14.05). Nevertheless, the resulting best-fit ages (12.7 and 5.1 Gyr) are consistent with the PARSEC values and fall within the conservative total age uncertainty of ±0.5 Gyr.
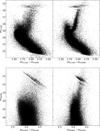 |
Fig. 7 Effect of the differential reddening correction on the JWST NIR (top panels) and on the HST optical (bottom panels) CMDs. In both cases, stars have been identified as likely members through proper motion analysis and satisfy strict photometric-quality criteria. Left panels: original CMDs. Right panels: with reddening correction applied. We notice how this process significantly reduces color broadening and reveals tighter evolutionary sequences. As expected, the optical CMD is more strongly affected by spatially variable extinction than the NIR CMD. |
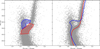 |
Fig. 8 Differential-reddening-corrected and proper-motion-selected NIR CMD of Terzan 5. Both panels show stars located between 10” and 40” from the system’s center and satisfying stringent photometric quality criteria to ensure reliable magnitude estimates. Left: CMD reveals the double MS-TO with unprecedented clarity, definition, and stellar statistics. The superimposed boxes highlight the stars selected along the MS-TO and SGB for the age fitting of the youngest (blue shaded area) and oldest (red) population. Right: same stars shown with the best-fitting PARSEC (Bressan et al. 2012; Tang et al. 2014; Chen et al. 2015) isochrones overplotted. The adopted models correspond to ages of 12.5 Gyr (red line) and 4.7 Gyr (blue line). |
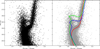 |
Fig. 9 Differential-reddening-corrected and proper-motion-selected NIR CMDs of Terzan 5 (in an annular region between 10″ and 40″ from the center). Left: CMD shows a sequence of stars brighter than the second MS-TO. Right: same stars shown in gray, with the best-fitting PARSEC (Bressan et al. 2012; Tang et al. 2014; Chen et al. 2015) isochrones overplotted. The blue and red lines are the same as in Fig. 8, while the additional component of 3.8 Gyr (Z = 0.03) is shown in green. |
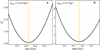 |
Fig. 10 Reduced chi-square (χ2) as a function of age values tested for the two main stellar populations identified in Terzan 5; see Fig. 8. Panel a: oldest population. Panel b: younger population. The solid black curves show the parabolic fits to the χ2 distributions, while the vertical dashed orange lines mark the best-fitting ages (corresponding to the χ2 minimum). |
5.3 Evidence of an additional younger component
One of the most intriguing characteristics of the new JWST CMD is the presence of a prominent “blue plume” of stars brighter than the 4.7 Gyr MS-TO (see the sources above the blue line in the right panel of Fig. 8). This could be the signature of a prolonged, recent star formation. Indeed, the careful inspection of the CMD zoomed in on the MS-TO region reveals an alignment of stars in this region of the CMD, possibly tracing the presence of an additional SGB. To estimate the age of this possible additional component, we applied the same χ2 statistics discussed above to these stars. In the absence of spectroscopic measures, we tentatively adopted a metallicity comparable to that of the 4.7 Gyr component. The right panel of Fig. 9 shows the best-fit isochrone (green line), with an age of 3.8 Gyr. We notice, however, that the blue plume extends to even brighter magnitudes (reaching mF115W ≈ 17.4) corresponding to stellar masses for which no detectable SGB is expected due to the short evolutionary timescales. In Fig. 11 we show that the extension in luminosity of the blue plume could, in principle, trace ages as young as ≈2.5 Gyr. The presence of a blue plume naturally raises the question of a possible contribution from blue straggler stars (BSSs; see, e.g., Ferraro et al. 1997, 2018; Dalessandro et al. 2008), which indeed populate a similar region of the CMD. However, their expected number is generally modest, even in the most massive stellar systems (e.g., −300 BSSs are observed in ωCentauri; see Ferraro et al. 2006). To estimate the number of BSSs expected in Terzan 5, we took advantage of the recent results of Ferraro et al. (2026a), who found that the BSS demography strongly depends on the environment. More specifically, the authors found that the BSS frequency (defined as the number of BSSs per units of 104L⊙ sampled luminosity) significantly decreases for increasing central density (ρ0) and central surface brightness (μ0) of the parent cluster. Hence, by adopting the relations listed in Supplementary Table 1 of Ferraro et al. (2026a) and the values of ρ0 and μ0 quoted in Lanzoni et al. (2010), we estimate that approximately three BSSs are expected for each 104L⊙ of sampled luminosity in Terzan 5. Considering that the WFC3 dataset samples approximately 5 × 10⁵ L⊙, we expect that approximately 150 BSSs contaminate the observed blue plume population, which comprises −1600 stars in total.
Moreover, BSS formation is expected to occur in sporadic events, rather than tracing a coherent activity. Hence, the clear presence of well-defined MS-TOs and well-populated SGBs provides strong evidence of "standard" star formation bursts that occurred in the recent past of this stellar system, rather than random BSS formation events. We therefore conclude that, while some BSSs are likely present in this region of the CMD, their contribution is negligible and cannot account for the observed extent of the blue plume.
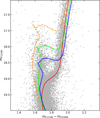 |
Fig. 11 NIR CMD of Terzan 5 as in Fig. 9, with the solid lines tracing the 12.5, 4.7, and 3.8 Gyr sub-populations discussed in the text (red, blue, and green, respectively), and the dashed orange line corresponding to an isochrone of just the 2.5 Gyr sub-population, which is needed to encompass the entire extension of the blue plume. |
5.4 Spatial distributions of the stellar populations
To further investigate the nature of these stellar populations, we selected three corresponding samples in the MS-TO region of the CMD (see the upper panel of Fig. 12) and analyzed their cumulative radial distributions. Because the considered populations span a small magnitude range (δmF115W ≈ 1.5 mag), the comparison of their cumulative radial distributions is expected to be minimally affected by completeness differences. As shown in the bottom panel of the same figure, the younger the population is, the more centrally concentrated it appears: the stars belonging to the newly identified 3.8 Gyr old component (marked in green) are the most centrally segregated, followed by those belonging to the 4.7 Gyr population (in blue), and then by the oldest, 12.5 Gyr old, population (in red). In turn, all three components are more segregated toward the center of Terzan 5 than Galactic field stars (marked in black), as expected for populations that belong to the system. Moreover, the stars selected along the brightest part of the blue plume (in yellow) exhibit an even higher degree of central concentration.
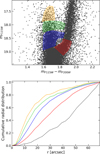 |
Fig. 12 Upper panel: JWST CMD with stars in the 0"-70" annular region from the center, with a zoomed-in view of the MS-TO region. The selection boxes are the ones adopted to extract the sub-populations of different ages, each highlighted with a different color: red, blue, green, and yellow for the components aged 12.5 Gyr, 4.7 Gyr, 3.8 Gyr, and younger than 3.8 Gyr, respectively. Lower panel: cumulative radial distributions of the selected components (solid lines with the same color-code as in the upper panel). A sample of Galactic field stars (dashed black line) is also shown as reference. |
6 Summary and conclusions
In this paper we present a JWST exploration of the MS-TO region of the heavily extincted stellar system Terzan 5 orbiting the Galactic bulge, with the aim of determining the ages of its multi-iron stellar sub-populations with unprecedented precision. Our main findings can be summarized as follows:
We obtained the deepest NIR CMD of Terzan 5, reaching more than four magnitudes fainter than previous studies;
The joint reduction of JWST and HST images enabled refinements in the PSF fitting, which led to significant improvements in the photometric quality in all four available filters. The inclusion of HST images was also crucial to compute relative proper motions that allowed us to distinguish member stars from field interlopers;
Simultaneous isochrone fitting in the optical and NIR CMDs provided us with the appropriate extinction law in the direction of Terzan 5 (RV = 2.5). This extinction law was then adopted in the construction of a high-resolution differential reddening map of the system.
After cleaning for proper motions and correcting for differential reddening, the CMD finally revealed a complex structure of the MS-TO region of Terzan 5, with two main sub-populations (with ages of 12.5 ± 0.5 Gyr and 4.7 ± 0.5 Gyr), a possible third component with an age of 3.8 Gyr, and an extended blue plume reaching mF115W ∼ 17.4, which is likely populated by stars as young as 2.5 Gyr;
The radial distributions of these populations display increasing central concentration with decreasing age.
As a first crucial result, this work provides the definitive confirmation of the presence of two main distinct MS-TOs in Terzan 5 (Fig. 8). They are now resolved with a level of precision never reached before. The newly derived ages are fully consistent with those reported in Ferraro et al. (2016), which have been obtained across different photometric bands, thereby strengthening and consolidating the conclusion that this stellar system hosts a sub-solar metallicity component with an age as old as (12.5 ± 0.5) Gyr, together with a much younger metal-rich population of (4.7 ± 0.5) Gyr. In addition, the JWST exploration has unveiled the existence of an extended blue plume populated by Terzan 5 member stars. Their distribution in the CMD reaches almost one magnitude above the MS-TO of the 4.7 Gyr component, and is suggestive of a prolonged activity of star formation extending up to just 2.5 Gyr ago (Fig. 11). The evidence of a sort of “bridge” at mF115W ≈ 18 suggests that, on top of this low-intensity activity, the system experienced at least an additional burst of star formation ∼3.8 Gyr ago (Fig. 9). On the other hand, the different sub-populations are systematically more centrally concentrated for decreasing age (Fig. 12), a feature that naturally fits into a self-enrichment scenario.
These findings provide new observational constraints that help narrow the range of viable interpretations of the true nature of Terzan 5. In particular, the clear identification of a prolonged period of star formation, possibly characterized by multiple bursts, strongly disfavors the GC+GMC interaction scenario (McKenzie & Bekki 2018). Together with the different radial segregation observed for the different age components, these features are instead suggestive of a self-enrichment process, where subsequent generations of stars form in the system’s central regions from gas retained and processed by previous generations. In this context, the existence of stellar populations younger than the 4.7 Gyr component suggests that stars with metallicities higher than [Fe/H]= +0.3 dex are present in the system. Indeed, the survey by Massari et al. (2014) showed some preliminary hints of the possible presence of an extreme, super-metal-rich population reaching [Fe/H]=+0.8. Moreover, the self-enrichment history of a ∼4 × 10⁷ M⊙ system that underwent major episodes of star formation has been proven to reproduce the ages and metallicities of the two main subcomponents well (see Romano et al. 2023). Finally, these new findings are in agreement with the star formation history of Terzan 5 reconstructed in Crociati et al. (2024), the authors of which found indications of a continuous activity with a few individual bursts.
Overall, the present investigation makes the case of Terzan 5 even closer to that of the other BFF discovered so far - Liller 1 - which also presents an extended blue plume in the CMD (see Ferraro et al. 2021) and is characterized by a continuous, low-intensity star formation activity extending approximately over the last 10 Gyr, with some major bursts at specific epochs (see Dalessandro et al. 2022). These might be the signatures of dynamical interactions with bulge sub-structures (e.g., the bar), therefore providing new information about the past evolution of the heart of our galaxy. Future spectroscopic follow-up will be essential to confirm the nature of the youngest sub-populations hosted in Terzan 5 and further reconstruct the star formation and evolutionary history of this extraordinary system. In a broader context, the transformative role of JWST in the exploration of highly extincted and crowding-limited environments finally opens the way for analogous analyses of other bulge GCs, which might disclose similar peculiarities and therefore turn out to be other remnants of massive structures that contributed to the formation of the Milky Way’s bulge.
Data availability
The photometric catalog is available at the CDS via https://cdsarc.cds.unistra.fr/viz-bin/cat/J/A+A/709/A212.
Acknowledgements
This work is part of the project “GENESIS - Searching for the primordial structures of the Universe in the heart of the Galaxy” (Advanced Grant FIS-2024-02056, PI:Ferraro), funded by the Italian MUR through the Fondo Italiano per la Scienza (FIS) call. Davide Massari acknowledges financial support from PRIN-MIUR-22: CHRONOS: adjusting the clock(s) to unveil the CHRONO-chemo-dynamical Structure of the Galaxy” (PI: S. Cassisi). This work is based on observations made with the NASA/ESA/CSA James Webb Space Telescope. The data were obtained from the Mikulski Archive for Space Telescopes at the Space Telescope Science Institute, which is operated by the Association of Universities for Research in Astronomy, Inc., under NASA contract NAS 5-03127 for JWST. These observations are associated with program GO 5502. The specific observations analyzed can be accessed via https://doi.org/10.17909/t7s6-t241.
References
- Adamo, A., Bradley, L. D., Vanzella, E., et al. 2024, Nature, 632, 513 [NASA ADS] [CrossRef] [Google Scholar]
- Alonso-García, J., Minniti, D., Catelan, M., et al. 2017, ApJ, 849, L13 [Google Scholar]
- Alvarez Garay, D. A., Fanelli, C., Origlia, L., et al. 2024, A&A, 686, A198 [NASA ADS] [CrossRef] [EDP Sciences] [Google Scholar]
- Anderson, J. 2022, One-Pass HST Photometry with hst1pass, Instrument Science Report WFC3 2022-5, 55 [Google Scholar]
- Anderson, J., & King, I. R. 2006, PSFs, Photometry, and Astronomy for the ACS/WFC, Instrument Science Report ACS 2006-01, 34 [Google Scholar]
- Anderson, J., King, I. R., Richer, H. B., et al. 2008, AJ, 135, 2114 [NASA ADS] [CrossRef] [Google Scholar]
- Bastian, N., & Pfeffer, J. 2022, MNRAS, 509, 614 [Google Scholar]
- Baumgardt, H., Hilker, M., Sollima, A., & Bellini, A. 2019, MNRAS, 482, 5138 [Google Scholar]
- Baumgardt, H., & Vasiliev, E. 2021, MNRAS, 505, 5957 [NASA ADS] [CrossRef] [Google Scholar]
- Bekki, K., & Freeman, K. C. 2003, MNRAS, 346, L11 [Google Scholar]
- Bellini, A., Anderson, J., & Bedin, L. R. 2011, PASP, 123, 622 [CrossRef] [Google Scholar]
- Bohlin, R. C. 2016, Encircled Energy Fractions for Hot Stars at WFC1-1K, https://www.stsci.edu/files/live/sites/www/files/home/hst/instrumentation/acs/data-analysis/aperture-corrections/_documents/bohlin2016_wfc_ee-1.txt, accessed: 2025-05-25 [Google Scholar]
- Bournaud, F. 2016, in Astrophysics and Space Science Library, 418, Galactic Bulges, eds. E. Laurikainen, R. Peletier, & D. Gadotti, 355 [Google Scholar]
- Bournaud, F., & Elmegreen, B. G. 2009, ApJ, 694, L158 [CrossRef] [Google Scholar]
- Bressan, A., Marigo, P., Girardi, L., et al. 2012, MNRAS, 427, 127 [NASA ADS] [CrossRef] [Google Scholar]
- Bushouse, H., Eisenhamer, J., Dencheva, N., et al. 2025, JWST Calibration Pipeline [Google Scholar]
- Cadelano, M., Ransom, S. M., Freire, P. C. C., et al. 2018, ApJ, 855, 125 [Google Scholar]
- Cadelano, M., Saracino, S., Dalessandro, E., et al. 2020, ApJ, 895, 54 [NASA ADS] [CrossRef] [Google Scholar]
- Cadelano, M., Pallanca, C., Dalessandro, E., et al. 2023, A&A, 679, L13 [NASA ADS] [CrossRef] [EDP Sciences] [Google Scholar]
- Callingham, T. M., Cautun, M., Deason, A. J., et al. 2022, MNRAS, 513, 4107 [NASA ADS] [CrossRef] [Google Scholar]
- Cardelli, J. A., Clayton, G. C., & Mathis, J. S. 1989, ApJ, 345, 245 [Google Scholar]
- Ceverino, D., Dekel, A., & Bournaud, F. 2010, MNRAS, 404, 2151 [NASA ADS] [Google Scholar]
- Chen, Y., Bressan, A., Girardi, L., et al. 2015, MNRAS, 452, 1068 [Google Scholar]
- Crociati, C., Valenti, E., Ferraro, F. R., et al. 2023, ApJ, 951, 17 [NASA ADS] [CrossRef] [Google Scholar]
- Crociati, C., Cignoni, M., Dalessandro, E., et al. 2024, A&A, 691, A311 [NASA ADS] [CrossRef] [EDP Sciences] [Google Scholar]
- Dalessandro, E., Lanzoni, B., Ferraro, F. R., et al. 2008, ApJ, 677, 1069 [NASA ADS] [CrossRef] [Google Scholar]
- Dalessandro, E., Crociati, C., Cignoni, M., et al. 2022, ApJ, 940, 170 [NASA ADS] [CrossRef] [Google Scholar]
- Elmegreen, B. G., Bournaud, F., & Elmegreen, D. M. 2008, ApJ, 688, 67 [NASA ADS] [CrossRef] [Google Scholar]
- Fanelli, C., Origlia, L., Rich, R. M., et al. 2024, A&A, 690, A139 [NASA ADS] [CrossRef] [EDP Sciences] [Google Scholar]
- Ferraro, F. R., Paltrinieri, B., Fusi Pecci, F., et al. 1997, A&A, 324, 915 [NASA ADS] [Google Scholar]
- Ferraro, F. R., Sollima, A., Rood, R. T., et al. 2006, ApJ, 638, 433 [NASA ADS] [CrossRef] [Google Scholar]
- Ferraro, F. R., Dalessandro, E., Mucciarelli, A., et al. 2009, Nature, 462, 483 [Google Scholar]
- Ferraro, F. R., Massari, D., Dalessandro, E., et al. 2016, ApJ, 828, 75 [NASA ADS] [CrossRef] [Google Scholar]
- Ferraro, F. R., Lanzoni, B., Raso, S., et al. 2018, ApJ, 860, 36 [NASA ADS] [CrossRef] [Google Scholar]
- Ferraro, F. R., Pallanca, C., Lanzoni, B., et al. 2021, Nat. Astron., 5, 311 [Google Scholar]
- Ferraro, F. R., Chiappino, L., Bartolomei, A., et al. 2025, A&A, 696, A179 [NASA ADS] [CrossRef] [EDP Sciences] [Google Scholar]
- Ferraro, F. R., Lanzoni, B., Vesperini, E., et al. 2026a, Nat. Commun., 17, 768 [Google Scholar]
- Ferraro, F. R., Vesperini, E., Lanzoni, B., et al. 2026b, A&A, 709, A163 [NASA ADS] [CrossRef] [EDP Sciences] [Google Scholar]
- Fitzpatrick, E. L., & Massa, D. 1990, ApJS, 72, 163 [NASA ADS] [CrossRef] [Google Scholar]
- Gaia Collaboration (Vallenari, A., et al.) 2023, A&A, 674, A1 [NASA ADS] [CrossRef] [EDP Sciences] [Google Scholar]
- Genzel, R., Newman, S., Jones, T., et al. 2011, ApJ, 733, 101 [Google Scholar]
- Girardi, L., Bertelli, G., Bressan, A., et al. 2002, A&A, 391, 195 [NASA ADS] [CrossRef] [EDP Sciences] [Google Scholar]
- Griggio, M., Nardiello, D., & Bedin, L. R. 2023, Astron. Nachr., 344, e202300006 [Google Scholar]
- Haywood, M., Di Matteo, P., Lehnert, M., et al. 2018, A&A, 618, A78 [NASA ADS] [CrossRef] [EDP Sciences] [Google Scholar]
- Helmi, A. 2020, ARA&A, 58, 205 [Google Scholar]
- Immeli, A., Samland, M., Gerhard, O., & Westera, P. 2004, A&A, 413, 547 [CrossRef] [EDP Sciences] [Google Scholar]
- JWST Science Calibration Pipeline Team 2024, Encircled Energy Table for NIRCam SW (ETC v2), https://jwst-docs.stsci.edu/files/154689003/154689005/1/1716395573461/Encircled_Energy_SW_ETCv2.txt, accessed: 2025-05-25 [Google Scholar]
- Khoperskov, S., Mastrobuono-Battisti, A., Di Matteo, P., & Haywood, M. 2018, A&A, 620, A154 [NASA ADS] [CrossRef] [EDP Sciences] [Google Scholar]
- Lanzoni, B., Ferraro, F. R., Dalessandro, E., et al. 2010, ApJ, 717, 653 [Google Scholar]
- Libralato, M., Bellini, A., van der Marel, R. P., et al. 2023, ApJ, 950, 101 [NASA ADS] [CrossRef] [Google Scholar]
- Loriga, M., Pallanca, C., Ferraro, F. R., et al. 2025, A&A, 695, A156 [NASA ADS] [CrossRef] [EDP Sciences] [Google Scholar]
- Massari, D., Mucciarelli, A., Ferraro, F. R., et al. 2014, ApJ, 795, 22 [NASA ADS] [CrossRef] [Google Scholar]
- Massari, D., Koppelman, H. H., & Helmi, A. 2019, A&A, 630, L4 [NASA ADS] [CrossRef] [EDP Sciences] [Google Scholar]
- Massari, D., Mucciarelli, A., Dalessandro, E., et al. 2012, ApJ, 755, L32 [NASA ADS] [CrossRef] [Google Scholar]
- Mastrobuono-Battisti, A., Khoperskov, S., Di Matteo, P., & Haywood, M. 2019, A&A, 622, A86 [NASA ADS] [CrossRef] [EDP Sciences] [Google Scholar]
- McKenzie, M., & Bekki, K. 2018, MNRAS, 479, 3126 [CrossRef] [Google Scholar]
- Messa, M., Dessauges-Zavadsky, M., Adamo, A., Richard, J., & Claeyssens, A. 2024, MNRAS, 529, 2162 [CrossRef] [Google Scholar]
- Montegriffo, P., Ferraro, F. R., Origlia, L., & Fusi Pecci, F. 1995, MNRAS, 276, 739 [NASA ADS] [CrossRef] [Google Scholar]
- Nardiello, D., Libralato, M., Piotto, G., et al. 2018, MNRAS, 481, 3382 [NASA ADS] [CrossRef] [Google Scholar]
- Nardiello, D., Bedin, L. R., Griggio, M., et al. 2023, MNRAS, 525, 2585 [CrossRef] [Google Scholar]
- Nataf, D. M., Gould, A., Fouqué, P., Gonzalez, O. A., & Johnson, J. A. 2013, ApJ, 769, 88 [NASA ADS] [CrossRef] [Google Scholar]
- O’Donnell, J. E. 1994, ApJ, 422, 158 [Google Scholar]
- Origlia, L., Rich, R. M., Ferraro, F. R., et al. 2011, ApJ, 726, L20 [CrossRef] [Google Scholar]
- Origlia, L., Massari, D., Rich, R. M., et al. 2013, ApJ, 779, L5 [NASA ADS] [CrossRef] [Google Scholar]
- Origlia, L., Mucciarelli, A., Fiorentino, G., et al. 2019, ApJ, 871, 114 [NASA ADS] [CrossRef] [Google Scholar]
- Origlia, L., Ferraro, F. R., Fanelli, C., et al. 2025, A&A, 697, A19 [NASA ADS] [CrossRef] [EDP Sciences] [Google Scholar]
- Padmanabh, P. V., Ransom, S. M., Freire, P. C. C., et al. 2024, A&A, 686, A166 [NASA ADS] [CrossRef] [EDP Sciences] [Google Scholar]
- Pallanca, C., Ferraro, F. R., Lanzoni, B., et al. 2021a, ApJ, 917, 92 [NASA ADS] [CrossRef] [Google Scholar]
- Pallanca, C., Lanzoni, B., Ferraro, F. R., et al. 2021b, ApJ, 913, 137 [NASA ADS] [CrossRef] [Google Scholar]
- Pietrinferni, A., Salaris, M., Cassisi, S., et al. 2024, MNRAS, 527, 2065 [Google Scholar]
- Ransom, S. M., Hessels, J. W. T., Stairs, I. H., et al. 2005, Science, 307, 892 [NASA ADS] [CrossRef] [PubMed] [Google Scholar]
- Regan, M. 2024, JWST Technical Report: Detection and flagging of showers and snowballs in JWST, https://www.stsci.edu/files/live/sites/www/files/home/jwst/documentation/technical-documents/_documents/JWST-STScI-008545.pdf, p. 8, Accessed: 2025-05-12 [Google Scholar]
- Romano, D., Ferraro, F. R., Origlia, L., et al. 2023, ApJ, 951, 85 [NASA ADS] [CrossRef] [Google Scholar]
- Saracino, S., Dalessandro, E., Ferraro, F. R., et al. 2015, ApJ, 806, 152 [NASA ADS] [CrossRef] [Google Scholar]
- Sneden, C., Gehrz, R. D., Hackwell, J. A., York, D. G., & Snow, T. P. 1978, ApJ, 223, 168 [CrossRef] [Google Scholar]
- Stetson, P. B. 1987, PASP, 99, 191 [Google Scholar]
- Stetson, P. B. 2011, DAOPHOT: Crowded-field Stellar Photometry Package, Astrophysics Source Code Library [record ascl:1104.011] [Google Scholar]
- STScI. 2024a, ACS Zeropoints Calculator, https://acszeropoints.stsci.edu/, accessed: 2025-05-25 [Google Scholar]
- STScI. 2024b, JWST/NIRCam Zeropoints File (NRC_ZPs_1126pmap.txt), https://jwst-docs.stsci.edu/files/154689209/154689212/1/1716319320811/NRC_ZPs_1126pmap.txt, accessed: 2025-05-25 [Google Scholar]
- Tang, J., Bressan, A., Rosenfield, P., et al. 2014, MNRAS, 445, 4287 [NASA ADS] [CrossRef] [Google Scholar]
- Tolstoy, E., Hill, V., & Tosi, M. 2009, ARA&A, 47, 371 [Google Scholar]
- Udalski, A. 2003, ApJ, 590, 284 [NASA ADS] [CrossRef] [Google Scholar]
- Valenti, E., Ferraro, F. R., & Origlia, L. 2010, MNRAS, 402, 1729 [NASA ADS] [CrossRef] [Google Scholar]
All Tables
JWST/NIRCam and HST/ACS datasets used in this work, including observational epochs, filters, number of exposures and readout modes (if appropriate), and exposure times.
Vegamag Zero Point values for NIRCam and ACS recovered from the NIRCam documentation STScI (2024b) and the ACS Zeropoint Calculator STScI (2024a).
All Figures
|
Fig. 1 JWST/NIRCam mosaic of Terzan 5 obtained with module B in the F115W filter (composite of all dithered exposures from SW detectors onto a common grid). |
| In the text | |
|
Fig. 2 Illustration of FoV coverage for the dataset of observations of Terzan 5 used in this work. Gray dots represent stars detected in the optical filters. Blue rectangles show the HST/ACS field of view for the first two epochs (SNAP 9799, PI: Rich; GO 12933, PI: Ferraro), while light blue rectangles indicate the third epoch (GO/DD 14061, PI: Ferraro). Red rectangles mark the JWST/NIRCAM module B SW detector boundaries from the first observing cycle (GO 5502, PI: Ferraro, 2024), and orange rectangles show the corresponding fields from the second cycle (GO 5502, PI: Ferraro, 2025). Each of the FoVs shown here corresponds to the pointing of the first exposure in each dataset. All coordinates are expressed as projected offsets in arcseconds (Δx, Δy) relative to the center of Terzan 5 (αJ2000 = 17h48m4.85s, δJ2000 = -24°46′44.6″; Lanzoni et al. 2010). |
| In the text | |
|
Fig. 3 (mF814W, mF606W - mF814w) and (mF115W, mF115W - mF200W) CMDs for Terzan 5 obtained from the joint catalog of HST and JWST datasets. This bipanel visualization highlights the complementary wavelength coverage of optical (left panel) and NIR (right panel) data for studying systems such as Terzan 5. |
| In the text | |
|
Fig. 4 Proper motion selection of Terzan 5 members. Panels a and b: optical CMDs (mF606W - mF814W, mF814W). Panels c and d: NIR CMDs (mF115W - mF200W, mF115W). The left panels in each row show all the stars that satisfy the photometric-quality criteria in black, while panels b and d highlight only those classified as likely cluster members from the proper motion analysis in red. The horizontal dashed lines mark the mF814W magnitude bins adopted in the proper motion selection. The panel in the upper right shows the corresponding VPDs for each magnitude interval: in each subpanel, the red dots mark stars retained as members and the black dots indicate rejected (Galactic field) sources. The effectiveness of the proper motion membership selection is clearly demonstrated by the rejection of Galactic field MS stars drawing the evident blue plume (bluer and brighter than Terzan 5’s MS-TO) in panels a and c. |
| In the text | |
|
Fig. 5 Effect of different assumptions of the RV parameter on the isochrone position in the CMDs. The dashed black line is the 12.5 Gyr isochrone (Bressan et al. 2012) that best fits the NIR CMD (right panel) under the assumption of the (O’Donnell 1994) extinction law with the standard value RV = 3.1, requiring E(B - V) = 2.08. Clearly, this isochrone is unable to also match the optical CMD (see the dashed black line in the left panel). The solid red line is the same isochrone plotted assuming the same extinction law, but adopting RV = 2.5: it clearly simultaneously reproduces both the NIR and the optical CMDs well, with E(B - V) = 2.86. |
| In the text | |
|
Fig. 6 Differential reddening maps derived from JWST/NIRCam (left) and HST/ACS (right) photometry. Both panels show the spatial distribution of δE(B - V) across the respective FoVs. The coordinates Δx and Δy (in arcseconds) indicate the angular offsets from the center of the system. The color-scale traces variations in δE(B - V) with respect to the mean value, highlighting the highly patchy and non-uniform extinction pattern affecting the region. |
| In the text | |
|
Fig. 7 Effect of the differential reddening correction on the JWST NIR (top panels) and on the HST optical (bottom panels) CMDs. In both cases, stars have been identified as likely members through proper motion analysis and satisfy strict photometric-quality criteria. Left panels: original CMDs. Right panels: with reddening correction applied. We notice how this process significantly reduces color broadening and reveals tighter evolutionary sequences. As expected, the optical CMD is more strongly affected by spatially variable extinction than the NIR CMD. |
| In the text | |
|
Fig. 8 Differential-reddening-corrected and proper-motion-selected NIR CMD of Terzan 5. Both panels show stars located between 10” and 40” from the system’s center and satisfying stringent photometric quality criteria to ensure reliable magnitude estimates. Left: CMD reveals the double MS-TO with unprecedented clarity, definition, and stellar statistics. The superimposed boxes highlight the stars selected along the MS-TO and SGB for the age fitting of the youngest (blue shaded area) and oldest (red) population. Right: same stars shown with the best-fitting PARSEC (Bressan et al. 2012; Tang et al. 2014; Chen et al. 2015) isochrones overplotted. The adopted models correspond to ages of 12.5 Gyr (red line) and 4.7 Gyr (blue line). |
| In the text | |
|
Fig. 9 Differential-reddening-corrected and proper-motion-selected NIR CMDs of Terzan 5 (in an annular region between 10″ and 40″ from the center). Left: CMD shows a sequence of stars brighter than the second MS-TO. Right: same stars shown in gray, with the best-fitting PARSEC (Bressan et al. 2012; Tang et al. 2014; Chen et al. 2015) isochrones overplotted. The blue and red lines are the same as in Fig. 8, while the additional component of 3.8 Gyr (Z = 0.03) is shown in green. |
| In the text | |
|
Fig. 10 Reduced chi-square (χ2) as a function of age values tested for the two main stellar populations identified in Terzan 5; see Fig. 8. Panel a: oldest population. Panel b: younger population. The solid black curves show the parabolic fits to the χ2 distributions, while the vertical dashed orange lines mark the best-fitting ages (corresponding to the χ2 minimum). |
| In the text | |
|
Fig. 11 NIR CMD of Terzan 5 as in Fig. 9, with the solid lines tracing the 12.5, 4.7, and 3.8 Gyr sub-populations discussed in the text (red, blue, and green, respectively), and the dashed orange line corresponding to an isochrone of just the 2.5 Gyr sub-population, which is needed to encompass the entire extension of the blue plume. |
| In the text | |
|
Fig. 12 Upper panel: JWST CMD with stars in the 0"-70" annular region from the center, with a zoomed-in view of the MS-TO region. The selection boxes are the ones adopted to extract the sub-populations of different ages, each highlighted with a different color: red, blue, green, and yellow for the components aged 12.5 Gyr, 4.7 Gyr, 3.8 Gyr, and younger than 3.8 Gyr, respectively. Lower panel: cumulative radial distributions of the selected components (solid lines with the same color-code as in the upper panel). A sample of Galactic field stars (dashed black line) is also shown as reference. |
| In the text | |
Current usage metrics show cumulative count of Article Views (full-text article views including HTML views, PDF and ePub downloads, according to the available data) and Abstracts Views on Vision4Press platform.
Data correspond to usage on the plateform after 2015. The current usage metrics is available 48-96 hours after online publication and is updated daily on week days.
Initial download of the metrics may take a while.