| Issue |
A&A
Volume 709, May 2026
|
|
|---|---|---|
| Article Number | A39 | |
| Number of page(s) | 12 | |
| Section | Interstellar and circumstellar matter | |
| DOI | https://doi.org/10.1051/0004-6361/202557535 | |
| Published online | 01 May 2026 | |
PDRs4All
XX. The 6–9 μm region as a probe of PAH charge and size in the Orion Bar
1
Department of Physics & Astronomy, The University of Western Ontario,
London
ON
N6A 3K7,
Canada
2
Universidad Nacional de Colombia,
Ave Cra 30 # 45-3, Bogotá,
Colombia
3
Institute for Earth and Space Exploration, The University of Western Ontario,
London,
ON
N6A 3K7,
Canada
4
Carl Sagan Center, SETI Institute,
339 Bernardo Avenue, Suite 200,
Mountain View,
CA
94043,
USA
5
Leiden Observatory, Leiden University,
PO Box 9513,
2300
RA
Leiden,
The Netherlands
6
Astronomy Department, University of Maryland,
College Park,
MD
20742,
USA
7
Department of Astronomy, Graduate School of Science, The University of Tokyo,
7-3-1 Bunkyo-ku,
Tokyo
113-0033,
Japan
8
NASA Ames Research Center,
MS 245-6,
Moffett Field,
CA
940351000,
USA
9
Dipartimento di Fisica, Università degli Studi di Milano,
Via Celoria 16,
20133
Milano,
Italy
10
Institut de Recherche en Astrophysique et Planétologie, Université Toulouse III – Paul Sabatier,
CNRS, CNES, 9 Av. du colonel Roche, 31028 Toulouse Cedex 04,
France
11
Astronomy Department, Ohio State University,
Columbus,
OH
43210,
USA
12
Institut des Sciences Moléculaires d'Orsay, Université Paris-Saclay,
CNRS, Bâtiment 520,
91405
Orsay Cedex,
France
13
Instituto de Física Fundamental (CSIC),
Calle Serrano 121-123,
28006
Madrid,
Spain
14
Institut d'Astrophysique Spatiale, Université Paris-Saclay,
CNRS, Bâtiment 121, 91405 Orsay Cedex,
France
15
Department of Physics, Institute of Science, Banaras Hindu University (BHU),
Varanasi
221005,
India
16
Astrophysical Institute and University Observatory,
Schillergässchen 2-3,
07745
Jena,
Germany
17
Instituto de Matemática, Estatística e Física, Universidade Federal do Rio Grande,
96201-900,
Rio Grande,
RS,
Brazil
18
Space Telescope Science Institute,
3700 San Martin Drive,
Baltimore,
MD
21218,
USA
19
School of Physics and Astronomy, Sun Yat-sen University,
2 Da Xue Road,
Tangjia, Zhuhai
519000,
Guangdong Province,
China
20
Atomic Physics Division, Stockholm University,
106 91
Stockholm,
Sweden
★ Corresponding author: This email address is being protected from spambots. You need JavaScript enabled to view it.
Received:
2
October
2025
Accepted:
5
February
2026
Abstract
Context. Infrared emission from polycyclic aromatic hydrocarbons (PAHs) plays a major role in determining the charge balance of their host environments that include photodissociation regions (PDRs) in galaxies, planetary nebulae, and rims of molecular clouds.
Aims. We aim to investigate the distribution and sizes of charged PAHs across the key zones of the Orion Bar PDR, i.e., the ionization front, the atomic PDR, and the dissociation fronts.
Methods. We employed JWST MIRI-MRS observations of the Orion Bar from the Early Release Science program “PDRs4All” and synthetic images in the JWST MIRI filters. We investigated the spatial morphology of the aromatic infrared bands (AIBs) at 6.2, 7.7, 8.6, and 11.0 μm (commonly tracing PAH cations) and the neutral PAH-tracing 11.2 μm AIB, their (relative) correlations, and their relationship with existing empirical prescriptions for AIBs.
Results. The 6.2, 7.7, 8.6, 11.0, and 11.2 μm AIBs are similar in spatial morphology on larger scales. Aside from the 11.0 μm AIB, these AIBs exhibit enhanced intensities at the dissociation fronts. Analyzing three-feature intensity correlations, two distinct groups emerge: the 8.6 and 11.0 μm AIBs versus the 6.2 and 7.7 μm AIBs. We attribute these correlations to PAH size. The 6.2 and 7.7 μm AIBs trace cationic, medium-sized PAHs. Quantum chemical calculations reveal that the 8.6 μm AIB is carried by large, compact, cationic PAHs, and the 11.0 μm AIB's correlation with it implies that this band is as well. The 6.2/8.6 and 7.7/8.6 PAH band ratios thus probe PAH size. We conclude that the 6.2/11.2 AIB ratio is the most reliable proxy for charged PAHs within the cohort. We outline JWST MIRI imaging prescriptions that serve as effective tracers of the PAH ionization fraction, as traced by the 7.7/11.2 PAH emission.
Conclusions. This study showcases the efficacy of the 6−9 μm AIBs in probing the charge state and size distribution of emitting PAHs, offering insights into the physical conditions of their host environments. JWST MIRI photometry offers a viable alternative to IFU spectroscopy for characterizing this emission in extended objects.
Key words: astrochemistry / techniques: photometric / techniques: spectroscopic / ISM: molecules / photon-dominated region (PDR) / ISM: individual objects
© The Authors 2026
 Open Access article, published by EDP Sciences, under the terms of the Creative Commons Attribution License (https://creativecommons.org/licenses/by/4.0), which permits unrestricted use, distribution, and reproduction in any medium, provided the original work is properly cited.
This article is published in open access under the Subscribe to Open model. This email address is being protected from spambots. You need JavaScript enabled to view it. to support open access publication.
1 Introduction
Polycyclic aromatic hydrocarbons (PAHs) comprise a prominent and influential family of organic molecules in space. These molecules are the dominant carriers of the strong, broad aromatic infrared bands (AIBs), the most prominent of which occur at 3.3, 6.2, 7.7, 8.6, 11.2, and 12.7 μm, that have been detected across the Universe (e.g., Gillett et al. 1973; Merrill et al. 1975; Allamandola et al. 1985; Peeters et al. 2002). A remarkably diverse set of astrophysical environments has been found to exhibit AIBs, including the photodissociation region (PDR) environments of the interstellar medium (ISM), planetary nebulae, reflection nebulae, and star-forming galaxies (Tielens 2008; Li 2020). By virtue of their prevalence and molecular nature, PAHs play a crucial role in shaping the physical and chemical landscapes of the ISM and have important diagnostic value for understanding the physical conditions of their host environments (e.g., Galliano et al. 2008; Peeters et al. 2017; Chown et al. 2024; Schroetter et al. 2024).
While PAH emission is remarkably constant across diverse environments, nuanced variations in relative band strengths and profiles in the observed spectra contain valuable information about distinct molecular characteristics such as size, charge, and molecular edge structure of the astronomical PAH population (e.g., Hony et al. 2001; Peeters et al. 2002; Galliano et al. 2008; Shannon et al. 2016). In particular, the charge state of PAHs is a main driver of variations in PAH spectra (Allamandola et al. 1999; Oomens et al. 2003; Ricca et al. 2012; Peeters et al. 2017; Sidhu et al. 2021). The 6−9 μm C–C stretching and C-H in-plane bending modes are strongly enhanced in ionized PAHs, resulting in the well-established strong correlations among the prominent 6.2, 7.7, and 8.6 μm AIBs. In contrast, the neutral PAHs display strong C−H modes in the 3.3 and 11− 15 μm regions, including the nominal 11.2 μm AIB ascribed to neutral, solo edge hydrogen-dominated PAHs (Allamandola et al. 1999; Candian et al. 2014). This dichotomy in PAH band strengths thus provides a diagnostic of the ionization state of the PAH population and thereby of the local physical conditions through the ionization parameter,  , where G0 is the strength of the local UV radiation field in units of the Habing field (Habing 1968), ne is the electron density, and Tgas is the gas temperature (Bregman & Temi 2005; Galliano et al. 2008). These conclusions were based upon ISO/SWS1 and Spitzer/IRS2 observations, which had limited spatial and spectral resolution. The high spatial and spectral resolution of the James Webb Space Telescope (JWST) MIRI Medium Resolution Spectroscopy (MRS) Integral Field Unit (IFU) observations allow us to reassess the viability of these PAH charge proxies. We also aim to address the viability of using JWST broadband filter observations to address PAH properties in extragalactic observations. To accomplish this, we studied the traditional PAH charge proxy AIBs at 6.2,7.7,8.6,11.0 μm and the canonically neutral 11.2 μm AIB, as observed by JWST in the Orion Bar, a well-studied PDR.
We present the details of the observations in Sect. 2. The spatial behavior and correlations of the AIBs in our cohort are presented in Sect. 3. We discuss the efficacy of the 7−9 μm AIBs as size and charge proxies in Sect. 4.1 and Sect. 4.2, respectively. We discuss the use of JWST photometric observations to probe the ionic PAH population in Sect. 4.3. Finally, we summarize the results of this study in Sect. 5.
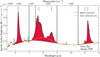 |
Fig. 1 AIB template spectrum for the Orion Bar atomic PDR, showcasing the 6.2, 7.7, 8.6, 11.0, and 11.2 μm AIBs shaded in red and indicated by the vertical solid blue lines. The blue curve shows the underlying “global” continuum, the orange curve indicates the “local” continuum (lc), and the black round symbols mark the anchor points used for the continua determination. |
2 Observations and analysis
Within the Orion Nebula, the massive star-forming region closest to us, lies the Orion Bar PDR, wherein far-ultraviolet (FUV) radiation from the brightest member of the Trapezium cluster of massive stars, θ1 Ori C, drives the physical and chemical conditions of the neutral gas (Tielens & Hollenbach 1985). The Orion Bar PDR straddles the boundary between the surface of the H ii region and the surrounding molecular cloud (Bally 2008). The PDR is viewed nearly edge-on and its physical and chemical stratification has now been seen in spectacular detail through JWST NIRCam, NIRSpec, and MIRI imaging and spectroscopic observations (Habart et al. 2024; Peeters et al. 2024; Chown et al. 2024; Van De Putte et al. 2024). We present a NIRCam image of the Orion Bar in Fig. A.1. The PDR begins just beyond the sharp ionization front (IF), where the gas becomes neutral and predominantly atomic. As the FUV photon flux attenuates with distance into the PDR, the gas becomes molecular. This marks the beginning of the molecular PDR. Herein, the spectral emission from H2 exhibits several ridges at increasing distances from the IF. In the MIRI field of view (FOV), three dissociation fronts (DFs) (DF 1, DF 2, and DF 3) are observed. We refer the interested reader to Habart et al. (2024), Peeters et al. (2024), and Goicoechea et al. (2025) for a detailed description of the geometry and large-scale stratification of the Orion Bar PDR. Its edge-on geometry and close proximity make the Orion Bar an ideal target for PDR studies, enabling investigation of dust and gas photoprocessing with respect to distance from the ionizing source and the photochemical evolution of the resident PAHs.
We utilized the JWST MIRI-MRS IFU (Wright et al. 2015) observations of the Orion Bar made for the JWST Early Release Science (ERS) program “PDRs4All: Radiative Feedback from Massive Stars” (Berné et al. 2022). The MIRI-MRS data spans the 4.90−27.90 μm wavelength range at a resolving power of ∼ 1500−3500. The details of data reduction and production of the spatio-spectral mosaic used in this study are provided in Van De Putte et al. (2024) and Chown et al. (2024).
To investigate variations in the spatial distributions of the charge-tracing AIBs (at 6.2, 7.7, 8.6, and 11.0 μm) and study their correlations, the specific surface brightnesses of the AIBs were integrated for the continuum-subtracted spectra in the mosaic. For this purpose, as shown in Fig. 1, we considered a “local” continuum (labelled “lc” in figures; orange curve) for which an anchor point was placed at roughly 8.2 μm, as done previously by Hony et al. (2001) and Peeters et al. (2002). We also estimated a “global” spline continuum (blue) upon which the AIBs lay superposed. The wavelength integration windows are provided in Appendix B. We direct the interested reader to Khan et al. (2025) for details on the methodology of the study.
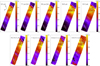 |
Fig. 2 Spatial distribution of the surface brightnesses of the 6.2, 7.7, 8.6, 11.0, and 11.2 μm AIBs in the Orion Bar PDR in units of Wm−2 sr−1, and brightness ratios relative to the 11.2 μm AIB. The analysis utilizes the 7.7 and 8.6 μm bands measured using a local continuum (lc; Fig. 1). θ1 Ori C is located at the top right of each map. For each map, the color bars span 0.5−99.5% percentiles. The zero pixels, edge pixels, and the two proplyds in black circles seen in the MIRI mosaic, are masked out. The contours trace peak emission for the 11.0 μm AIB (white) and the 11.2 μm AIB (teal). The gray rectangles show template spectra apertures (H ii region, atomic PDR, DF 1, DF 2, and DF 3 from top to bottom); the gray lines delineate the IF and the three DFs (DF 1, DF 2, and DF 3); and the dashed, diagonal white line (top left) indicates the cut across the MIRI mosaic (position angle of 155.79°). |
3 Results
We present the spatial distribution and surface brightnesses of the 6.2, 7.7, 8.6, 11.0, and 11.2 μm AIBs, as well as the distributions relative to the 11.2 μm AIB in Fig. 2. The radial profiles of the AIB surface brightnesses, measured along a cut across the Orion Bar (Fig. 2), are presented in Fig. 3. In the following discussion, we refer to results based on the local continuum unless otherwise specified. The results using the global continuum are presented in Appendix C. The spatial behavior of the AIBs in this cohort is akin to the 3.2−3.7 μm and 10−15 μm AIBs investigated by Peeters et al. (2024) and Khan et al. (2025). The AIB emission observed in the H ii region arises from the background face-on PDR formed at the surface of the molecular cloud OMC-1. The strongest AIB emission is observed within the atomic PDR, which marks the first, predominant layer of the PDR, and begins just beyond the IF demarcating the regions of ionized and neutral gas. AIB fluorescence is widespread throughout the atomic PDR, with a few regions of local-maximum emission. As the FUV photon flux attenuates with distance from the IF, the AIB emission similarly attenuates. However, local enhancements in AIB strengths are observed near the DFs in the molecular zone of the Orion Bar.
Overall, the 6.2,7.7, 8.6, 11.0, and 11.2 μm maps are all very similar. As seen in Fig. 3, on smaller scales – as for the 11.2 μm and 3.3 μm AIB (see Peeters et al. 2024) – the 6.2, 7.7, and 8.6 μm AIB ensemble emission is enhanced just beyond each of the H2 DFs. The 11.0 μm emission shows no such local peaks near the DFs.
Historically, the PAH ionization fraction has been mapped through the 6.2/11.2, 7.7/11.2, and 8.6/11.2 surface brightness ratios. The maps in the lower panels of Fig. 2 reveal the PAH ionization fraction to be the highest at the northwestern end of the atomic PDR. Figure 3 shows that the 6.2/11.2, 7.7/11.2, and 8.6/11.2 relative surface brightnesses are generally higher than the 11.0/11.2 ratio just beyond the proplyds in the atomic PDR. The normalized 6.2/11.2 surface brightness ratio decreases more slowly with distance from the IF than the 7.7/11.2 and 8.6/11.2 ratios. Just beyond each of the three DFs, the 6.2/11.2 and 7.7/11.2 ratios are enhanced, unlike the 8.6/11.2 and 11.0/11.2 surface brightness ratios, which drop at these fronts.
We further examine the relationships between these AIBs through three-feature intensity correlation plots, where the AIB surface brightnesses are normalized to the 11.2 μm AIB (Fig. 4). Out of the 6.2, 7.7, and 8.6 μm bands, the normalized 6.2 and 7.7 μm AIB surface brightnesses exhibit the strongest correlation. The 8.6/11.2 versus 7.7/11.2 and 8.6/11.2 versus 6.2/11.2 correlations reveal branching. The main branch (“Branch 1”) traces emission from the edge-on PDR – that is, the majority of the atomic PDR and the DFs – while “Branch 2” comprises emission from the H ii region and regions just below the IF, along with some contribution from the atomic PDR. We note that the 6.2 and 7.7 μm AIB surface brightnesses are tightly correlated over all the regions, such that the branches coincide. Focusing on the edge-on PDR (the main branch), we observe a distinct change in slope, where the 8.6/11.2 ratio decreases between DF 2 and DF 3, at DF 3, and beyond DF 3. This suggests that the 8.6 μm AIB surface brightness in these regions lacks contributions from PAHs that contribute to the 6.2 and 7.7 μm AIBs. We conclude therefore that only a subset of the interstellar PAH family contributes to the 8.6 μm AIB and that this subset has relatively low abundance in the regions beyond DF 2. We propose that this is linked to the intrinsic vibrational properties of PAHs, discussed in Sect. 4.1. In addition, Khan et al. (2025) suggested that the AIB emission observed in H ii region and near the IF – right at the precipice of the PDR – is contaminated by emission from the background face-on PDR and not from the edge-on PDR. The morphology of the Orion Bar thus drives the branching behavior seen in the correlation plots.
Fig. 4 reveals that the 11.0 μm band correlates best in brightness with the 8.6 μm AIB, exhibiting a near-linear correlation throughout the PDR to the edge of DF 3. In contrast, the 7.7 and 6.2 μm bands show poorer correlations with the 11.0 μm AIB and display distinct branches.
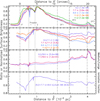 |
Fig. 3 Normalized surface brightnesses and ratios for the 6.2, 7.7, 8.6, 11.0, and 11.2 μm AIBs as a function of distance to the IF (0.228 pc or 113.4′′ from θ1 Ori C) along a cut crossing the mosaic (see Fig. 2 for the location of the cut). Normalization factors are listed in W m−2 sr−1 in parentheses for each surface brightness. As the cut is not perpendicular to the IF and distances are given along the cut, a correction factor of cos (19.58°)=0.942 must be applied to obtain a perpendicular distance from the IF. |
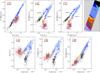 |
Fig. 4 Correlations of the 7.7[lc]/11.2,8.6[lc]/11.2, and 11.0/11.2 AIB surface brightness ratios. The Spearman correlation coefficients (“R”) for the variables excluding (including) the points from the H ii region (black) and the regions beneath the IF (teal and dark blue) are indicated in red (black). Only the surface brightnesses from alternate spaxels are considered in the correlation analyses. The data points are colored according to regions in the mosaic where those pixels are located (top right panel). This visual region-color scheme is as follows: blue (atomic PDR), dark blue (east IF), teal (west IF), purple (DF 1), yellow (region between DF 1 and DF 2), orange (DF 2), light brown (region west of DF 2), brown (region between DF 2 and DF 3), pink (DF 3), and light purple (region beyond DF 3). The contours highlighting DF 2 and DF 3 are identified through enhanced emission of H2 0−0 S(3) in these DFs. The red circular regions on the color-region map (top right panel) correspond to the protoplanetary disks along the line of sight, which are masked in this analysis. |
4 Discussion
4.1 The 6.2/8.6 and 7.7/8.6 AIB ratios as tracers for PAH size
Quantum chemistry studies have revealed that the 8.6 μm C–H in-plane bending mode is typically not very distinct in the calculated emission spectra of irregular PAHs (Bauschlicher et al. 2008, 2009). This band only becomes prominent for large, compact regular PAH cations and anions; moreover, its intrinsic strength relative to the C–C modes at 6.2 μm and 7.7 μm increases with size (Bauschlicher et al. 2008, 2009; Ricca et al. 2012). This behavior has been taken to imply that the 8.6 μm AIB originates in large (≈66−130 C-atoms), compact PAHs – such as the coronene family, characterized by only solo and duo edge hydrogens (Bauschlicher et al. 2008; Pathak & Rastogi 2008). On the other hand, the 6.2 and 7.7 μm AIBs are primarily associated with medium (≈30−66 C-atoms) and large PAHs of any structure (Schutte et al. 1993; Ricca et al. 2012; Peeters et al. 2017). We thus emphasize that the 6.2/8.6 and 7.7/8.6 μm AIB ratios provide a size estimator independent of the well–known 3.3/11.2 size estimator (Allamandola et al. 1989; Croiset et al. 2016; Maragkoudakis et al. 2020). However, in contrast to the latter, the 6.2/8.6 and 7.7/8.6 μm ratios may only measure the size of a subset of compact PAHs in the interstellar PAH family.
Large, symmetric PAHs responsible for the strong 8.6 μm AIB emission are also inherently enriched in solo edge hydrogens (Pathak & Rastogi 2008). This naturally connects the two cationic AIBs at 8.6 μm and 11.0 μm, where the latter similarly traces large PAHs, albeit through C–H out-of-plane bending vibrations of solo edge hydrogens. The shared origin of the 8.6 and 11.0 μm AIBs in large, compact PAHs is also supported by bright, co-spatial 8.6 and 11.0 μm AIB emissions observed close to the illuminating star in the reflection nebula NGC 2023. This reflects the survival of large, resilient PAHs emitting in the star's strong radiation field (Peeters et al. 2017).
As tracers of medium and large PAH cations, the intensities of the 6.2 and 7.7 μm AIBs and of the 8.6 and 11.0 μm AIBs, respectively, can thus be utilized to probe the spatial distributions of these two populations of charged PAHs. The radial profiles of the 6.2/8.6 and 7.7/8.6 ratios, representing the fraction of medium-to-large cationic PAHs in the Orion Bar, are presented in the third panel of Fig. 3. The general decrease in the ratios toward the surface of the PDR reflects the photochemical loss of small PAHs in the increasingly harsh radiation field. As seen in Fig. 3, most variation in the observed 6.2/8.6 and 7.7/8.6 ratios occurs across DF 3, indicating that small PAHs survive best in the DFs. Schefter et al. (in prep.) further explore the efficacy of the 6.2/8.6 and 7.7/8.6 ratios as indicators of the size of the emitting PAHs, based on their linear relations with the commonly used PAH size tracer, the 3.3/11.2 ratio.
Furthermore, we also present the variation in the ionization fraction of the PAHs throughout the PDR through the radial profile of the 6.2+7.7+8.6 /Total AIB emission in the fourth panel of Fig. 3. The variation in the ionization fraction just beyond proplyd 2 and DF 3 is only about 10%; it is not very sensitive to PAH size (Tielens 2005). The ionization fraction near the IF, however, exhibits a steep “dip”, similar to those seen, for instance, in the profiles of 6.2/11.2 and 7.7/11.2 (Fig. 3). This discrepant behavior just beyond the IF, compared to that in the bulk of the PDR, reflects the contamination of the AIB emission and the morphology of the Orion Bar discussed in Sect. 3.
4.2 The 6.2 μm AIB as a reliable tracer for PAH ions
The population of ionic PAHs in an astronomical environment can be probed by the AIBs at 6.2, 7.7, 8.6, and 11.0 μm. In their study of PAH emission characteristics in NGC 2023, Peeters et al. (2017) posited that, by virtue of their similar spatial behavior, the 8.6 and 11.0 μm bands serve as equally reliable tracers of PAH charge. In contrast, the 7.7 μm AIB has been shown to be “contaminated”, meaning that it comprises two PAH subpopulations: PAH cations and larger species such as PAH clusters (Peeters et al. 2017). However, neither the 8.6 nor the 11.0 μm band exclusively traces PAH charge, as both bands are also influenced by PAH molecular structure and size. As explored in Sect. 4.1, both bands are biased toward large, compact PAH cations, and the 11.0 μm band in particular can also arise from nitrogen-substituted PAHs (Ricca et al. 2021), making it an ambiguous diagnostic of homocyclic PAH ionization.
Turning to the 6.2 μm band, PAH cations strongly exhibit the 6.2 μm band (Bauschlicher et al. 2009) and Maragkoudakis et al. (2022) successfully calibrated the 6.2/11.2 μm PAH band strength ratio against the PAH ionization parameter γ for many galaxies. However, this band too carries intrinsic biases. Theoretical spectra PAHs show that the intrinsic strengths of the C-C and C-H modes respond differently to PAH size (Bauschlicher et al. 2008; Ricca et al. 2012; Lemmens et al. 2023). Particularly, the fraction of absorbed FUV energy emitted in the 6.2 μm band decreases with increasing PAH size, reflecting an intrinsic strength-driven bias (Bauschlicher et al. 2008). In addition, structural family matters: per C atom, the 6.2 μm band is up to ∼ 50% stronger in the coronene PAH family than in the ovalene family (Bauschlicher et al. 2008).
While none of the AIBs provide a bias-free measure of PAH ionization, we conclude that the 6.2/11.2 AIB ratio offers the most representative diagnostic of charged PAHs in the ISM. This is consistent with the recent study by Maragkoudakis et al. (2026), where utilizing PAHdb and pyPAHdb spectral modeling to analyze the MIRI-MRS observations of the Orion Bar, the authors found the 6.2/11.2 PAH ratio to correlate best with γ than the 7.7/11.2 and 8.6/11.2 ratios. It would therefore be advantageous for future space missions to include a photometric filter centered on 6.2 μm to capture this feature and probe the ionic population of PAHs in the ISM.
Taking the 6.2/11.2 ratio to be the best diagnostic of the PAH ionization balance, we compared the average size and ionization fraction in the high-UV environment of the Orion Bar with those of other galaxies explored in Maragkoudakis et al. (2022). In their work Maragkoudakis et al. (2022) show that the correlation of their PAHdb-derived PAH ionization parameter γ and the 6.2/11.2 PAH band strength ratio is the tightest (see Fig. 5 in Maragkoudakis et al. 2022). Using this linear fit, the 6.2/11.2 PAH band strength ratio of ∼ 1.5 in the Orion Bar (Fig. 2) corresponds to γ ≈2.8 × 10⁴. This value is in close agreement with γ ≈3.6 × 10⁴ for the Orion Bar (Sidhu et al. 2022) and ≈4 × 10⁴ at the surface of the PDR, as determined by Salgado et al. (2016). Compared to the galaxies studied by Maragkoudakis et al. (2022), the Orion Bar PDR lies at the higher end in terms of the PAH ionization parameter. This is likely because the galaxies probe somewhat larger, more evolved H II regions with lower densities (ne) and  (Young Owl et al. 2002; Pabst et al. 2022). In terms of average PAH size, Maragkoudakis et al. (2022) find that the PAH population within galaxies consists of middle-sized PAHs with an average number of carbon atoms, NC=55. This agrees with the upper limit of the PAH size range (37−52 carbon atoms) for the Orion Bar, as derived from the 11.2/3.3 intensity ratio-PAH size model of Lemmens et al. (2023). We refer the reader to Schefter et al. (in prep.) for an in-depth analysis of PAH size in the Orion Bar based on JWST observations.
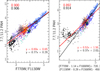 |
Fig. 5 Two strongest correlations between ratios of synthetic F770W, F1130W, and F1500W images and measured 7.7/11.2 spectroscopic PAH emission in the Orion Bar. Here the 7.7 μm feature is measured using the global continuum (Fig. 1). Best-fit lines to the data that exclude (include) the H ii region (black) as well as the region near the IF (teal and dark blue), with equations and Spearman correlation coefficients R are shown in red (black). The stars highlight the average values for the atomic PDR (blue), the H ii region (black), and the region near the IF (teal and dark blue). |
4.3 JWST MIRI Imaging filters as tracers for the PAH ionization fraction
Photometry with JWST has been used for investigating PAH characteristics in a myriad of astronomical environments. Recently, Chown et al. (2025) provided empirical prescriptions for tracing line and PAH emission in the Orion Bar, based on NIRSpec IFU spectroscopy and MIRI images, while Donnelly et al. (2025) provided a prescription for estimating the PAH 7.7 μm and 11.2 μm flux in star-forming regions in four nearby luminous infrared galaxies (LIRGs). We studied a variety of photometry-based prescriptions proposed by Chown et al. (2025) to ascertain which would be the most effective at tracing the ionized fraction of the PAH population. Since MIRI does not have a filter at 6.2 μm, we focused on the viability of the 7.7 μm filter, together with its associated continuum filters, as a tracer of PAH ionization. We utilized synthetic images for the MIRI imaging filters F770W, F1000W, F1130W, and F1500W, generated from the IFU spectroscopic data, as well as the linear combinations of these filters tested by Chown et al. (2025), to trace the 7.7 μm and 11.2 μm PAH emissions. We emphasize that we adopted the global continuum when measuring the 7.7 μm emission for this purpose, as this approach is more consistent with both the F770W filter response and the continuum used by Chown et al. (2025). We provide all the proposed prescriptions using these filters in Appendix D and comment on the main trends as follows.
As seen in Fig. 5, the ratio of the synthetic F770W to F1130W images reproduces the relative 7.7/11.2 PAH emission well through a linear relationship. A good match is also obtained when the F1000W and F1500W filters are used to subtract the contribution of the underlying continua from the F770W and F1130W filters tracing PAH 7.7 and 11.2 μm emission, respectively. However, significant deviations emerge in the H ii region, rooted in the deviations noted by Chown et al. (2025) when estimating the PAH 7.7 μm (resp. 11.2 μm) surface brightnesses using a linear fit to the F770W and F1000W (resp. F1130W and F1000 or F1500W) filters. Indeed, the correlations in Figs. 5 and D.1 involving the continuum filters show that the results for the H ii region, which comprises emission from the background face-on PDR, are well-separated from those for the edge-on PDR. In particular, the 7.7/11.2 ratio experiences little change in the face-on PDR. The aforementioned prescriptions thus reveal the effect of face-on versus edge-on geometry in studying the PAH charge ratio in a target. Positive, linear relations between the photometric filter combinations and the 7.7/11.2 spectroscopic observations exist for the edge-on PDR, whereas the PAH charge ratio as traced by the 7.7/11.2 ratio remains relatively constant for the background face-on PDR. We note, however, that the deviations seen for the H ii region emission disappear when only the F770W/F1130W ratio is considered. We stress that these discrepancies may be specific to the Orion Bar, where the 7.7/11.2 brightness ratio covers only a narrow range. In contrast, studies of larger galaxy samples covering a broader range of this ratio may still reveal underlying correlations.
5 Conclusions
JWST observations of the Orion Bar have allowed for in-depth investigations of the PAH families prevalent in this archetypal PDR. This study focused on exploring the efficacy of the AIBs within the 6−9 μm wavelength domain to probe the charge states and the sizes of the PAHs responsible for these spectral signatures. Analysis of spectroscopic data from the JWST MIRI-MRS IFU instrument yields the following conclusions:
Based on their similar spatial distributions and correlated surface brightnesses, the charge-diagnostic AIBs at 6.2, 7.7, 8.6, and 11.0 μm separate into two groups: (i) the 6.2 and 7.7 μm feature, and (ii) the 8.6 and 11.0 μm feature;
The correlation plots of the 6.2, 7.7, 8.6, and 11.0 μm AIBs reveal a clear branching behavior. Emission from the edgeon PDR – encompassing the bulk of the atomic PDR and DFs – falls along one branch, whereas emission from the face-on PDR, namely the H ii region and regions just beyond the IF, follows a distinct trend. This branching behavior indicates that the relative behavior of these AIBs depends on PDR geometry;
The 8.6 and 11.0 μm bands are characteristic of large, compact, cationic PAHs, whereas the 6.2 and 7.7 μm bands dominate in large and medium-sized cationic PAHs. Consequently, the 6.2/8.6 and 7.7/8.6 ratios provide valuable probes of the size distribution of the emitting PAH population, serving as an alternative to the commonly used 3.3/11.2 size diagnostic;
As tracers of PAH charge, all AIBs (6.2, 7.7, 8.6, and 11.0 μm) are inherently biased toward the specific PAH subpopulations they probe. Among them, the 6.2 μm AIB emerges as the most reliable diagnostic of PAH charge in the ISM;
The PAH properties can be studied well through JWST photometry. Myriad prescriptions that utilize MIRI imaging filters at F770W, F1000W, F1130W, and F1500W have proven effective at estimating the PAH ionization fraction, as probed by the 7.7/11.2 PAH emission, in edge-on PDRs. In contrast, the simpler F770W/F1130W photometric ratio provides the best diagnostic for this fraction in face-on PDRs. Since these conclusions are based on the study of the Orion Bar, further studies of additional PDRs are required to probe the full diversity of the astronomical 7.7/11.2 PAH ratio.
Acknowledgements
This work is based on observations made with the NASA/ESA/CSA James Webb Space Telescope. The data were obtained from the Mikulski Archive for Space Telescopes at the Space Telescope Science Institute, which is operated by the Association of Universities for Research in Astronomy, Inc., under NASA contract NAS 5-03127 for JWST. These observations are associated with program #1288 (DOI: 10.17909/pg4c-1737). Support for program #1288 was provided by NASA through a grant from the Space Telescope Science Institute, which is operated by the Association of Universities for Research in Astronomy, Inc., under NASA contract NAS 5-03127. Els Peeters and Jan Cami acknowledge support from the University of Western Ontario, the Canadian Space Agency (CSA, 22JWGO1-16), and the Natural Sciences and Engineering Research Council of Canada. This article is based upon work from COST Action CA21126 – Carbon molecular nanostructures in space (NanoSpace), supported by COST (European Cooperation in Science and Technology). Takashi Onaka acknowledges the support by the Japan Society for the Promotion of Science (JSPS) KAKENHI Grant Number JP24K07087. Christiaan Boersma is grateful for an appointment at NASA Ames Research Center through the San José State University Research Foundation (80NSSC22M0107).
References
- Allamandola, L. J., Tielens, A. G. G. M., & Barker, J. R., 1985, ApJ, 290, L25 [Google Scholar]
- Allamandola, L. J., Tielens, A. G. G. M., & Barker, J. R., 1989, ApJS, 71, 733 [Google Scholar]
- Allamandola, L. J., Hudgins, D. M., & Sandford, S. A., 1999, ApJ, 511, L115 [Google Scholar]
- Bally, J., 2008, in Handbook of Star Forming Regions, Volume I, 4, ed. B. Reipurth, 459 [Google Scholar]
- Bauschlicher, Charles W., J., Peeters, E., & Allamandola, L. J. 2008, ApJ, 678, 316 [NASA ADS] [CrossRef] [Google Scholar]
- Bauschlicher, Charles W., J., Peeters, E., & Allamandola, L. J. 2009, ApJ, 697, 311 [NASA ADS] [CrossRef] [Google Scholar]
- Berné, O., Habart, É., Peeters, E., et al. 2022, PASP, 134, 054301 [CrossRef] [Google Scholar]
- Bregman, J., & Temi, P., 2005, ApJ, 621, 831 [CrossRef] [Google Scholar]
- Candian, A., Sarre, P. J., & Tielens, A. G. G. M., 2014, ApJ, 791, L10 [CrossRef] [Google Scholar]
- Chown, R., Sidhu, A., Peeters, E., et al. 2024, A&A, 685, A75 [NASA ADS] [CrossRef] [EDP Sciences] [Google Scholar]
- Chown, R., Okada, Y., Peeters, E., et al. 2025, A&A, 698, A86 [NASA ADS] [CrossRef] [EDP Sciences] [Google Scholar]
- Croiset, B. A., Candian, A., Berné, O., & Tielens, A. G. G. M., 2016, A&A, 590, A26 [NASA ADS] [CrossRef] [EDP Sciences] [Google Scholar]
- Donnelly, G. P., Lai, T. S. Y., Armus, L., et al. 2025, ApJ, 983, 79 [Google Scholar]
- Galliano, F., Madden, S. C., Tielens, A. G. G. M., Peeters, E., & Jones, A. P., 2008, ApJ, 679, 310 [Google Scholar]
- Gillett, F. C., Forrest, W. J., & Merrill, K. M., 1973, ApJ, 183, 87 [NASA ADS] [CrossRef] [Google Scholar]
- Goicoechea, J. R., Pety, J., Cuadrado, S., et al. 2025, A&A, 696, A100 [NASA ADS] [CrossRef] [EDP Sciences] [Google Scholar]
- Habart, E., Peeters, E., Berné, O., et al. 2024, A&A, 685, A73 [NASA ADS] [CrossRef] [EDP Sciences] [Google Scholar]
- Habing, H. J., 1968, Bull. Astron. Inst. Netherlands, 19, 421 [Google Scholar]
- Hony, S., Van Kerckhoven, C., Peeters, E., et al. 2001, A&A, 370, 1030 [CrossRef] [EDP Sciences] [Google Scholar]
- Khan, B., Abbott, Benjamin, Peeters, Els, et al. 2025, A&A, 699, A133 [NASA ADS] [CrossRef] [EDP Sciences] [Google Scholar]
- Lemmens, A. K., Mackie, C. J., Candian, A., et al. 2023, Faraday Discuss., 245, 380 [Google Scholar]
- Li, A., 2020, Nat. Astron., 4, 339 [CrossRef] [Google Scholar]
- Maragkoudakis, A., Boersma, C., Peeters, E., et al. 2026, A&A, 709, A38 [NASA ADS] [CrossRef] [EDP Sciences] [Google Scholar]
- Maragkoudakis, A., Boersma, C., Temi, P., Bregman, J. D., & Allamandola, L. J., 2022, ApJ, 931, 38 [CrossRef] [Google Scholar]
- Maragkoudakis, A., Peeters, E., & Ricca, A., 2020, MNRAS, 494, 642 [NASA ADS] [CrossRef] [Google Scholar]
- Merrill, K. M., Soifer, B. T., & Russell, R. W., 1975, ApJ, 200, L37 [Google Scholar]
- Oomens, J., Tielens, A. G. G. M., Sartakov, B. G., von Helden, G., & Meijer, G., 2003, ApJ, 591, 968 [Google Scholar]
- Pabst, C. H. M., Goicoechea, J. R., Hacar, A., et al. 2022, A&A, 658, A98 [NASA ADS] [CrossRef] [EDP Sciences] [Google Scholar]
- Pathak, A., & Rastogi, S., 2008, A&A, 485, 735 [NASA ADS] [CrossRef] [EDP Sciences] [Google Scholar]
- Peeters, E., Hony, S., Van Kerckhoven, C., et al. 2002, A&A, 390, 1089 [NASA ADS] [CrossRef] [EDP Sciences] [Google Scholar]
- Peeters, E., Bauschlicher, Charles W., J., Allamandola, L. J., et al. 2017, ApJ, 836, 198 [NASA ADS] [CrossRef] [Google Scholar]
- Peeters, E., Habart, E., Berné, O., et al. 2024, A&A, 685, A74 [NASA ADS] [CrossRef] [EDP Sciences] [Google Scholar]
- Ricca, A., Bauschlicher, Charles W., J., Boersma, C., Tielens, A. G. G. M., & Allamandola, L. J. 2012, ApJ, 754, 75 [NASA ADS] [CrossRef] [Google Scholar]
- Ricca, A., Boersma, C., & Peeters, E., 2021, ApJ, 923, 202 [NASA ADS] [CrossRef] [Google Scholar]
- Salgado, F., Berné, O., Adams, J. D., et al. 2016, ApJ, 830, 118 [Google Scholar]
- Schroetter, I., Berné, O., Joblin, C., et al. 2024, A&A, 685, A78 [NASA ADS] [CrossRef] [EDP Sciences] [Google Scholar]
- Schutte, W. A., Tielens, A. G. G. M., & Allamandola, L. J., 1993, ApJ, 415, 397 [NASA ADS] [CrossRef] [Google Scholar]
- Shannon, M. J., Stock, D. J., & Peeters, E., 2016, ApJ, 824, 111 [NASA ADS] [CrossRef] [Google Scholar]
- Sidhu, A., Peeters, E., Cami, J., & Knight, C., 2021, MNRAS, 500, 177 [Google Scholar]
- Sidhu, A., Tielens, A. G. G. M., Peeters, E., & Cami, J., 2022, MNRAS, 514, 342 [NASA ADS] [CrossRef] [Google Scholar]
- Tielens, A. G. G. M., 2005, The Physics and Chemistry of the Interstellar Medium [Google Scholar]
- Tielens, A. G. G. M., 2008, ARA&A, 46, 289 [Google Scholar]
- Tielens, A. G. G. M., & Hollenbach, D., 1985, ApJ, 291, 747 [NASA ADS] [CrossRef] [Google Scholar]
- Van De Putte, D., Meshaka, R., Trahin, B., et al. 2024, A&A, 687, A86 [NASA ADS] [CrossRef] [EDP Sciences] [Google Scholar]
- Wright, G. S., Wright, D., Goodson, G. B., et al. 2015, PASP, 127, 595 [NASA ADS] [CrossRef] [Google Scholar]
- Young Owl, R. C., Meixner, M. M., Fong, D., et al. 2002, ApJ, 578, 885 [NASA ADS] [CrossRef] [Google Scholar]
The Short-Wavelength Spectrometer (SWS) on board the European Space Agency (ESA)'s Infrared Space Observatory (ISO).
The Infrared Spectrograph (IRS) on the Spitzer Space Telescope.
Appendix A JWST NIRCam image of the Orion Bar
Wavelength ranges for integrating the specific surface brightness of the AIBs studied.
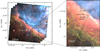 |
Fig. A.1 Composite JWST NIRCam image of the Orion Bar. The JWST-MIRI/MRS IFU FOV is overlaid in white, and the spectral extraction apertures for the five template spectra are indicated with labels and black boxes in the right panel. The red, green, and blue colors encode the F335M (the 3.3 μm AIB), F470N-F444W (H2 emission), and F187N (Paschen α emission), respectively Habart et al. (2024). The ionizing source for the Orion Bar, θ1 Ori C, is represented by the star (*) at the top right edge of the left panel. Right: Two proplyds 203-504 and 203-506 (black circles). The dashed black line indicates the cut across the MIRI mosaic (position angle, PA, of 155.79°). This figure is adapted from Chown et al. (2024), with permission. |
Appendix B Integration ranges
The surface brightnesses of the AIBs studied in this paper were obtained through integrating the specific surface brightnesses as outlined in Khan et al. (2025). The wavelength ranges used for these integrations are provided in Table B.1.
Appendix C Additional maps, radial profiles, and correlation plots
We present all the radial profiles, spectral maps and correlation plots, including those for the 7.7 and 8.6 μm AIBs measured using both the local and global continua (Fig. 1), in Fig. C.1, C.2, and C.3, respectively.
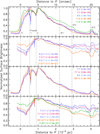 |
Fig. C.1 Normalized surface brightnesses and their ratios for the 6.2, 7.7, 8.6, 11.0, and 11.2 μm AIBs as a function of distance to the IF (0.228 pc or 113.4” from θ1 Ori C) along a cut crossing the mosaic (see Fig. 2 for the location of the cut). Here, we include radial profies for the 7.7 and 8.6 μm AIBs measured using both the local and global continua (Fig. 1), for comparison. Normalization factors are listed in W m−2 sr−1 in parentheses for each surface brightness. As the cut is not perpendicular to the IF and distances are given along the cut, a correction factor of cos (19.58°)=0.942 needs to be applied to obtain a perpendicular distance from the IF. |
There exist subtle differences in morphology at the DFs when the 7.7 and 8.6 μm are measured using the two continua, as seen in Fig. C.1. The 8.6 μm surface brightness declines faster across the DFs when the local continuum is used instead of the global continuum. The 8.6 μm AIB measured using the global continuum exhibits local peaks just after each DF, which are no longer detected with the local continuum. This difference in behavior for the 7.7 μm AIB is minimal. Thus, with the choice of the local continuum, the enhanced emission of the 8.6 μm in the molecular PDR detected with the global continuum is no longer seen.
Per Fig. C.3, the branches observed in the 8.6 versus 7.7 and 6.2 μm plots are well-separated when taking into account the local continuum instead of the global continuum. We note that with the choice of the global continuum to measure the 7.7 and 8.6 μm bands, the normalized 8.6 versus 11.0 μm AIB correlation worsens, while the correlations with the 6.2 and 7.7 μm AIB surface brightnesses improve in terms of the values of R. Overall, the choice of the continuum significantly influences the correlations involving the 8.6 μm AIB.
Appendix D PAH 7.7/11.2 ratio prescriptions
The MIRI filter combinations that were tested to match the images to the 7.7/11.2 PAH emission ratio in the Orion bar PDR are presented in Table D.1, in decreasing order of the correlation coefficients for the edge-on Orion Bar PDR, which are presented in the correlation plots in Fig. D.1.
Suggested MIRI filter combinations to recover the PAH 7.7/11.2 ratio.
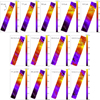 |
Fig. C.2 Spatial distribution of the surface brightnesses of the 6.2, 7.7, 8.6, 11.0, and 11.2 μm AIBs in the Orion Bar PDR, in units of Wm−2 sr−1, and brightness ratios relative to the 11.2 μm AIB. Here, maps of the 7.7 and 8.6 μm AIBs measured using both the local and global continua (Fig. 1) are presented for comparison. θ1 Ori C is located toward the top right of each map. For each map, the range of the corresponding color bar is set between 0.5% and 99.5% percentile level for the data, while zero pixels, edge pixels, and pixels covering the two proplyds as seen in the MIRI mosaic, indicated by the black circles, are masked out. The contours trace peak emission for the 11.0 μm AIB (white), the 11.2 μm AIB (teal). The rectangular apertures of the template spectra for the H ii region, atomic PDR, DF 1, DF 2, and DF 3, from top to bottom, are shown in gray, the gray lines delineate the IF and the three DFs, DF 1, DF 2, and DF 3, and the dashed, diagonal white line in the top left map indicates the cut across the MIRI mosaic (position angle of 155.79°). |
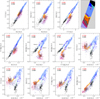 |
Fig. C.3 Correlations of the 7.7/11.2, 8.6/11.2, and 11.0/11.2 AIB surface brightness ratios, where plots involving the 7.7 and 8.6 μm AIBs measured using both the local and global continua (Fig. 1) are presented for comparison. The Spearman correlation coefficient ρ for the variables excluding (including) the points from the H ii region (black), and regions beneath the IF (teal and dark blue), are printed in red (black) in the panels. Only surface brightnesses from every other spaxel are considered in the correlation analyses. The data points are colored according to regions in the mosaic where those pixels are located (top right panel). |
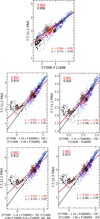 |
Fig. D.1 Correlations between ratios of the synthetic images involving F770W, F1130W, and F1500W and the measured 7.7/11.2 spectroscopic PAH emission in the Orion Bar. Here the 7.7 μm feature is measured using the global continuum (Fig. 1). Lines of best-fit through the data excluding (including) the points from the H II region (black), and the regions near the IF (teal and dark blue), their equations and the Spearman correlation coefficients R are shown in red (black). The star symbols highlight the average values for the atomic PDR (blue), the H ii region (black) and the region near the IF (teal and dark blue). |
All Tables
Wavelength ranges for integrating the specific surface brightness of the AIBs studied.
All Figures
|
Fig. 1 AIB template spectrum for the Orion Bar atomic PDR, showcasing the 6.2, 7.7, 8.6, 11.0, and 11.2 μm AIBs shaded in red and indicated by the vertical solid blue lines. The blue curve shows the underlying “global” continuum, the orange curve indicates the “local” continuum (lc), and the black round symbols mark the anchor points used for the continua determination. |
| In the text | |
|
Fig. 2 Spatial distribution of the surface brightnesses of the 6.2, 7.7, 8.6, 11.0, and 11.2 μm AIBs in the Orion Bar PDR in units of Wm−2 sr−1, and brightness ratios relative to the 11.2 μm AIB. The analysis utilizes the 7.7 and 8.6 μm bands measured using a local continuum (lc; Fig. 1). θ1 Ori C is located at the top right of each map. For each map, the color bars span 0.5−99.5% percentiles. The zero pixels, edge pixels, and the two proplyds in black circles seen in the MIRI mosaic, are masked out. The contours trace peak emission for the 11.0 μm AIB (white) and the 11.2 μm AIB (teal). The gray rectangles show template spectra apertures (H ii region, atomic PDR, DF 1, DF 2, and DF 3 from top to bottom); the gray lines delineate the IF and the three DFs (DF 1, DF 2, and DF 3); and the dashed, diagonal white line (top left) indicates the cut across the MIRI mosaic (position angle of 155.79°). |
| In the text | |
|
Fig. 3 Normalized surface brightnesses and ratios for the 6.2, 7.7, 8.6, 11.0, and 11.2 μm AIBs as a function of distance to the IF (0.228 pc or 113.4′′ from θ1 Ori C) along a cut crossing the mosaic (see Fig. 2 for the location of the cut). Normalization factors are listed in W m−2 sr−1 in parentheses for each surface brightness. As the cut is not perpendicular to the IF and distances are given along the cut, a correction factor of cos (19.58°)=0.942 must be applied to obtain a perpendicular distance from the IF. |
| In the text | |
|
Fig. 4 Correlations of the 7.7[lc]/11.2,8.6[lc]/11.2, and 11.0/11.2 AIB surface brightness ratios. The Spearman correlation coefficients (“R”) for the variables excluding (including) the points from the H ii region (black) and the regions beneath the IF (teal and dark blue) are indicated in red (black). Only the surface brightnesses from alternate spaxels are considered in the correlation analyses. The data points are colored according to regions in the mosaic where those pixels are located (top right panel). This visual region-color scheme is as follows: blue (atomic PDR), dark blue (east IF), teal (west IF), purple (DF 1), yellow (region between DF 1 and DF 2), orange (DF 2), light brown (region west of DF 2), brown (region between DF 2 and DF 3), pink (DF 3), and light purple (region beyond DF 3). The contours highlighting DF 2 and DF 3 are identified through enhanced emission of H2 0−0 S(3) in these DFs. The red circular regions on the color-region map (top right panel) correspond to the protoplanetary disks along the line of sight, which are masked in this analysis. |
| In the text | |
|
Fig. 5 Two strongest correlations between ratios of synthetic F770W, F1130W, and F1500W images and measured 7.7/11.2 spectroscopic PAH emission in the Orion Bar. Here the 7.7 μm feature is measured using the global continuum (Fig. 1). Best-fit lines to the data that exclude (include) the H ii region (black) as well as the region near the IF (teal and dark blue), with equations and Spearman correlation coefficients R are shown in red (black). The stars highlight the average values for the atomic PDR (blue), the H ii region (black), and the region near the IF (teal and dark blue). |
| In the text | |
|
Fig. A.1 Composite JWST NIRCam image of the Orion Bar. The JWST-MIRI/MRS IFU FOV is overlaid in white, and the spectral extraction apertures for the five template spectra are indicated with labels and black boxes in the right panel. The red, green, and blue colors encode the F335M (the 3.3 μm AIB), F470N-F444W (H2 emission), and F187N (Paschen α emission), respectively Habart et al. (2024). The ionizing source for the Orion Bar, θ1 Ori C, is represented by the star (*) at the top right edge of the left panel. Right: Two proplyds 203-504 and 203-506 (black circles). The dashed black line indicates the cut across the MIRI mosaic (position angle, PA, of 155.79°). This figure is adapted from Chown et al. (2024), with permission. |
| In the text | |
|
Fig. C.1 Normalized surface brightnesses and their ratios for the 6.2, 7.7, 8.6, 11.0, and 11.2 μm AIBs as a function of distance to the IF (0.228 pc or 113.4” from θ1 Ori C) along a cut crossing the mosaic (see Fig. 2 for the location of the cut). Here, we include radial profies for the 7.7 and 8.6 μm AIBs measured using both the local and global continua (Fig. 1), for comparison. Normalization factors are listed in W m−2 sr−1 in parentheses for each surface brightness. As the cut is not perpendicular to the IF and distances are given along the cut, a correction factor of cos (19.58°)=0.942 needs to be applied to obtain a perpendicular distance from the IF. |
| In the text | |
|
Fig. C.2 Spatial distribution of the surface brightnesses of the 6.2, 7.7, 8.6, 11.0, and 11.2 μm AIBs in the Orion Bar PDR, in units of Wm−2 sr−1, and brightness ratios relative to the 11.2 μm AIB. Here, maps of the 7.7 and 8.6 μm AIBs measured using both the local and global continua (Fig. 1) are presented for comparison. θ1 Ori C is located toward the top right of each map. For each map, the range of the corresponding color bar is set between 0.5% and 99.5% percentile level for the data, while zero pixels, edge pixels, and pixels covering the two proplyds as seen in the MIRI mosaic, indicated by the black circles, are masked out. The contours trace peak emission for the 11.0 μm AIB (white), the 11.2 μm AIB (teal). The rectangular apertures of the template spectra for the H ii region, atomic PDR, DF 1, DF 2, and DF 3, from top to bottom, are shown in gray, the gray lines delineate the IF and the three DFs, DF 1, DF 2, and DF 3, and the dashed, diagonal white line in the top left map indicates the cut across the MIRI mosaic (position angle of 155.79°). |
| In the text | |
|
Fig. C.3 Correlations of the 7.7/11.2, 8.6/11.2, and 11.0/11.2 AIB surface brightness ratios, where plots involving the 7.7 and 8.6 μm AIBs measured using both the local and global continua (Fig. 1) are presented for comparison. The Spearman correlation coefficient ρ for the variables excluding (including) the points from the H ii region (black), and regions beneath the IF (teal and dark blue), are printed in red (black) in the panels. Only surface brightnesses from every other spaxel are considered in the correlation analyses. The data points are colored according to regions in the mosaic where those pixels are located (top right panel). |
| In the text | |
|
Fig. D.1 Correlations between ratios of the synthetic images involving F770W, F1130W, and F1500W and the measured 7.7/11.2 spectroscopic PAH emission in the Orion Bar. Here the 7.7 μm feature is measured using the global continuum (Fig. 1). Lines of best-fit through the data excluding (including) the points from the H II region (black), and the regions near the IF (teal and dark blue), their equations and the Spearman correlation coefficients R are shown in red (black). The star symbols highlight the average values for the atomic PDR (blue), the H ii region (black) and the region near the IF (teal and dark blue). |
| In the text | |
Current usage metrics show cumulative count of Article Views (full-text article views including HTML views, PDF and ePub downloads, according to the available data) and Abstracts Views on Vision4Press platform.
Data correspond to usage on the plateform after 2015. The current usage metrics is available 48-96 hours after online publication and is updated daily on week days.
Initial download of the metrics may take a while.