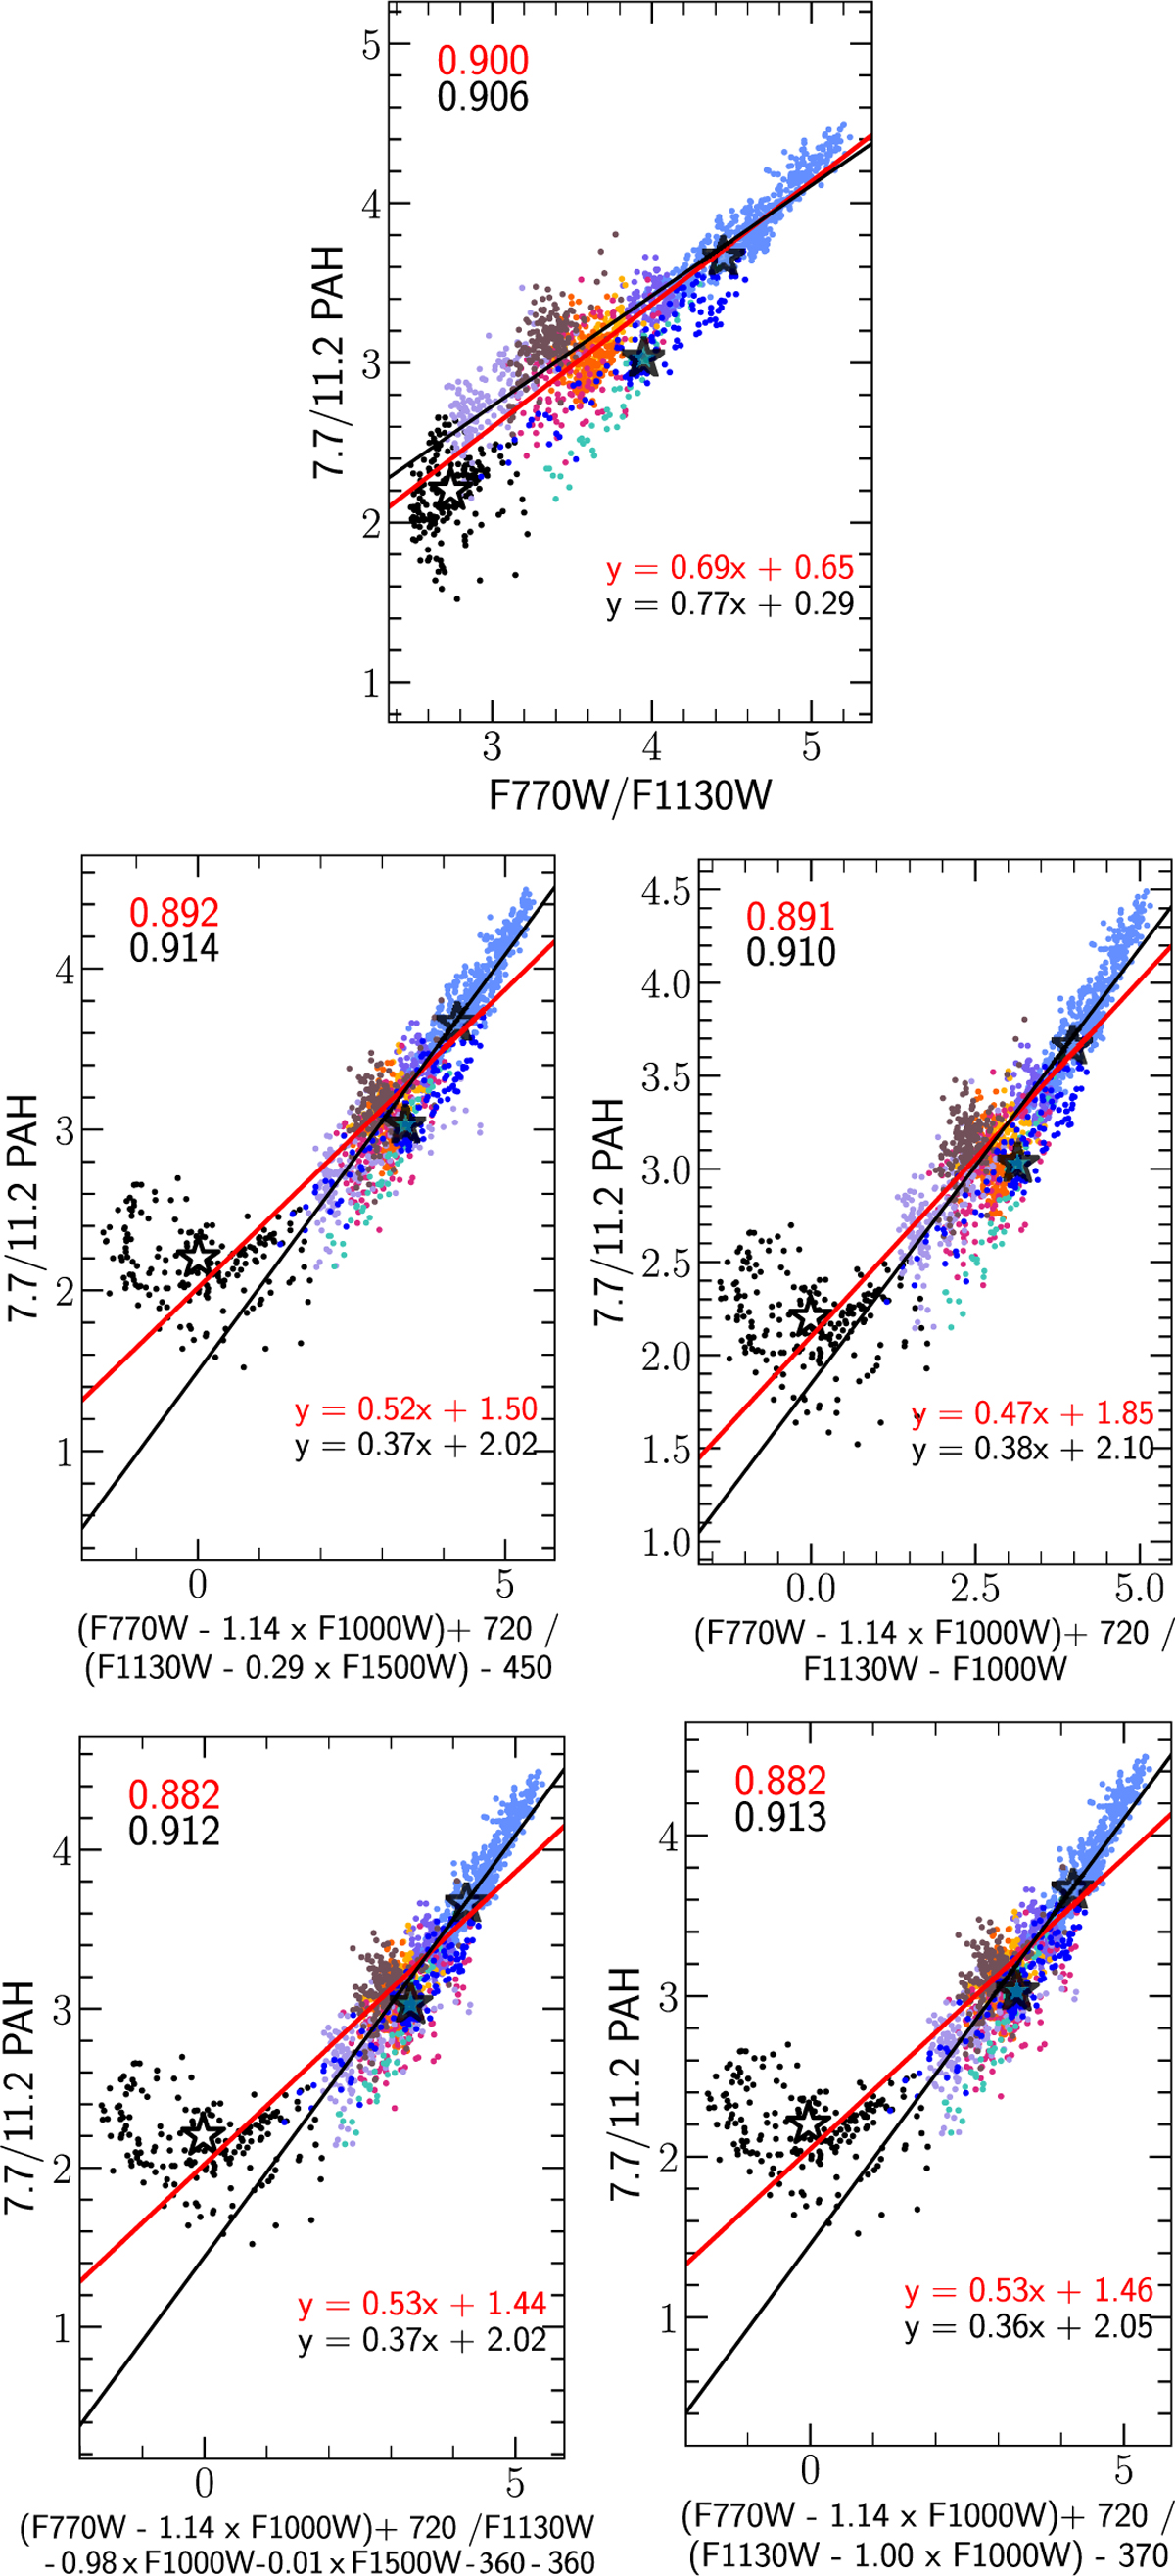
Fig. D.1
Download original image
Correlations between ratios of the synthetic images involving F770W, F1130W, and F1500W and the measured 7.7/11.2 spectroscopic PAH emission in the Orion Bar. Here the 7.7 μm feature is measured using the global continuum (Fig. 1). Lines of best-fit through the data excluding (including) the points from the H II region (black), and the regions near the IF (teal and dark blue), their equations and the Spearman correlation coefficients R are shown in red (black). The star symbols highlight the average values for the atomic PDR (blue), the H ii region (black) and the region near the IF (teal and dark blue).
Current usage metrics show cumulative count of Article Views (full-text article views including HTML views, PDF and ePub downloads, according to the available data) and Abstracts Views on Vision4Press platform.
Data correspond to usage on the plateform after 2015. The current usage metrics is available 48-96 hours after online publication and is updated daily on week days.
Initial download of the metrics may take a while.