| Issue |
A&A
Volume 709, May 2026
|
|
|---|---|---|
| Article Number | A20 | |
| Number of page(s) | 13 | |
| Section | Galactic structure, stellar clusters and populations | |
| DOI | https://doi.org/10.1051/0004-6361/202555265 | |
| Published online | 28 April 2026 | |
Dynamical state of four open clusters
1
School of Science, Hunan Institute of Technology,
Hengyang
421002,
China
2
School of Science, Chongqing University of Posts and Telecommunications,
Chongqing
400065,
China
3
Key Laboratory of Optical Astronomy, National Astronomical Observatories, Chinese Academy of Sciences,
Beijing
100012,
China
4
School of Astronomy and Space Science, University of Chinese Academy of Sciences,
Beijing
101408,
China
★ Corresponding authors: This email address is being protected from spambots. You need JavaScript enabled to view it.
; This email address is being protected from spambots. You need JavaScript enabled to view it.
; This email address is being protected from spambots. You need JavaScript enabled to view it.
Received:
23
April
2025
Accepted:
17
March
2026
Abstract
Context. Open clusters are vital laboratories for studying stellar dynamics and evolution, with mass segregation – the preferential concentration of massive stars toward cluster cores – serving as a key indicator of internal dynamical processes. This study investigates four open clusters (NGC 7243, NGC 2301, NGC 1528, and NGC 2281; ages 100–650 Myr) using deep multicolor photometry from the Beijing-Arizona-Taiwan-Connecticut (BATC) Sky Survey, combined with Gaia Data Release 3 (DR3), to explore their mass functions and dynamical states.
Aims. The work seeks to characterize mass segregation patterns across spatial scales to establish its origin (primordial vs. dynamical) and to provide the first conclusive evidence of mass segregation in NGC 2281. Additionally, we analyze how cluster relaxation timescales and evolutionary stages influence their dynamical architectures.
Methods. Fundamental parameters were derived via Bayesian methods. The tidal radii were determined from the intersection of the observed cumulative mass profiles and theoretical tidal mass curves, and mass functions were analyzed through power-law fits (Φ(m) ∝ mα) performed separately for the inner (bound) and outer (tidal) regions.
Results. All clusters exhibit signs of mass segregation. However, only NGC 2281 shows a statistically significant steepening of the mass function slope in its outer tidal region, indicating significant evaporation of low-mass stars and providing the first clear evidence of strong, dynamically evolved mass segregation in this cluster. For NGC 7243, NGC 2301, and NGC 1528, the derived τ values (τ = Age/trelax > 3) suggest advanced dynamical evolution, yet their outer regions contain too few stars to robustly confirm the expected steepening of the mass function.
Key words: stars: fundamental parameters / stars: luminosity function, mass function
© The Authors 2026
 Open Access article, published by EDP Sciences, under the terms of the Creative Commons Attribution License (https://creativecommons.org/licenses/by/4.0), which permits unrestricted use, distribution, and reproduction in any medium, provided the original work is properly cited.
This article is published in open access under the Subscribe to Open model. This email address is being protected from spambots. You need JavaScript enabled to view it. to support open access publication.
1 Introduction
Open clusters are gravitationally bound stellar systems formed from the collapse of a single giant molecular cloud (Kroupa 2008). Their member stars share similar ages, metallicities, and kinematic properties, making them ideal laboratories for the studies of star formation, stellar evolution, and the dynamics of stellar systems. The dynamical evolution of open clusters is influenced by complex mechanisms such as stellar escape, tidal stripping, and interactions with Galactic spiral arms or molecular clouds. These processes collectively determine the clusters’ lifespans and structures: low-mass clusters are more susceptible to tidal disruption, while massive clusters may gradually evolve into globular clusters over billions of years. In addition, one important and interesting aspect in the study of open clusters is the phenomenon of mass segregation; that is, the more massive member stars in the cluster are more centrally concentrated and/or have a distinct distribution in velocity space compared to lower-mass members (Chen et al. 2007). Due to two-body relaxation, mass segregation is known as dynamical mass segregation. Through two-body relaxation, equipartition of kinetic energy among different mass groups in the cluster can be achieved (Gouliermis et al. 2004). This means that low-mass stars can attain high velocities and move away from the cluster center, leading to a higher concentration of high-mass stars toward the center of the cluster (Sharma et al. 2008). According to numerical simulations, dynamical mass segregation occurs on the cluster relaxation time (Bonnell & Davies 1998). However, the mass segregation also appears in the very young open cluster, which is younger than its relaxation time. This is known as primordial mass segregation. The primordial mass segregation can be either the signature of the initial conditions and loci or can result – at least partially – from early dynamics (Gouliermis et al. 2004, and references therein). Recent advancements, particularly the high-precision astrometric data from the Gaia satellite, have allowed researchers to trace the 3D motions of cluster members with unprecedented accuracy, revealing internal velocity dispersions, rotational features, and tidal tails (Wu et al. 2021; Hu et al. 2021; Zhong et al. 2022; Hao et al. 2022). These observations provide new constraints on the origins of mass segregation, including the relative contributions of dynamical relaxation versus primordial segregation.
Furthermore, comparing a cluster’s initial mass function with its dynamical mass function (DMF) offers insights into star formation efficiency and the loss of low-mass stars during evolution (Kroupa 2001; Baumgardt 2003; Parmentier & Gilmore 2007). For instance, mass segregation not only manifests spatially but may also influence velocity distributions through energy equipartition – where massive stars with lower velocities tend to concentrate, while low-mass stars with higher kinetic energies, migrate to the outskirts (Khalisi et al. 2007). The alignment of these theoretical predictions with observations is critical for understanding the physical conditions during cluster formation (e.g., turbulence and magnetic fields) and refining long-term evolutionary models. Thus, systematic studies of open clusters across multiple dimensions – structure, kinematics, and mass functions – not only advance stellar dynamics but also provide key clues for galactic archaeology.
In this paper, we investigate the phenomenon of mass segregation in four open clusters: NGC 7243, NGC 2301, NGC 1528, and NGC 2281. These open clusters cover a range of ages from 100 Myr to 600 Myr. The basic information of these open clusters taken from the WEBDA database is listed in Table 1. These open clusters were studied by Frolov & Ananjevskaja (2007), Sharma et al. (2008), and Francic et al. (1989). Because of the small field of view and shallow photometry, mass functions were not examined in detail in these studies. We study these open clusters using photometry from deep observations over a large field of view. Our study is based on a consistent set of BATC observations, supplemented by member lists from Gaia DR3 (Hunt & Reffert 2023), which allows us to search for mass segregation in a uniform manner and to investigate the differences among the clusters concerning the phenomenon with an expanded spatial coverage. In this paper, we present multi-color photometry of these open clusters, obtained with the BATC Multicolor Survey photometric system. The BATC photometric system consists of 15 intermediate-band filters covering the 3000–10 000 Å wavelength range, designed to avoid most of the known bright and variable night-sky emission lines. This filter system is appropriate for obtaining the spectral energy distributions (SEDs) of objects. In the BATC system, an E2V 4k × 4k thinned Charge-Coupled Device (CCD) with a pixel size of 12 µm, a field of view of 94′ × 94′, and a resolution of 1,36″ pixel−1(Fan et al. 2009) is used. Taking advantage of deep photometry and the BATC photometric system’s large field of view, we investigate open clusters in our Galaxy. In previous work, we used photometry from the BATC photometric system to study open clusters in our Galaxy: M67 (Fan et al. 1996); M48 and NGC 7789 (Wu et al. 2005, 2006, 2007); and NGC 188 and NGC 1039 (Wang et al. 2015, 2017). In this study, we examined the dynamical state of four open clusters. For this purpose, we first derived fundamental parameters (age, metallicity, distance, and reddening) via Bayesian analysis of the multicolor photometry. Subsequently, we determined a physically motivated tidal radius (Rt) for each cluster by comparing the observed cumulative mass profile with the theoretical tidal mass curve in the Galactic potential following the method of Röser et al. (2011). Stars inside Rt were treated as bound members, while those outside were considered part of the tidal region. Finally, we constructed and compared the present-day mass functions (PDMFs) separately for the inner (R < Rt) and outer (R > Rt) regions to quantify mass segregation and assess the clusters’ dynamical ages.
We present our new observations and photometric data in Section 2. In Section 3, we derive the fundamental parameters of the four open clusters and derive their tidal radii and mass functions in Section 4. We provide a summary in Section 5.
Basic information of the four open clusters provided by WEBDA.
Parameters of 14 BATC filters.
2 Observation and photometric data
2.1 Observation
The observations were carried out using the BATC photometric system with the 60/90 cm f/3 Schmidt telescope at the Xinglong Station of the National Astronomical Observatories, Chinese Academy of Sciences (NAOC). More details about the BATC system are described in Yan et al. (2000). Images of open clusters observed by the BATC o band are shown in Fig. 1. The parameters of the BATC filters are given in Table 2. Columns 1 and 2 list the IDs and names of the BATC filters; Columns 3 and 4 list the effective wavelength and full width at half-maximum (FWHM) of each filter. The observational details for each open cluster are given in Table A.1, including the exposure time and the number of frames per filter. The typical seeing in these observations is 3,″6 ± 0,″5. Because the images observed in the p band are not deep enough, the photometric data of this band are not used here.
2.2 Photometric data
Photometric reduction was carried out as follows. Using the automatic data processing program, PIPELINE I (Fan et al. 1996), we preformed standard bias subtraction and field flatting.
Wide-field images typically have optical distortions that cause the point spread function (PSF) to vary across the field; therefore, the full image was divided into nine subregions. In the subregion, the PSF almost does not vary with location. Thus, we used the PIPELINE II program based on the DAOPHOT II stellar photometric reduction package of Stetson (1987) to measure the instrumental magnitudes of point sources in the subregions. Subsequently, the instrumental magnitudes Minst were calibrated to the BATC AB magnitude Mbatc (see Zhou et al. 2003; Ma et al. 2017, for details). The value of Mbatc − Minst and the calibration error are listed in Columns 4 and 5 of Table A.1, respectively. For each star observed more than once in a BATC band, the final photometry in that band is its weighted mean.
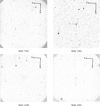 |
Fig. 1 BATC o-band images of the target open cluster regions. The field of view is 94′ × 94′. |
2.3 Completeness correction
To derive the mass functions of open clusters, the completeness estimation is required. We adopted the artificial star test (see Wu et al. 2007, for details) to obtain the completeness correction. Artificial stars are generated based on the PSF and luminosity distribution of the original images and uniformly distributed across them. To avoid overcrowding, the total number of artificial stars was limited to 15% of the original number. The photometric reduction was then carried out on these test images using the same parameters and procedures as for the original images described in Section 2.2. The proportion of recovered artificial stars among all added artificial stars is defined as the completeness correction. Table A.2 lists the completeness corrections for each open cluster.
3 Fundamental parameters
3.1 Preliminary candidate cluster members
To determine the fundamental parameters of open clusters, we needed samples of preliminary candidate cluster members. We chose preliminary candidate cluster members based on the membership probabilities of stars and cluster radii provided by the Milky Way Star Clusters (MWSC) catalog (Kharchenko et al. 2012, 2013). First, we cross-matched our star catalog and the MWSC catalog using a matching tolerance of 1,0″ to identify common stars. Next, we selected stars with membership probabilities higher than 61% and located within cluster radii. These stars define the stellar samples used in our subsequent analysis. Preliminary candidate cluster member counts are listed in Table 3.
Starting values for BASE-9.
3.2 Bayesian method
In general, the fundamental parameters of an open cluster can be derived by visually fitting an isochrone to observed data points on a color magnitude diagram (CMD) or color–color diagram. However, there are some problems with this method. Owing to the degeneracy between fundamental parameters such as age and metallicity, and between metallicity and reddening, we find that isochones with different fundamental parameters often fit the data points on the CMD equally well. Moreover, for multicolor photometric data, fitting isochrones to observed data points over all CMDs is further complicated. To determine the fundamental parameters objectively and precisely, we adopted the Bayesian method. The Bayesian method determines the posterior distributions of the fundamental parameters, resulting in something akin to a best fit (Jeffery et al. 2016). Based on Bayesian statistics, a sophisticated software suite, named Bayesian Analysis for Stellar Evolution with Nine Parameters (BASE-9), was developed to objectively fit our models (von Hippel et al. 2006; DeGennaro et al. 2009; van Dyk et al 2009; Stein et al. 2013). Through its web interface1, we downloaded the BASE-9 source code and used it to derive the fundamental parameters for the open clusters studied here.
The details of Bayesian technique are described in von Hippel et al. (2006) and van Dyk et al (2009). We give a brief overview of the Bayesian technique as follows. The Bayesian technique uses the observed data and our prior knowledge of the fundamental parameters to infer their posterior distributions. According to Bayes’s theorem, the posterior distribution can be obtained as follows:
 (1)
(1)
where p(θ|x) is the posterior density on model parameters θ given data x, p(θ) is the prior density on the model parameters θ, and p(x|θ) is the likelihood function. A simple likelihood function adopted by von Hippel et al. (2006) is as follows:
![Mathematical equation: $\matrix{ {p(x|\theta ) = \mathop \prod \limits_{i = 1}^N \mathop \prod \limits_{j = 1}^n } \cr {{1 \over {\sqrt {2\pi \sigma _{ij}^2} }}\exp \left( { - {{{{\left[ {{M_{ij}}({{(m - M)}_0},E(B - V)) - {M_j}(t,Z,m)} \right]}^2}} \over {2\sigma _{ij}^2}}} \right),} \cr }$](/articles/aa/full_html/2026/05/aa55265-25/aa55265-25-eq2.png) (2)
(2)
where N is the total number of stars in the sample, n is the total number of observed bands for the ith star, Mj(t, Z, m) is the theoretical magnitude in the jth band calculated from a theoretical isochrone model with the metallicity Z, age t, and mass m. The observed magnitude Mij((m − M)0, E(B − V)) and its error σij for the ith star in the jth band refer to values corrected for the distance modulus (m − M)0 and reddening E(B − V). Based on this simple likelihood function, van Dyk et al (2009) developed a more complete and sophisticated likelihood function that considers field star contamination and binary systems (see van Dyk et al 2009, for details). BASE-9 adopts this complete and sophisticated likelihood function. The prior distributions on metallicity, distance modulus, and reddening are assumed to be Gaussian distributions. The prior distribution on the logarithmic age is assumed to be uniform between log (t/yr) = 6,0 and log (t/yr) = 9,9 and zero elsewhere. The prior distribution on the mass is assumed to be proportional to the Miller & Scalo (1979) initial mass function. Because p(x) cannot be calculated analytically, based on the likelihood function and prior distributions, BASE-9 uses the Markov chain Monte Carlo (MCMC) algorithm (see van Dyk et al 2009, for details) to generate a sample to approximate the posterior distribution.
To perform BASE-9, we input the photometric data, the theoretical isochrones, the means and standard deviations of prior distributions, and the starting values of the fundamental parameters. We used multicolor photometric data of preliminary candidate cluster members to derive the fundamental parameters of the open cluster sample. In this study, we used the Padova theoretical isochrones in the BATC system (Marigo et al. 2008). Through an interactive web interface2, we constructed a grid of isochrones for different ages, metallicities, photometric systems, and dust properties. We used the default models with scaled-solar abundance ratios (i.e., [α/Fe] = 0,0). In addition, the reddening E(B − V) was transformed to each BATC band using the extinction coefficient derived by Chen (2000), following the procedure given in Appendix B of Schlegel et al. (1998). For the prior distribution, we adopted the MWSC catalog values for the fundamental parameters as the means of Gaussian distributions. These values are listed in Table 3. Subsequently, we set the standard deviations of Gaussian distributions as follows: σ([Fe/H]) = 0,02, σ((m − M)0) = 0,3, and σ(E(B − V)) = 0,03. For the starting values, Jeffery et al. (2016) showed that BASE-9 generates consistent results regardless of starting values. Therefore, we adopted the fundamental parameter values from the MWSC catalog as our starting point.
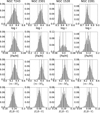 |
Fig. 2 All posterior distributions of the fundamental parameters. The histograms represent the posterior distributions. The perpendicular solid lines show the fundamental parameters derived from the posterior distributions. The perpendicular dashed lines show the 1 σ errors. |
3.3 Result
We ran BASE-9 on each open cluster. For each open cluster, we ran the chain for 50 000 steps and used the last 20 000 steps to infer the posterior distributions. Figure 2 shows the posterior distributions of the fundamental parameters. We used the means and standard deviations of the posterior distributions to estimate the values of the fundamental parameters and their uncertainties, respectively, and list these estimates in the summary of Table 5. To check the fundamental parameters obtained here, we plot isochrones (black lines) corresponding to the Bayesian-derived parameters on the observed CMDs for each cluster. As shown in Fig. 3, these isochrones reproduce the observed data well.
We compare our results with those from the previous studies listed in Table 4. For NGC 7243, the  Myr age obtained here is consistent with the 250 ± 50 Myr age obtained by Jilinski et al. (2003) and slightly greater than the 76 ± 3 Myr age obtained by Hill & Barnes (1971). Hill & Barnes (1971) argued that the 76 ± 3 Myr age is a lower limit estimation. The distance modulus and reddening of NGC 7243 derived here are consistent with those in the previous studies. For NGC 2301, the
  Myr age is in good agreement with the
  Myr age obtained by Kim et al. (2001) and slightly greater than the 160 Myr age obtained by Sharma et al. (2006). The metallicity obtained here is consistent with previously published results. However, the distance modulus is smaller than previously published results, and the reddening is greater than previously published results. To check the discrepancy between our result and those from the previous studies, we plot isochrones with the fundamental parameters obtained by Kim et al. (2001) and Sharma et al. (2006) on CMDs. As shown in Figure 3, the isochrones (red lines) for the fundamental parameters derived by Sharma et al. (2006) are redder than the main-sequence data on all the CMDs, particularly in the (a − n) versus a and ( f − i) versus f CMDs. The isochrones (blue lines) for the fundamental parameters provided by Kim et al. (2001) are bluer than the main-sequence data on all the CMDs. It is evident that our theoretical curves match the data points better than those obtained with the fundamental parameters in the previous studies. For NGC 1528, the result obtained here is consistent with the previously published results. For NGC 2281, the 650±60 Myr age obtained here is greater than the 400 Myr age obtained by Francic et al. (1989). The metallicity obtained here is richer than those obtained by Francic et al. (1989) and Zhang et al. (2015). To check the discrepancy between our result and those from previous studies, we plot isochrones (green lines) with the fundamental parameters obtained by Francic et al. (1989) on CMDs. As shown in Fig. 3, the black line reproduces the data points better than the green line does on the (a − n) versus a CMD. The distance modulus and reddening of NGC 2281 obtained here are consistent with those from previous studies.
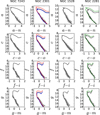 |
Fig. 3 Observed CMDs of open clusters, including (a − n) vs. a, (c − o) vs. c, ( f − i) vs. f, and (g − m) vs. g CMDs. The circles represent preliminary candidate cluster members. Error bars represent photometric errors. The solid black lines represent BATC isochrones with the fundamental parameters derived from the Bayesian method. The solid red lines represent isochrones with the fundamental parameters derived by Sharma et al. (2006). The solid blue lines represent isochrones with the fundamental parameters derived by Kim et al. (2001). The solid green lines represent isochrones with the fundamental parameters derived by Francic et al. (1989). |
Literature estimates of fundamental parameters for the four open clusters.
Summary of fundamental parameters and dynamical properties of the four open clusters.
4 Dynamical state
4.1 Tidal radius
To obtain a relatively robust and physically meaningful determination of the tidal radius for each cluster, we adopted the method described by Röser et al. (2011). This method involves comparing the observed cumulative mass profile of the cluster with the theoretical relation between tidal mass and tidal radius in the Galactic potential, with their intersection defining the tidal radius (Rt).
The central coordinates of the open cluster sample are taken from the MWSC catalog (listed in Table 5). We first constructed the observed cumulative mass profile. To obtain a relatively complete census of cluster members across a larger spatial extent, we utilized the member star catalogs from Hunt & Reffert (2023), derived from Gaia DR3 data using a clustering algorithm. To acquire the necessary multicolor photometry for SED fitting, we cross-matched this member list with our BATC source catalog. For stars that were successfully matched, we used their measured BATC magnitudes. However, due to the limited field of view of the BATC observations, a subset of member stars from the Gaia-based catalog fell outside BATC’s field of view. For these unmatched stars, we directly adopted their G, GBP, and GRP magnitudes from Gaia DR3 as input photometry for the subsequent analysis.
We derived the individual mass for each member star (with photometry from either BATC or Gaia) by performing SED fitting. The fitting procedure minimizes the χ2 statistic, defined as
 (3)
(3)
where mobs,j and σj are the observed magnitude and its uncertainty in the j-th photometric band (BATC or Gaia), respectively, and mmodel, j is the magnitude predicted by a stellar model from a theoretical isochrone of given age and metallicity (as determined in Section 3). The stellar mass corresponding to the model that yields the minimum χ2 was adopted as the mass of the star. The cumulative mass Mcum(< r) as a function of the projected distance r from the adopted cluster center was then computed by summing the masses of all member stars within that radius.
The theoretical tidal mass profile, Mtid(r), for a cluster in the Galactic potential was computed using the formulation from Röser et al. (2011), which depends on the local Oort constants (OC) A and B at the cluster’s position. To calculate A and B, we first determined the Galactic rotational velocity Θ(R) at the Galactocentric distance R of each cluster using the recent rotation curve from Zhou et al. (2023). Subsequently, the OCs were derived using the relations given by Piskunov et al. (2006) (their Eq. (8)):
 (4)
(4)
With A and B thus determined, the theoretical relation Mtid(r) was evaluated.
For each of the four clusters, we plotted the observed Mcum(< r) and the theoretical Mtid(r) on the same axes. The tidal radius Rt was then defined as the projected radius r at which these two curves intersect. The resulting plots are provided in Fig. 4, where the thick black curve represents Mcum(< r), the thinner red curve represents Mtid(r), and the intersection point (marked in red) indicates the derived Rt. These dynamically estimated tidal radii and OCs A and B are listed in Table 5. Table A.3 presents sample data for each member star in the four open clusters, including right ascension (RA) and declination (Dec), unique Gaia DR3 source identifier, BATC and Gaia photometry, and derived stellar masses. For each cluster, we assumed that all member stars share the same metallicity and age, as derived for the cluster as a whole in Table 5. The complete tables for all member stars, which contain the full set of photometric magnitudes (BATC bands a through o; Gaia G, BP, and RP) and initial masses, are available at the CDS.
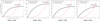 |
Fig. 4 Cumulated mass as a function of distance from the four cluster centers rc. The thick black curve represents the observed cumulated mass function as obtained from adding all the individual masses within a distance rc. The (thinner) red curve represents the relation between the tidal radius and the tidal mass in the gravitational field of the Galaxy near the position of the Sun. The red point indicates tidal radius. |
 |
Fig. 5 Mass functions of inner (R < Rt) vs. outer (R > Rt) regions for the four open clusters. The red circles represent data points for the inner (bound) region within the tidal radius, while the blue squares represent data points for the outer (tidal) region beyond the tidal radius. The error bars indicate 1σ Poisson uncertainties. The dashed red and blue lines show the best-fit power-law functions Φ(M) ∝ Mα for the inner and outer regions, respectively. The derived slopes α and their uncertainties are given in each legend. The abscissa shows stellar mass in solar units (M⊙) on a logarithmic scale with linear numerical labels; and the ordinate shows the mass function Φ(M) = dN/dM on a logarithmic scale. The number of member stars (N) in each region is indicated in the respective legend entries. |
4.2 Mass function
We now study the mass function for each cluster based on the tidal radius Rt obtained (see Sect. 4.1). Stars inside Rt are considered to be (presently) bound members, while those outside Rt are likely stars that have been stripped or are in the process of escaping. For each cluster we constructed the PDMF separately for the inner (R < Rt) and outer (R > Rt) regions. The PDMFs were derived by star counts in logarithmic mass bins and fitted with a single-segment power law Φ(m) ∝ mα over the observed mass range. To mitigate the impact of incompleteness at the faint end, we determined the 90% completeness limit for each cluster from the artificial star tests described in Sect. 2.3, defined as the magnitude at which the completeness fraction falls below 0.9. Using the best-fitting Padova isochrones and the cluster parameters listed in Table 5, we converted these magnitude limits into mass limits. For NGC 7243, NGC 2301, NGC 1528, and NGC 2281, the corresponding mass limits are approximately 0,79 M⊙, 0,74 M⊙, 0,72 M⊙, and 0,54 M⊙, respectively. In the following analysis, all mass bins significantly below these limits, which exhibit the characteristic downturn caused by incompleteness, were excluded from the fitting procedure. The resulting mass functions for the four clusters are displayed together in Fig. 5, and the results are listed in Table 5.
In a dynamically evolving cluster, two-body relaxation drives the system toward energy equipartition. As a consequence, low-mass stars gain kinetic energy and tend to migrate to larger radii or even escape, while massive stars sink toward the center. This process naturally produces a radial gradient in the mass-function slope: the inner region becomes enriched in massive stars (flatter α), whereas the outer region (and the tidal tails) becomes dominated by low-mass stars (steeper α). The strength of this gradient and the total number of stars outside the tidal radius are therefore key diagnostics of the cluster’s dynamical age.
To quantify the expected degree of dynamical evolution, we estimated the relaxation time trelax using the standard formula (Binney & Tremaine 2008):

where N is the number of member stars and tcross = Rt/σv is the crossing time. We adopted a typical velocity dispersion σv ≈ 3 km s−1 (Binney & Merrifield 1998) and the tidal radii Rt derived here. The resulting relaxation times and the dimensionless parameter τ = Age/trelax are listed in Table 5.
According to stellar-dynamics theory, clusters with τ > 3–5 experience multiple relaxation times and should exhibit clear signatures of energy-equipartition, i.e., a steepening of the mass-function slope in the outer regions. Our derived τ values place all four clusters in this regime, yet the observed mass-function gradients show diverse patterns.
For NGC 7243 the inner region yields a slope αin = −2,48 ± 0,08 (see in Table 5), while the outer region gives αout = −2,54 ± 0,55. Although the outer slope is slightly steeper, the large uncertainty on αout (owing to the very small number of stars in the tidal region, Nout ∼ 30) makes the difference statistically insignificant. The global mass function, integrated over the whole field, has a slope αglobal ≈ −2,5 and shows no obvious break, remaining consistent with a Kroupa (2001)-type IMF. With τ ≈ 4,3, the cluster experiences several relaxation times, yet the outer PDMF does not show the predicted steepening. This discrepancy likely reflects the early phase of tidal stripping: evaporated low-mass stars have not yet accumulated sufficiently in the immediate vicinity of the cluster to alter the slope measurably, or the adopted global velocity dispersion overestimates the actual crossing time.
The case of NGC 2301 is somewhat different. Here, the inner slope is αin = −2,61 ± 0,19, and the outer slope is αout = −2,16 ± 0,67. Although the inner region shows a steeper mass function, suggesting an excess of low-mass stars in the bound region, the large uncertainty in the outer slope – stemming from the extremely small number of stars in the tidal region (Nout = 7) – prevents a robust determination of the radial gradient. With τ ≈ 3,3, the cluster lies at the threshold where energy-equipartition effects should become visible, but deeper photometry would be needed to confirm the expected steepening of the outer mass function.
In NGC 1528 the inner slope is αin = −2,14 ± 0,16, and the outer slope is αout = −2,27 ± 0,34. The outer region contains only Nout = 20 stars, and although the outer slope is slightly steeper, the large uncertainties mean that the difference is not statistically significant. This likely reflects the poor statistics in the tidal region rather than a true mass-function gradient. Despite a large τ ≈ 10,7, which suggests that the cluster should have experienced significant dynamical evolution, the observed steepening in the outer region is only marginal and statistically inconclusive. This could be attributed to the fact that the tidal region has only recently begun to accumulate a detectable population of low-mass stars, and the current number remains insufficient to robustly alter the measured slope. Alternatively, the adopted velocity dispersion may overestimate the actual crossing time, leading to an overestimation of τ and the expected degree of energy equipartition.
The clearest and most robust signature of advanced dynamical evolution is seen in NGC 2281. Here, the inner region exhibits a relatively flat slope αin = −2,63 ± 0,29, while the outer region shows a much steeper slope αout = −3,76 ± 0,23. The difference is significant and is supported by a large number of stars in both regions (Nin ∼ 600 and Nout ∼ 120). With τ ≈ 13,3, NGC 2281 has experienced many relaxation times, allowing energy-equipartition to efficiently segregate massive stars inward and push low-mass stars outward. The steep outer PDMF directly reflects this accumulation of low-mass stars in the tidal region, providing the first conclusive evidence of strong mass segregation in this cluster.
In summary, the four clusters span a range of dynamical states. Despite their formally high τ values (τ ≳ 3), NGC 7243, NGC 2301, and NGC 1528 show only mild or statistically ambiguous gradients in their PDMF slopes. This indicates that the simple scaling τ = Age/trelax may overestimate the actual degree of energy-equipartition in these systems, possibly because of their specific orbital histories, anisotropic tidal fields, or because the evaporated low-mass stars have not yet populated the observed outer annulus in sufficient numbers. In contrast, NGC 2281 (τ ≈ 13,3) exhibits a clear, statistically significant steepening of the mass function in the tidal region – unambiguous evidence that energy-equipartition has substantially altered the mass-function shape and that the cluster is in an advanced state of dynamical evolution.
4.3 Spatial distribution
To visually examine the internal and external structure of the four clusters, we constructed 2D spatial distribution maps in physical units. Figure 6 shows the projected positions of all member stars for each cluster, with the cluster center at the origin (0, 0). Bound members (located within the tidal radius Rt) are shown in blue, while stars in the tidal region (r ≥ Rt) are shown in red. The dashed gray circle in each panel indicates the tidal radius determined in Section 4.1.
The projected coordinates (X, Y) in parsecs were derived from the celestial coordinates of each member star as follows. First, the angular offsets in right ascension and declination (∆α, ∆δ) relative to the cluster center were computed. These angular offsets were then converted to physical projected distances using the cluster distance d (derived from the distance modulus in Section 3.3). Specifically, the projected X and Y coordinates were calculated as
 (5)
(5)
 (6)
(6)
where δ0 is the declination of the cluster center and the subscript “rad” indicates the angular offsets expressed in radians. The conversion from angular to linear scale accounts for the cos δ0 factor to properly scale right ascension offsets.
As shown in Fig. 6, all four clusters exhibit clear mass segregation, with more massive stars (not shown in this figure but evident from the mass functions) concentrated toward the center. The spatial distributions also reveal the extent of each cluster’s tidal region, with NGC 2281 showing the most extended structure.
5 Summary
In this paper, we presented the multicolor photometric data of four open clusters observed by the BATC system. Based on these photometric data, we adopted the Bayesian method to derive the fundamental parameters of these open clusters. The photometric data were supplemented by Gaia DR3 photometry for member stars outside the BATC footprint.
We determined the tidal radius Rt for each cluster using a dynamical method based on the intersection of the observed cumulative stellar mass profile and the theoretical tidal mass curve. This method provides a physically motivated definition of the cluster boundary. Stars inside Rt are considered bound members, while those outside are likely escaping or have already been stripped. We then constructed the PDMFs separately for the inner (R < Rt) and outer (R > Rt) regions. The mass functions were fitted with a single-segment power law Φ(m) ∝ mα.
Our analysis reveals that all four clusters show indications of mass segregation, but with varying degrees of statistical robustness. For NGC 7243, NGC 2301, and NGC 1528, the outer regions contain very few stars, leading to large uncertainties in the outer mass function slopes. Although their dimensionless evolution parameters τ are large (τ ≳ 3), suggesting multiple relaxation timescales, the expected steepening of the outer mass function is not conclusively observed, likely due to the early phase of tidal stripping or specific orbital conditions.
In contrast, NGC 2281 exhibits a clear and statistically significant difference between the inner and outer mass function slopes (αin = −2,63 ± 0,29, αout = −3,76 ± 0,23), with a substantial number of stars in both regions. With τ ≈ 13,3, this cluster has undergone extensive dynamical evolution, leading to efficient energy equipartition and strong mass segregation, and indicating significant loss of low-mass stars. This work provides the first conclusive evidence of advanced dynamical mass segregation in NGC 2281.
The spatial distribution maps in physical units visually confirm the concentration of bound members within the tidal radius and the extended distributions in the tidal regions, particularly for NGC 2281. Our study demonstrates the importance of combining deep, wide-field photometry with Gaia data and dynamical tidal radius estimates to robustly assess the mass segregation state and dynamical age of open clusters.
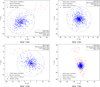 |
Fig. 6 Spatial distribution of member stars in the four open clusters. The projected positions are shown in parsecs relative to the cluster center at (0, 0). The blue points represent stars within the tidal radius (bound members), while the red points represent stars in the tidal region (r ≥ Rt). The dashed gray circle in each panel indicates the tidal radius Rt derived in Section 4.1. All clusters show central concentrations and extended distributions of members in the tidal region, particularly evident for NGC 2281. The spatial distributions were constructed using member lists from Hunt & Reffert (2023) and projected distances calculated from Gaia DR3 positions and cluster distances (E(B − V)) from Table 5. |
Data availability
Full Table A.3 is available at the CDS via https://cdsarc.cds.unistra.fr/viz-bin/cat/J/A+A/709/A20.
Acknowledgements
We are indebted to the referee for his/her thoughtful comments and insightful suggestions that improved this paper greatly. We thank Prof. Bingqiu Chen for thoughtful discussions. We acknowledge the support from the National Natural Science Foundation of China (NSFC) through grants Nos. 12203010, 12273068.
References
- Baumgardt, H. 2003, IAU Joint Discussion, Evolution of Star Clusters in Tidal Fields, 25, E38 [Google Scholar]
- Binney, J., & Merrifield, M. 1998, in Galactic Astronomy (Princeton, NJ: Princeton University Press), Princeton Series in Astrophysics, QB857.B522 [Google Scholar]
- Binney, J., & Tremaine, S. 2008, in Galactic Dynamics (Princeton, NJ: Princeton University Press) [Google Scholar]
- Bonatto, C., & Bica E. 2005, A&A, 437, 483 [NASA ADS] [CrossRef] [EDP Sciences] [Google Scholar]
- Bonnell, I. A., & Davies, M. B. 1998, MNRAS, 295, 691 [CrossRef] [Google Scholar]
- Chen, A. 2000, Ph.D. thesis, Natl. Cent. Univ. [Google Scholar]
- Chen, L., de Grijs, R., & Zhao, J. L. 2007, AJ, 134, 1368 [NASA ADS] [CrossRef] [Google Scholar]
- DeGennaro, S., von Hippel, T., Jefferys, W. H., 2009, ApJ, 696, 12 [Google Scholar]
- Fan, X., et al. 1996, AJ, 112, 628 Fan, Z., Ma, J., & Zhou, X. 2009, RAA, 9, 993 [Google Scholar]
- Francic, S. P. 1989, AJ, 98, 888 [Google Scholar]
- Frolov, V. H., & Ananjevskaja, Yu. K. 2007, AstL, 33, 649 [Google Scholar]
- Gouliermis, D., Keller, S. C., Kontizas, E., & Bellas-Velidis, I. 2004, A&A, 416, 137 [NASA ADS] [CrossRef] [EDP Sciences] [Google Scholar]
- Hao, C. J., Xu, Y., Wu, Z. Y., et al. 2022, A&A, 660, A4 [NASA ADS] [CrossRef] [EDP Sciences] [Google Scholar]
- Hill, G., & Barnes, J. V. 1971, AJ, 76, 110 [Google Scholar]
- Hu, Q., Zhang, Y., & Esamdin, A. 2021, A&A, 656, A49 [NASA ADS] [CrossRef] [EDP Sciences] [Google Scholar]
- Hunt, E. L., & Reffert, S. 2023, A&A, 673, A114 [NASA ADS] [CrossRef] [EDP Sciences] [Google Scholar]
- Jeffery, E. J., von Hippel, T., van Dyk, D. A., et al. 2016, ApJ, 828, 79 [Google Scholar]
- Jilinski, E. G., Frolov, V. N., Ananjevskaja, J. K., Straume, J., & Drake, N. A. 2003, A&A, 401, 531 [NASA ADS] [CrossRef] [EDP Sciences] [Google Scholar]
- Khalisi, E., Amaro-Seoane, P., & Spurzem, R. 2007, MNRAS, 374, 703 [NASA ADS] [CrossRef] [Google Scholar]
- Kharchenko, N. V., Piskunov, A. E., Röser, S., Schilbach, E., & Scholz, R. D. 2005, A&A, 438, 1163 [NASA ADS] [CrossRef] [EDP Sciences] [Google Scholar]
- Kharchenko, N. V., Piskunov, A. E., Schilbach, E., Röser, S., & Scholz, R.-D. 2012, A&A, 543, A156 [NASA ADS] [CrossRef] [EDP Sciences] [Google Scholar]
- Kharchenko, N. V., Piskunov, A. E., Schilbach, E., Röser, S., & Scholz, R. D. 2013, A&A, 558, A53 [NASA ADS] [CrossRef] [EDP Sciences] [Google Scholar]
- Kim, S.-L., Chun, M.-Y., Park, B.-G., et al. 2001, A&A, 371, 571 [NASA ADS] [CrossRef] [EDP Sciences] [Google Scholar]
- Kroupa, P. 2001, MNRAS, 322, 231 [NASA ADS] [CrossRef] [Google Scholar]
- Kroupa, P. 2008, Proc. Int. Astron. Union, 3 [Google Scholar]
- Ma, J., et al. 2017, MNRAS, 468, 4513 [Google Scholar]
- Marigo, P., Girardi, L., Bressan, A., et al. 2008, A&A, 482, 883 [NASA ADS] [CrossRef] [EDP Sciences] [Google Scholar]
- Miller, G. E., & Scalo, J. M. 1979, ApJS, 41, 513 [Google Scholar]
- Nilakshi Sagar, R., Pandey, A. K., & Mohan, V. 2002, A&A, 383, 153 [NASA ADS] [CrossRef] [EDP Sciences] [Google Scholar]
- Nissen, P. E. 1988, A&A, 199, 146 [NASA ADS] [Google Scholar]
- Parmentier, G., & Gilmore, G. 2007, MNRAS, 377, 352 [Google Scholar]
- Piskunov, A. E., Kharchenko, N. V., Röser, S., Schilbach, E., & Scholz, R.-D. 2006, A&A, 445, 545 [CrossRef] [EDP Sciences] [Google Scholar]
- Röser, S., Schilbach, E., Piskunov, A. E., Kharchenko, N. V., & Scholz, R.-D. 2011, A&A, 531, A92 [NASA ADS] [CrossRef] [EDP Sciences] [Google Scholar]
- Schlegel, D. J., Finkbeiner, D. P., & Davis, M. 1998, ApJ, 500, 525 [Google Scholar]
- Sharma, S., Pandey, A. K., Ogura, K., et al. 2006, AJ, 132, 1669 [NASA ADS] [CrossRef] [Google Scholar]
- Sharma, S., Pandey, A. K., Ogura, K., et al. 2008, AJ, 135, 1934 [NASA ADS] [CrossRef] [Google Scholar]
- Stein, N., van Dyk, D. A., von Hippel, T., et al. 2013, Statist. Anal. Data Mining, 6, 34 [Google Scholar]
- Stetson, P. B. 1987, PASP, 99, 191 [Google Scholar]
- Twarog, B. A., Ashman, K. M., & Anthony-Twarog, B. J. 1997, AJ, 114, 2556 [NASA ADS] [CrossRef] [Google Scholar]
- van Dyk, D. A., DeGennaro, S., Stein, N., Jefferys, W. H., & von Hippel, T. 2009, AnApS, 3, 117 [Google Scholar]
- von Hippel, T., Jefferys, W. H., Scott, J., et al. 2006, ApJ, 645, 1436 [Google Scholar]
- Wang, J.-X., Ma, J., Wu, Z.-Y., Wang, S., & Zhou, X. 2015, AJ, 150, 61 [Google Scholar]
- Wang, J.-X., Ma, J., Wu, Z.-Y., & Zhou, X. 2017, PASP, 129, 114101 [Google Scholar]
- Wu, Z.-Y., Zhou, X., Ma, J., Jiang, Z.-J., & Chen, J.-S. 2005, PASP, 117, 32 [Google Scholar]
- Wu, Z.-Y., Zhou, X., Ma, J., Jiang, Z.-J., & Chen, J.-S. 2006, PASP, 118, 1104 [Google Scholar]
- Wu, Z.-Y., Zhou, X., Ma, J., et al. 2007, AJ, 133, 2061 [Google Scholar]
- Wu, Y., Xiang, M., Chen, Y., et al. 2021, MNRAS, 501, 4, 4917 [Google Scholar]
- Yan, H., et al. 2000, PASP, 112, 691 [Google Scholar]
- Yoshizawa, M. 1978, PASJ, 30, 123 [NASA ADS] [Google Scholar]
- Zhang, B., et al. 2015, RAA, 8, 1197 [Google Scholar]
- Zhong, J., Chen, L., Jiang, Y., et al. 2022, AJ, 164, 54 [NASA ADS] [CrossRef] [Google Scholar]
- Zhou, X., Jiang, Z., Ma, J., et al. 2003, A&A, 397, 361 [NASA ADS] [CrossRef] [EDP Sciences] [Google Scholar]
- Zhou, Y., Li, X., Huang, Y., & Zhang, H. 2023, ApJ, 946, 73 [CrossRef] [Google Scholar]
Appendix A Additional tables
Statistics of observations for the four open clusters.
Completeness analysis results of the four open clusters.
Example data table for member stars of the four open clusters.
All Tables
Summary of fundamental parameters and dynamical properties of the four open clusters.
All Figures
|
Fig. 1 BATC o-band images of the target open cluster regions. The field of view is 94′ × 94′. |
| In the text | |
|
Fig. 2 All posterior distributions of the fundamental parameters. The histograms represent the posterior distributions. The perpendicular solid lines show the fundamental parameters derived from the posterior distributions. The perpendicular dashed lines show the 1 σ errors. |
| In the text | |
|
Fig. 3 Observed CMDs of open clusters, including (a − n) vs. a, (c − o) vs. c, ( f − i) vs. f, and (g − m) vs. g CMDs. The circles represent preliminary candidate cluster members. Error bars represent photometric errors. The solid black lines represent BATC isochrones with the fundamental parameters derived from the Bayesian method. The solid red lines represent isochrones with the fundamental parameters derived by Sharma et al. (2006). The solid blue lines represent isochrones with the fundamental parameters derived by Kim et al. (2001). The solid green lines represent isochrones with the fundamental parameters derived by Francic et al. (1989). |
| In the text | |
|
Fig. 4 Cumulated mass as a function of distance from the four cluster centers rc. The thick black curve represents the observed cumulated mass function as obtained from adding all the individual masses within a distance rc. The (thinner) red curve represents the relation between the tidal radius and the tidal mass in the gravitational field of the Galaxy near the position of the Sun. The red point indicates tidal radius. |
| In the text | |
|
Fig. 5 Mass functions of inner (R < Rt) vs. outer (R > Rt) regions for the four open clusters. The red circles represent data points for the inner (bound) region within the tidal radius, while the blue squares represent data points for the outer (tidal) region beyond the tidal radius. The error bars indicate 1σ Poisson uncertainties. The dashed red and blue lines show the best-fit power-law functions Φ(M) ∝ Mα for the inner and outer regions, respectively. The derived slopes α and their uncertainties are given in each legend. The abscissa shows stellar mass in solar units (M⊙) on a logarithmic scale with linear numerical labels; and the ordinate shows the mass function Φ(M) = dN/dM on a logarithmic scale. The number of member stars (N) in each region is indicated in the respective legend entries. |
| In the text | |
|
Fig. 6 Spatial distribution of member stars in the four open clusters. The projected positions are shown in parsecs relative to the cluster center at (0, 0). The blue points represent stars within the tidal radius (bound members), while the red points represent stars in the tidal region (r ≥ Rt). The dashed gray circle in each panel indicates the tidal radius Rt derived in Section 4.1. All clusters show central concentrations and extended distributions of members in the tidal region, particularly evident for NGC 2281. The spatial distributions were constructed using member lists from Hunt & Reffert (2023) and projected distances calculated from Gaia DR3 positions and cluster distances (E(B − V)) from Table 5. |
| In the text | |
Current usage metrics show cumulative count of Article Views (full-text article views including HTML views, PDF and ePub downloads, according to the available data) and Abstracts Views on Vision4Press platform.
Data correspond to usage on the plateform after 2015. The current usage metrics is available 48-96 hours after online publication and is updated daily on week days.
Initial download of the metrics may take a while.