Fig. 6
Download original image
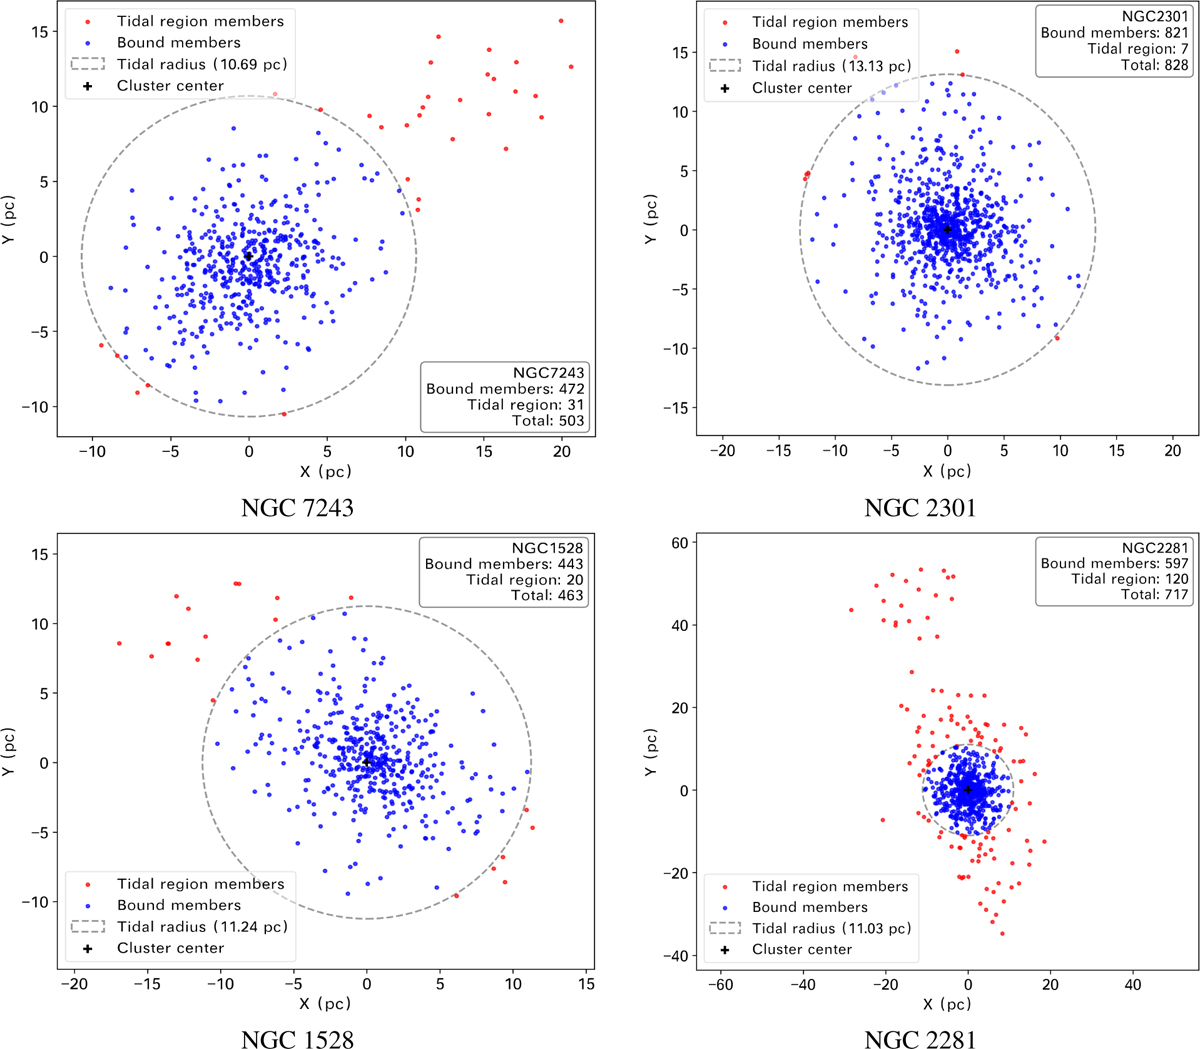
Spatial distribution of member stars in the four open clusters. The projected positions are shown in parsecs relative to the cluster center at (0, 0). The blue points represent stars within the tidal radius (bound members), while the red points represent stars in the tidal region (r ≥ Rt). The dashed gray circle in each panel indicates the tidal radius Rt derived in Section 4.1. All clusters show central concentrations and extended distributions of members in the tidal region, particularly evident for NGC 2281. The spatial distributions were constructed using member lists from Hunt & Reffert (2023) and projected distances calculated from Gaia DR3 positions and cluster distances (E(B − V)) from Table 5.
Current usage metrics show cumulative count of Article Views (full-text article views including HTML views, PDF and ePub downloads, according to the available data) and Abstracts Views on Vision4Press platform.
Data correspond to usage on the plateform after 2015. The current usage metrics is available 48-96 hours after online publication and is updated daily on week days.
Initial download of the metrics may take a while.