Fig. 5
Download original image
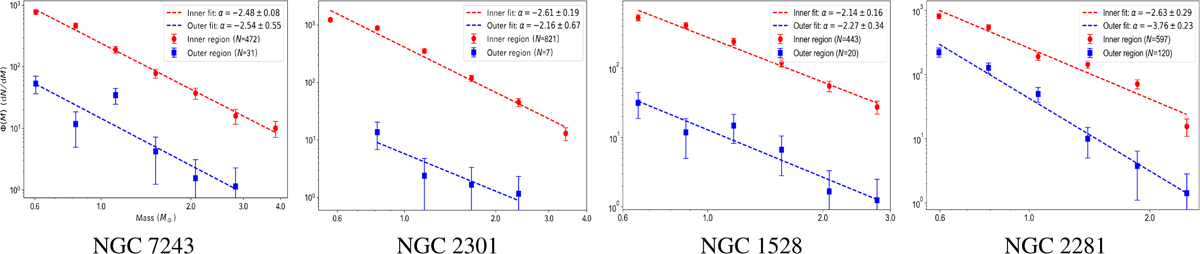
Mass functions of inner (R < Rt) vs. outer (R > Rt) regions for the four open clusters. The red circles represent data points for the inner (bound) region within the tidal radius, while the blue squares represent data points for the outer (tidal) region beyond the tidal radius. The error bars indicate 1σ Poisson uncertainties. The dashed red and blue lines show the best-fit power-law functions Φ(M) ∝ Mα for the inner and outer regions, respectively. The derived slopes α and their uncertainties are given in each legend. The abscissa shows stellar mass in solar units (M⊙) on a logarithmic scale with linear numerical labels; and the ordinate shows the mass function Φ(M) = dN/dM on a logarithmic scale. The number of member stars (N) in each region is indicated in the respective legend entries.
Current usage metrics show cumulative count of Article Views (full-text article views including HTML views, PDF and ePub downloads, according to the available data) and Abstracts Views on Vision4Press platform.
Data correspond to usage on the plateform after 2015. The current usage metrics is available 48-96 hours after online publication and is updated daily on week days.
Initial download of the metrics may take a while.