| Issue |
A&A
Volume 708, April 2026
|
|
|---|---|---|
| Article Number | A314 | |
| Number of page(s) | 8 | |
| Section | Planets, planetary systems, and small bodies | |
| DOI | https://doi.org/10.1051/0004-6361/202558759 | |
| Published online | 21 April 2026 | |
A possible impact lull in the middle of the Eratosthenian period suggested by the Chang’e-5 and 6 missions
School of Physics and Electronic Information Engineering, Guilin University of Technology,
Guilin,
China
★ Corresponding author: This email address is being protected from spambots. You need JavaScript enabled to view it.
Received:
23
December
2025
Accepted:
16
February
2026
Abstract
Context. It was generally believed that lunar impact flux over the past 3.5 billion years has been almost constant. However, there are still considerable age gaps, causing the evolution of impact flux to remain elusive. Recently, the Chang’e-5 and 6 missions collected samples from the Moon, and the respective ages of the mare basalt units containing the landing sites were dated to be 2.0 and 2.8 billion years ago (Ga).
Aims. With this work, we aim to investigate the constancy of the lunar impact flux.
Methods. We measured the densities of craters in both Chang’e-5 and 6 landing mare basalt units.
Results. We find that the density of craters with diameters ranging from about 200 m to 1 km in the Chang’e-6 unit is almost identical to that of the Chang’e-5 unit. The density similarity suggests an impact lull (relatively few impacts on average) between 2.0 and 2.8 Ga. Consequently, the population of near-Earth objects (NEOs) is not in a quasi-steady state, with this being supported by a spike found at about 2.8-3.4 Ga. The results suggest that large, rare asteroid family-forming events in the main asteroid belt, rather than background main belt asteroids, are the main (>90 ± 2%; 1σ uncertainty) source of subhectometer NEOs. Alternatively, to be compatible with a constant flux, the strength of the Chang’e-5 mare basalt has to be about 30% lower than that of Chang’e-6.
Key words: minor planets, asteroids: general / Moon
© The Authors 2026
 Open Access article, published by EDP Sciences, under the terms of the Creative Commons Attribution License (https://creativecommons.org/licenses/by/4.0), which permits unrestricted use, distribution, and reproduction in any medium, provided the original work is properly cited.
This article is published in open access under the Subscribe to Open model. This email address is being protected from spambots. You need JavaScript enabled to view it. to support open access publication.
1 Introduction
Impact craters on the Moon are a proxy of impact flux in the Earth-Moon system. Aided by isotopic ages of samples returned from the Moon, previous works have generally led to the belief that the impact rate on the Moon experienced an early rapid decline before about 3.5-3.8 Ga and has since remained almost unchanged (Neukum et al. 2001; Marchi et al. 2009; Robbins et al. 2014; Fassett et al. 2016; Xie & Xiao 2023; Hiesinger et al. 2023; Cui et al. 2024; Lagain et al. 2024), although moderate variations in the impact flux by a factor of about three have been proposed. For instance, the ages of large (>10 km in diameter) lunar craters estimated from rock abundance suggest that the impact rate may have increased by a factor of up to 2.6 over the past 1 Gyr (Mazrouei et al. 2019). Isotopic ages of impact glass spherules in lunar regolith suggest an increase in the frequency of cratering in the past 0.5 Gyr (Culler et al. 2000) or a decline by a factor of three over the past 3 Gyr (Hartmann et al. 2007), but modelling the formation, transportation, and preservation of impact glass spherule age argue against a change in impact flux (Huang et al. 2018). The peaks and valleys in the age distribution of impact glasses in the Chang’e-5 regolith were used to argue for a large variation in the lunar impact rate (Long et al. 2022), but the peaks and valleys do not directly reflect the variation in impact flux and are the likely result of non-random sampling of impact glasses from large crater formation events near the Chang’e-5 landing site. Nevertheless, previous works have generally supported the idea that there have been no significant changes in lunar impact flux since 3.5 Ga. The moderate variations of lunar impact flux since 3.5 Ga support that the near-Earth object (NEO) population is in a quasi-steady state and is stably resupplied from the main belt asteroids that are in collisional equilibrium, with a minor contribution from comets (Bottke et al. 2007, 2015; Morbidelli et al. 2018; Nesvorný et al. 2021). The age gaps of lunar samples (e.g. no samples with ages between 2 and 3.15 Ga) limit our understanding of the nature of the cratering history of the Moon, and hence it is unclear how significant asteroid family-forming events affect lunar impact flux solely from the previously available sparse calibration data for lunar chronology.
The Chang’e-6 mission returned new samples with dated ages of 2.8 Ga from a young mare of the Moon’s farside (Fig. 1; 2.830 ± 0.005 Ga, Cui et al. 2024; 2.807 ± 0.003 Ga, Zhang et al. 2025). Thus, in combination with the Chang’e-5 sample age of 2.0 Ga (1.963 ± 0.057 Ga, Che et al. 2021; 2.030 ± 0.004 Ga, Li et al. 2021) we can address the aforementioned questions about impact flux by determining the cratering rate between 2.0 and 2.8 Ga (we neglect the small age uncertainties for simplicity).
In this work, we show that the impact flux of the Moon during the past 3.8 Gyr can vary significantly, which is the result of the random nature of large, rare asteroid family-forming events. The lull and spike found here provide valuable implications on the period beyond 2.0-2.8 Ga; for example, there could be similar lulls and spikes (they do not necessarily remain constant). The terrestrial planets should have experienced similar impact histories, although differences exist, such as the different impact rates due to differences in gravity and impact flux, among others.
2 Method
We used CraterTools (Kneissl et al. 2011) to map craters within the units containing the Chang’e-5 and 6 landing sites (Fig. 1) and Kaguya Terrain Camera images with a resolution of 8 m (Haruyama et al. 2008). The crater mapping boundary of Chang’e-5 was taken from Qiao et al. (2021) with an exclusion of Rima Sharp (the light green polygon in Fig. 1; Xie & Xiao 2023). As shown in Fig. 1c (see also Fig. 1d), a nested small area (the blue polygon) was adopted to count small craters (the red circles) and to avoid counting a large number of the small craters. The boundaries of the Chang’e-5 unit given by various works are similar (Hiesinger et al. 2011; Qian et al. 2018; Wu et al. 2018; Qiao et al. 2021), and thus adopting another unit boundary has a negligible effect on our measured crater density of the Chang’e-5 unit.
For the Chang’e-6 landing site, the boundary of a uniform unit varies significantly among previous works (Zeng et al. 2023; Qian et al. 2024; Xu et al. 2024; Luo et al. 2024; Zhang et al. 2024; Luo et al. 2025), but they reach a consensus that a relatively small region close to the Chang’e-6 landing site comprises a uniform unit (Fig. 2). Accurately dating lunar surfaces requires measurements of craters in a homogeneous unit, and titanium and iron contents have often been used in the identification of a homogeneous unit with a uniform formation age. However, topography could affect lava flows, with high topography blocking flows (Zhang et al. 2024). For the Chang’e-6 unit, a wrinkle ridge (with an elevation of about 100 m ) located near the west boundary of Chang’e-6 unit defined by Zhang et al. (2024) likely blocks flow from the west (Fig. 2). This is also supported by the heterogeneity in crater density around the wrinkle ridge, with the west boundary having significantly more (about 70%) craters (Zhang et al. 2024). The enhancement also occurs in Zeng et al. (2023), and other works have attributed the enhancement to secondary craters (Luo et al. 2024; Xu et al. 2024; Yue et al. 2024). In either case (a different unit or heavy contamination by secondary craters), one should not include the western region. To avoid these problems resulting from counting craters in a larger region, we adopted a small region that is unanimously recognised as a homogeneous unit (Fig. 2).
When conducting the crater mapping, secondary craters (typically occurring in chains and clusters) were avoided. To exclude significant contamination of secondary craters, we adopted a quantitative procedure to estimate the degree of contamination by secondary craters in our dataset (Michael et al. 2012). The approach is based on the mean second-closest neighbour distance, and it identifies clustering at different scales. Analysis of the spatial clustering of the large craters at Chang’e-5 unit indicates that contamination by secondary craters is insignificant (Xie & Xiao 2023). We conducted a spatial clustering analysis of the small craters counted in the small nested region at Chang’e-5 and of the measured craters in the Chang’e-6 unit, and it showed an insignificant contribution of secondary craters as well (Fig. 3).
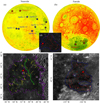 |
Fig. 1 Crater density measurements. (a) Nearside and (b) farside of the Moon. Lunar Orbiter Laser Altimeter elevation data (Smith et al. 2010) were used, and the landing sites of the lunar exploration missions with returned samples (except for the Chang’e-3 and 4 missions) are shown. (c) Mapped craters (green circles) at the mare unit (purple polygon) containing the Chang’e-5 landing site (the star). Obvious secondary crater fields (light yellows) are excluded (Xie & Xiao 2023). (d) Zoomed-in view of the small nested crater mapping area. (e) Mapped craters (red circles) at the mare unit (green polygon) containing the Chang’e-6 landing site (the star) with the exclusion of secondary crater fields. The blue polygon shows the measurement boundary. The base maps of both panels c and e are Kaguya Terrain Camera morning. |
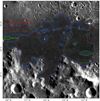 |
Fig. 2 Boundaries of the Chang’e-6 unit with the exclusion of secondary crater fields. Our mapping boundary (blue) generally matches the largest consensus region among previous definitions of the boundary of the Chang’e-6 unit. The boundary of Xu et al. (2024) was taken from Zeng et al. (2023, a candidate landing region of the Chang’e-6 mission, named F; the flame red), which is a subregion of the boundary of Pasckert et al. (2018, not shown for clarity), and the boundary of Yue et al. (2024) is a little larger. The largest unit boundary (Haruyama et al. 2009; Pasckert et al. 2018; Yue et al. 2024) is not shown for clarity. |
3 Results
For a better comparison with the size-frequency distribution (SFD) of the Chang’e-6 unit, we adopted the approach of Kirchoff & Marchi (2023) to construct the SFD of the Chang’e-5 unit by removing the data of large craters that are incomplete (diameter less than 0.6 km), and for the diameter ranges overlapped between the small and large craters, we adopted the SFD of large craters due to their better statistics, as shown in Fig. 4. The SFD of craters at Chang’e-5 is generally about 1.3 times as large as that in the older Chang’e-6 unit (Fig. 4b), although their densities are consistent within about 2σ uncertainties. To further verify our result, we extracted crater SFDs from an AI-based global database of impact craters with diameters greater than or equal to 0.4 km (La Grassa et al. 2025), and we found similar results with the Chang’e-6 unit having a lower density (Fig. 5). This AI-based data precludes the potential effect of subjectivity in crater diameter measurements for our results. Moreover, the crater density of Yue et al. (2024) in the Chang’e-6 landing area is also less than that of Jia et al. (2020) in the Chang’e-5 landing area, which was used by Yue et al. (2024) to update a lunar crater chronology (Fig. 6). Therefore, all of these observations suggest that the Chang’e-6 unit does not host more craters than the Chang’e-5 unit, although the former is older by a factor of 1.4. We avoided direct comparisons among crater datasets from different researchers because for a given crater population, observed crater densities can vary by up to 45% among different mappers. However, even non-experts can derive more consistent results. When multiple measurements of the same crater population are made, they tend to agree with each other, and this agreement generally falls within the inherent uncertainty of crater density measurements (Robbins et al. 2014).
Lunar impact flux was often implicitly assumed to be spatially independent in traditional crater chronologies, but theoretical calculations of collisional probability based on NEOs suggest the dependence of the cratering rate on the location of the lunar surface due to the latitude-dependent impact probability and longitude-dependent impact angle and velocity (Zahnle et al. 2001; Le Feuvre & Wieczorek 2011; Lagain et al. 2024). The cratering rate ratio of the Chang’e-5 to the Chang’e-6 landing sites is 1.067 (Lagain et al. 2024). After adopting this factor to our crater density of the Chang’e-5 unit, the densities of Chang’e-5 and 6 reach a better match (they are consistent within 1σ uncertainty), but the Chang’e-6 density is still generally a little less than the Chang’e-5 density. The minimum crater density difference among the three datasets (Fig. 4, Fig. 5, and Fig. 6) occurs in the datasets given in Fig. 6 (the density of the Chang’e-6 unit can reach 96.55% that of the Chang’e-5), and hence the maximum Chang’e-6 crater density is 1.067 × 96.55% - 100% = 3.0% larger than that of Chang’e-5 with consideration of the spatially dependent cratering rate. As a result, we estimate the upper limit of the average cratering rate to be between 2.0 and 2.8 Ga as 6.5 × 10⁻⁵ km−2Gyr−1 (Fig. 5).
The existence of rocks could reduce crater production density (Williams et al. 2022), and crater densities decrease with increasing slope angles (Xiao et al. 2013). However, the Chang’e-5 and 6 units are smooth and have a minor abundance of rocks (Wu et al. 2018; Powell et al. 2023; Zeng et al. 2023). Moreover, rocks mainly affect SFDs of craters smaller than about 20 m in diameter (Williams et al. 2022), and the craters counted here are much larger. For crater preservation, craters larger than 400 m are not in equilibrium, as their SFDs (with a slope of about −3.8) neither showed an equilibrium SFD slope of about −2 nor reached the equilibrium distribution (Melosh 1989; Minton et al. 2019). As a result, craters of those sizes are unlikely to undergo erasure. Regardless, old craters have undergone more severe degradation than younger craters (Fassett & Thomson 2014), and crater degradation tends to enhance the apparent crater density with time due to the enlargement of the crater diameter (Xie et al. 2017). Thus after considering the effect of crater degradation, the increase in the apparent density of craters at the Chang’e-6 landing site is expected to be proportionally larger than that at the Chang’e-5 landing site. Therefore, the consideration of crater preservation cannot explain the lower density at the older site either.
The dominant uncertainty regarding observed crater densities centres on whether the Chang’e-5 and Chang’e-6 landing regions possess similar target properties. The two units containing the Chang’e-5 and 6 landing sites are mare basalts (Jia et al. 2021; Qian et al. 2021, 2024). For the Chang’e-6 mare unit, the unit area is about 1023 km2, the basalt thickness is about 6075 m (Qian et al. 2024), and the volume of the basalts at the Chang’e-6 landing region is about 6.1 × 10⁴−7.7 × 10⁴ km3. The volume of the basalts at the Chang’e-5 landing region is at about 1.9 × 10⁶ km3 (Qian et al. 2021). Therefore, the Chang’e-5 and 6 basalt volumes indicate a high flux Hawaiian-type eruption, and thus the resulting basalts are deficient in gas bubbles (Head & Wilson 2020). As a result, the potential difference in target physical properties should be insignificant, and hence their similarity in crater density probably reflects an actual impact lull instead of being the result of different target properties. It is worth mentioning that terrestrial basalts show great variability (even by a factor of ten for the same location), so the variability in the lunar terrains cannot be ruled out, as terrain properties have been reported to significantly (10-20%) affect crater density (Kirchoff & Marchi 2023). For comparison and to be compatible with a constant impact flux, the strength of the Chang’e-5 mare basalt has to be about 30% lower than that of Chang’e-6.
Zhang et al. (2024) and Michael et al. (2025) observed a similar low crater density at Chang’e-6, but Michael et al. (2025) interpreted it as likely being caused by local resetting (in the upper 10 m of thickness or so) of the population of craters with diameters larger than 170 m more recently than the actual sample. However, this hypothesis is unlikely. In the lunar maria, the most likely reason for the resetting is basaltic eruption. In this case, most (if not all) of the Chang’e-6 basaltic samples originate from basaltic eruption, as the surficial basaltic material at the Chang’e-6 landing site mostly consists of ejecta of nearby small (diameter ≤61 m) craters (Xu et al. 2024), which cannot penetrate through the assumed upper layer with a thickness of about 10 m. Therefore, the actual sample has to be tied to the observed crater population. It is worth noting that a 30% variation in terrain strength is entirely viable to provide an alternative explanation for the observed similarity in crater density between the two regions. Alternatively, the resetting could be caused by the emplacement of distal ejecta. In this case, the ejecta of the Chaffee S crater is the most possible reason, as its thickness (0.16 m) is the largest (Xu et al. 2024), but the ejecta is too thin to erase those diameters>170 m craters. Therefore, the Chang’e-6 samples provide the retention age of our observed crater population.
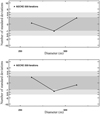 |
Fig. 3 Randomness analysis (Michael et al. 2012) of the craters at Chang’e-5 (craters measured in the nested small region; top) and Chang’e-6 (bottom) landing sites. The Y axis represents the number of standard deviations above or below the mean derived from Monte Carlo simulations. A positive number of standard deviations implies that the tested crater population is more ordered than random, while a negative value suggests that they are more clustered than random. The results of the randomness analysis (within about 1σ uncertainty) suggest minor (if any) contamination of secondary craters, which would cause the data to be more clustered. |
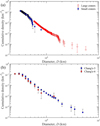 |
Fig. 4 Crater size-frequency distributions. (a) Observed crater sizefrequency distributions by using a nested crater counting technique. Small craters were measured in a small region at the Chang’e-5 landing site (the blue polygon in Fig. 1c), and large craters were counted on the Chang’e-5 unit (the purple polygon in Fig. 1c). (b) SFD comparison. The SFD of Chang’e-5 was constructed from the SFDs of large craters mapped on a large area (the purple polygon in Fig. 1c), and smaller craters (blue) were mapped in a smaller region (the blue polygon in Fig. 1c) around the Chang’e-5 landing site. Error bars (1σ uncertainty) are given according to Poisson statistics. Both SFDs are considered completed for craters with diameters larger than 400 m. |
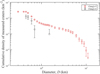 |
Fig. 5 Crater size-frequency distributions extracted from the crater database of La Grassa et al. (2025). Error bars (1σ uncertainty) are given according to Poisson statistics. Although the AI-based approach of identifying craters is spatially dependent, at the low latitudes the Chang’e-5 and 6 units are located, the false positives are minor (<3%), the recall rate is about 85%, and true positives reach at least 97% (La Grassa et al. 2025). As a result, the AI-based approach for crater identification yields consistent and reliable results for both units, recognising at least a similar fraction of the actual crater population. |
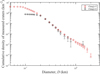 |
Fig. 6 Crater size-frequency distributions. The crater SFDs at Chang’e-5 and 6 are from Jia et al. (2020) and Yue et al. (2024), respectively. Error bars (1σ uncertainty) are given according to Poisson statistics. The density of the Chang’e-6 unit is less than that of the Chang’e-5 unit by a factor of at least 1.0345 (the smallest difference occurs at a diameter of 0.25 km), except for the small number statistics at 1.4 km in diameter. |
4 Discussion
4.1 Non-constant impact flux
Our observed densities of the craters larger than 400 m in diameter are 0.068 and 0.044 km−2 at the Chang’e-5 and 6 landing mare units, respectively. If impact flux was constant, we would expect the crater density of the craters with a diameter greater than 400 m at the Chang’e-6 landing mare to be 0.095 km−2 (two times larger than observed), as the Chang’e-6 mare basalt is 40% older. As the area of the crater mapping region at Chang’e-6 is 1023 km2, its expected number of craters is 97. The probability of observing a value of 45 or less from the expected value of 116 is extremely small (1.4 × 10⁻⁹). Even when considering the spatially dependent lunar impact flux (the corrected number of craters with a diameter greater than 400 m at Chang’e-6 mare unit is 48), the probability is extremely small (1.2 × 10⁻⁸) as well. We conclude that the average impact flux between 2.0 and 2.8 Ga is lower than expected. This could represent a single impact lull or multiple impact lulls.
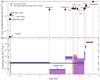 |
Fig. 7 Crater production rate. (a) Relationship between cumulative crater production densities and surface ages (taken from Xie & Xiao 2023). The blue and red represent the densities with and without the correction of spatial-dependent impact flux (Lagain et al. 2024). The age of Apollo 16 is taken as 3.85 Ga, instead of 3.92 Ga used by Xie & Xiao (2023), which is the age of Apollo Descartes formation (Stöffler & Ryder 2001). A12 represents Apollo 12, and the other labels are composed similarly. L16 and L24 represent Luna 16 and Luna 24, respectively. (b) Cratering rate of diameter ≥ 1 km craters. Except for the black line, each horizontal line represents the mean cratering rate between two neighbouring ages. The cratering rates were calculated according to the cumulative crater production densities shown in panel (a), and their uncertainties were derived according to the error propagation (Ku 1966). The blue and red colours represent the cratering rates with and without the correction of spatial-dependent impact flux. There is no solid horizontal line at 3.19 Ga due to a negative cratering rate caused by a statistical fluctuation, as is consistent with adjacent cratering rates with 3σ uncertainties (note that the lull between 2 and 2.8 Ga cannot be explained by statistical fluctuation). All uncertainties are given with a 3σ confidence interval. |
4.1.1 A single impact lull
For ages ≤3.75 Ga, the best fits of the cratering rates with and without the correction of spatial-dependent impact flux are almost identical (considered as the typical value; black line in Fig. 7). The impact rate during the lull is significantly less than the typical value (6.5 ± 1.3 × 10⁻⁴ km−2Gyr−1 1σ uncertainty) by a factor of ten (Fig. 7). As the lull provides constraints on the upper limit of the background flux of main belt asteroids, the background flux supplying to the NEO population contributes no more than about 10 ± 2% (1σ uncertainty).
Combined with the sample ages of the Apollo and Luna missions, we also found a spike of impact flux between 2.8 and about 3.4 Ga on the Moon (Fig. 7). For this time interval, the enhancement between 2.8 and 3.15 Ga (the age of Apollo 12 samples; Stöffler & Ryder 2001) is considered to be well constrained due to its relatively small uncertainty, although the others are less conclusive. Compared with the 0.8-Gyr lull, the spike found here indicates an increase in impact flux by a factor of about 88 ± 18 (1σ uncertainty). The magnitude of this increase is comparable to the increase of fossil L chondrites in mid-Ordovician limestones (Schmitz 2013; Heck et al. 2017; Terfelt 2021; Marsset et al. 2024), implying a similar origin.
The population of NEOs is believed to be in a quasi-steady state and resupplied from a constant background flux from the steady-state main belt asteroids (Bottke et al. 2007, 2015; Morbidelli et al. 2018; Nesvornÿ et al. 2021), resulting in an almost constant impact flux of the Moon. The NEO population is close to a steady state if the temporal variations of influx caused by asteroid showers are minor (they must either be of very short duration or of modest enhancement over the background in geological timescale; Novakovic et al. 2022; Bottke et al. 2007, 2015). However, the long-lasting ( 0.8 Gyr, on average) lull is not very short, and temporal variations of influx by a factor of up to 88 are not minor either. As a result, the 0.8-Gyr lull and the large variation in impact flux found here are inconsistent with the classic view of the steady-state NEO population, suggesting a more dynamic and complex origin for these objects (a more episodic nature of resupplying NEOs to the Earth-Moon system).
The formation of large, rare asteroid families (e.g. via catastrophic disruption of asteroids with a diameter greater than about 100 km) is the main source of subhectometer NEOs, and it overwhelms the contribution from background main belt asteroids. The formation of an asteroid family from an asteroid breakup can result in a transient episode of intense bombardment of the terrestrial planets, and the duration of an asteroid shower depends on the resonance involved and on the number of injected fragments (Novakovic et al. 2022). The 0.8-Gyr lull has to be the result of rare events. In other words, if large asteroids (e.g. diameters greater than about 100 km) with a total number of about 100 are not disrupted over some interval, a relative lull in impact flux would occur. Although all asteroid families contribute to producing NEOs and creating craters on the Moon (Novakovic et al. 2022), the more abundant small asteroid families (most of them likely become non-family asteroids or already no longer exist) contribute minor (less than 10%) material to the NEO population as required by the 0.8-Gyr lull; otherwise, an almost constant lunar impact flux is expected. For a very short duration, small asteroid families can briefly dominate the amount of fragments delivered to the NEO population (Broz et al. 2024; Marsset et al. 2024), but over the long term, the 0.8-Gyr lull requires a relatively short duration of dominant influx from any asteroid family-forming events. The enhancement of impact flux found here (the spike) likely represents one of the most important influences of asteroid family-forming events on the impact flux of inner Solar System bodies. Considering the similar enhancement between mid-Ordovician (Schmitz 2013; Heck et al. 2017; Terfelt 2021; Marsset et al. 2024) and 2.8-3.4 Ga (corresponding to the spike found here), we suggest that the maximum duration of an asteroid shower-dominated impact flux is at least about 0.6 Gyr or slightly longer. The Flora family (parent body with a diameter of about 150 km) is located in the innermost part of the main belt near the ν6 secular resonance (primary resonance for the origin of sub-kilometer NEOs). Collisional and dynamical models show that the duration of the contribution of the Flora family to the NEO population larger than 10% of its maximum contribution is about 0.7 Gyr (Vokrouhlický et al. 2017), and this is consistent with our estimate.
4.1.2 Multiple impact lulls
An alternative scenario would be that between 2.0 and 2.8 Ga, there is not just a single impact lull but multiple impact lulls. The resulting lulls would need to have a lower impact flux than the average between 2.0 and 2.8 Ga. In this case, the aforementioned background flux would be overestimated. The formation of large, rare asteroid families is also the main (>90%) source of subhectometer NEOs, but the occurrence frequency of those asteroid family-forming events is higher than the single-impact lull scenario, and the duration of lulls is shorter.
4.2 Lunar crater chronology
The non-constant flux has an important effect on dating the lunar surface as well as other inner Solar System bodies (such as Mars, Venus, and Mercury), as lunar crater chronology is the basis of their chronologies (Hartmann & Neukum 2001 ; Neukum et al. 2001). The effect of short-term (e.g. a few million years) variations in the impact rate could be relatively small (Williams et al. 2017). However, the 0.8 Gyr lull (or the 0.6 Gyr spike) would cause an estimated age differing from its actual value by a factor of up to at least 40%. Moreover, age determinations on younger planetary surfaces would exhibit more heightened sensitivity to discrete events (lulls and spikes), as the accumulation of impact craters is integrated over a comparatively briefer temporal interval.
5 Conclusions
In this work, we have investigated the densities of craters in both Chang’e-5 and 6 landing mare basalt units, and we found that the density of the craters in the Chang’e-6 unit is almost identical to that of the Chang’e-5 unit. The density similarity suggests impact lull(s) between 2.0 and 2.8 Ga. This suggests that the NEO population may vary significantly with time, supported by a spike found here at about 2.8-3.4 Ga, and large, rare asteroid family-forming events in the main belt asteroids are potentially the main source of subhectometer NEOs. Alternatively, the constancy in the impactor population over time requires the strength of Chang’e-5 mare basalt to be approximately 30% lower than that of Chang’e-6.
Data availability
Kaguya Terrain Camera morning images can be downloaded from https://darts.isas.jaxa.jp/app/pdap/selene/index.html.en. LROC global mosaic was downloaded from https://astrogeology.usgs.gov/search/map/moon_lro_lroc_wac_global_morphology_mosaic_100m. The mapped craters in the Chang’e-5 and 6 landing areas can be found at https://doi.org/10.5281/zenodo.18495177.
Acknowledgements
We thank China’s Chang’e missions for returning the valuable samples and also thank a anonymous referee for the constructive report that helped us significantly improve the paper. M.X. thanks Zhiyong Xiao for the helpful discussion. This work is supported by the National Natural Science Foundation of China (grant no. 12173011).
References
- Bottke, W. F., Broz, M., O’Brien, D. P., et al. 2015, Asteroids IV, 701 [Google Scholar]
- Bottke, W. F., Vokrouhlický, D., & Nesvorný, D. 2007, Nature, 449, 48 [Google Scholar]
- Broz, M., Vernazza, P., Marsset, M., et al. 2024, Nature, 634, 566 [Google Scholar]
- Che, X., Nemchin, A., Liu, D., et al. 2021, Science, 374, 887 [NASA ADS] [CrossRef] [Google Scholar]
- Cui, Z., Yang, Q., Zhang, Y.-Q., et al. 2024, Science, 386, 1395 [Google Scholar]
- Culler, T. S., Becker, T. A., Muller, R. A., & Renne, P. R. 2000, Science, 287, 1785 [Google Scholar]
- Fassett, C. I., & Thomson, B. J. 2014, J. Geophys. Res., 119, 2255 [Google Scholar]
- Fassett, C. I. 2016, J. Geophys. Res. 121, 1900 [Google Scholar]
- Hartmann, W. K., & Neukum, G. 2001, Space Sci. Rev., 96, 165 [Google Scholar]
- Hartmann, W. K., Quantin, C., & Mangold, N. 2007, Icarus, 186, 11 [Google Scholar]
- Haruyama, J., Ohtake, M., Matsunaga, T., et al. 2009, Science, 323, 905 [Google Scholar]
- Haruyama, J., Ohtake, M., Matsunaga, T., et al. 2008, Adv. Space Res., 42, 310 [Google Scholar]
- Head, J. W., & Wilson, L. 2020, Geophys. Res. Lett., 47, e2020GL088334 [Google Scholar]
- Heck, P. R., Schmitz, B., Bottke, W. F., et al. 2017, Nat. Astron., 1, 0035 [Google Scholar]
- Hiesinger, H., Head, J., Wolf, U., Jaumann, R., & Neukum, G., 2011, Rec. Adv. Curr. Res. Issues Lunar Stratigr., 477, 1 [Google Scholar]
- Hiesinger, H., van der Bogert, C. H., Michael, G., et al. 2023, Rev. Mineral. Geochem., 89, 401 [Google Scholar]
- Huang, Y.-H., Minton, D. A., Zellner, N. E. B., et al. 2018, Geophys. Res. Lett., 45, 6805 [Google Scholar]
- Jia, M., Yue, Z., Di, K., et al. 2020, Earth. Planet. Sci. Lett., 541, 116272 [Google Scholar]
- Jia, B., Fa, W., Xie, M., et al., 2021, J. Geophys. Res., 126, e2021JE006934 [Google Scholar]
- Kirchoff, M. R., & Marchi, S., 2023, Icarus, 391, 115336 [Google Scholar]
- Kneissl, T., van Gasselt, S., & Neukum, G. 2011, Planet. Space Sci., 59, 1243 [NASA ADS] [CrossRef] [Google Scholar]
- Ku, H. H. 1966, J. Res. Natl. Bureau Standards 70 [Google Scholar]
- La Grassa, R., Martellato, E., Cremonese, G., et al. 2025, ISPRS J. Photogramm., 220, 75 [Google Scholar]
- Lagain, A., Devillepoix, H. A. R., Vernazza, P., et al. 2024, Icarus, 411, 115956 [Google Scholar]
- Le Feuvre, M., & Wieczorek, M. A. 2011, Icarus, 214, 1 [Google Scholar]
- Li, Q.-L., Zhou, Q., Liu, Y., et al. 2021, Nature, 600, 54 [CrossRef] [Google Scholar]
- Long, T., Qian, Y., Norman, M. D., et al. 2022, Sci. Adv., 8, eabq2542 [Google Scholar]
- Luo, F., Xiao, Z., Wang, Y., et al. 2024, APJ, 974, L37 [Google Scholar]
- Luo, F., Xiao, Z., Wang, Y., & Xu, Y.-G., 2025, Innovation, 7, 100845 [Google Scholar]
- Marchi, S., Mottola, S., Cremonese, G., Massironi, M., & Martellato, E. 2009, AJ, 137, 4936 [Google Scholar]
- Marsset, M., Vernazza, P., Brož, M., et al. 2024, Nature, 634, 561 [Google Scholar]
- Mazrouei, S., Ghent, R. R., Bottke, W. F., Parker, A. H., & Gernon, T. M. 2019, Science, 363, 253 [Google Scholar]
- Melosh, H. J. 1989, Impact Cratering: A Geologic Process (New York: Oxford University Press) [Google Scholar]
- Michael, G., Zhang, L., Wu, C., & Liu, J. 2025, Icarus, 438, 116644 [Google Scholar]
- Michael, G. G., Platz, T., Kneissl, T., & Schmedemann, N. 2012, Icarus, 218, 169 [Google Scholar]
- Minton, D. A., Fassett, C. I., Hirabayashi, M., Howl, B. A., & Richardson, J. E. 2019, Icarus, 326, 63 [Google Scholar]
- Morbidelli, A., Nesvorny, D., Laurenz, V., et al. 2018, Icarus, 305, 262 [NASA ADS] [CrossRef] [Google Scholar]
- Nesvorný, D., Bottke, W. F., & Marchi, S. 2021, Icarus, 368, 114621 [Google Scholar]
- Neukum, G., Ivanov, B. A., & Hartmann, W. K. 2001, Space Sci. Rev., 96, 55 [Google Scholar]
- Novakovic, B., Vokrouhlickÿ, D., Spoto, F., & Nesvornÿ, D. 2022, Celest. Mech. Dyn. Astron., 134, 34 [NASA ADS] [CrossRef] [Google Scholar]
- Pasckert, J. H., Hiesinger, H., & van der Bogert, C. H. 2018, Icarus, 299, 538 [NASA ADS] [CrossRef] [Google Scholar]
- Powell, T. M., Horvath, T., Robles, V. L. et al., 2023, J. Geophys. Res., 128, e2022JE007532 [Google Scholar]
- Qian, Y., Head, J., Michalski, J., et al. 2024, Earth. Planet. Sci. Lett., 637, 118737 [Google Scholar]
- Qian, Y. Q., Xiao, L., Zhao, S. Y., et al. 2018, J. Geophys. Res., 123, 1407 [Google Scholar]
- Qian, Y., Xiao, L., Head, J. W., et al. 2021, Earth. Planet. Sci. Lett., 555, 116702 [Google Scholar]
- Qiao, L., Xu , L., Yang , Y., et al. 2021, Geophys. Res. Lett., 48, e2021GL095132 [Google Scholar]
- Robbins, S. J. 2014, Earth. Planet. Sci. Lett., 403, 188 [Google Scholar]
- Robbins, S. J., Antonenko, I., Kirchoff, M. R., et al. 2014, Icarus, 234, 109 [Google Scholar]
- Schmitz, B. 2013, Geochemistry, 73, 117 [Google Scholar]
- Smith, D. E., Zuber, M. T., Neumann, G. A., et al. 2010, Geophys. Res. Lett., 37 [Google Scholar]
- Stöffler, D., & Ryder, G. 2001, Space Sci. Rev., 96, 9 [Google Scholar]
- Terfelt, F., & Schmitz, B. 2021, PNAS, 118, e2020977118 [Google Scholar]
- Vokrouhlický, D., Bottke, W. F., & Nesvorný, D. 2017, AJ, 153, 172 [Google Scholar]
- Williams, J.-P., van der Bogert, C. H., Pathare, A. V., et al. 2017, Meteorit. Planet. Sci., 1 [Google Scholar]
- Williams, J. P., Pathare, A. V., Costello, E. S., et al. 2022, J. Geophys. Res., 127, e2021JE007131 [Google Scholar]
- Wu, B., Huang, J., Li, Y., Wang, Y., & Peng, J. 2018, J. Geophys. Res., 123, 3256 [Google Scholar]
- Xiao, Z., Zeng, Z., Ding, N., & Molaro, J. 2013, Earth. Planet. Sci. Lett., 376, 1 [Google Scholar]
- Xie, M., & Xiao, Z. 2023, Earth. Planet. Sci. Lett., 602, 117963 [Google Scholar]
- Xie, M., Zhu, M.-H., Xiao, Z., Wu, Y., & Xu, A. 2017, Geophys. Res. Lett., 44, 10 [NASA ADS] [CrossRef] [Google Scholar]
- Xu, L., Qiao, L., Xie, M., et al. 2024, Geophys. Res. Lett., 51, e2024GL111311 [Google Scholar]
- Yue, Z., Di, K., Wan, W., et al. 2022, Nat. Astron., 6, 541 [Google Scholar]
- Yue, Z., Gou, S., Sun, S., et al. 2024, Innovation, 5 [Google Scholar]
- Zahnle, K., Schenk, P., Sobieszczyk, S., Dones, L., & Levison, H. F. 2001, Icarus, 153, 111 [NASA ADS] [CrossRef] [Google Scholar]
- Zeng, X., Liu, D., Chen, Y., et al. 2023, Nat. Astron., 7, 1188 [Google Scholar]
- Zhang, L., Liu, J., Michael, G., et al. 2024, Remote Sensing, 16, 3812 [Google Scholar]
- Zhang, Q. W. L., Yang, M.-H., Li, Q.-L., et al. 2025, Nature, 643, 356 [Google Scholar]
All Figures
|
Fig. 1 Crater density measurements. (a) Nearside and (b) farside of the Moon. Lunar Orbiter Laser Altimeter elevation data (Smith et al. 2010) were used, and the landing sites of the lunar exploration missions with returned samples (except for the Chang’e-3 and 4 missions) are shown. (c) Mapped craters (green circles) at the mare unit (purple polygon) containing the Chang’e-5 landing site (the star). Obvious secondary crater fields (light yellows) are excluded (Xie & Xiao 2023). (d) Zoomed-in view of the small nested crater mapping area. (e) Mapped craters (red circles) at the mare unit (green polygon) containing the Chang’e-6 landing site (the star) with the exclusion of secondary crater fields. The blue polygon shows the measurement boundary. The base maps of both panels c and e are Kaguya Terrain Camera morning. |
| In the text | |
|
Fig. 2 Boundaries of the Chang’e-6 unit with the exclusion of secondary crater fields. Our mapping boundary (blue) generally matches the largest consensus region among previous definitions of the boundary of the Chang’e-6 unit. The boundary of Xu et al. (2024) was taken from Zeng et al. (2023, a candidate landing region of the Chang’e-6 mission, named F; the flame red), which is a subregion of the boundary of Pasckert et al. (2018, not shown for clarity), and the boundary of Yue et al. (2024) is a little larger. The largest unit boundary (Haruyama et al. 2009; Pasckert et al. 2018; Yue et al. 2024) is not shown for clarity. |
| In the text | |
|
Fig. 3 Randomness analysis (Michael et al. 2012) of the craters at Chang’e-5 (craters measured in the nested small region; top) and Chang’e-6 (bottom) landing sites. The Y axis represents the number of standard deviations above or below the mean derived from Monte Carlo simulations. A positive number of standard deviations implies that the tested crater population is more ordered than random, while a negative value suggests that they are more clustered than random. The results of the randomness analysis (within about 1σ uncertainty) suggest minor (if any) contamination of secondary craters, which would cause the data to be more clustered. |
| In the text | |
|
Fig. 4 Crater size-frequency distributions. (a) Observed crater sizefrequency distributions by using a nested crater counting technique. Small craters were measured in a small region at the Chang’e-5 landing site (the blue polygon in Fig. 1c), and large craters were counted on the Chang’e-5 unit (the purple polygon in Fig. 1c). (b) SFD comparison. The SFD of Chang’e-5 was constructed from the SFDs of large craters mapped on a large area (the purple polygon in Fig. 1c), and smaller craters (blue) were mapped in a smaller region (the blue polygon in Fig. 1c) around the Chang’e-5 landing site. Error bars (1σ uncertainty) are given according to Poisson statistics. Both SFDs are considered completed for craters with diameters larger than 400 m. |
| In the text | |
|
Fig. 5 Crater size-frequency distributions extracted from the crater database of La Grassa et al. (2025). Error bars (1σ uncertainty) are given according to Poisson statistics. Although the AI-based approach of identifying craters is spatially dependent, at the low latitudes the Chang’e-5 and 6 units are located, the false positives are minor (<3%), the recall rate is about 85%, and true positives reach at least 97% (La Grassa et al. 2025). As a result, the AI-based approach for crater identification yields consistent and reliable results for both units, recognising at least a similar fraction of the actual crater population. |
| In the text | |
|
Fig. 6 Crater size-frequency distributions. The crater SFDs at Chang’e-5 and 6 are from Jia et al. (2020) and Yue et al. (2024), respectively. Error bars (1σ uncertainty) are given according to Poisson statistics. The density of the Chang’e-6 unit is less than that of the Chang’e-5 unit by a factor of at least 1.0345 (the smallest difference occurs at a diameter of 0.25 km), except for the small number statistics at 1.4 km in diameter. |
| In the text | |
|
Fig. 7 Crater production rate. (a) Relationship between cumulative crater production densities and surface ages (taken from Xie & Xiao 2023). The blue and red represent the densities with and without the correction of spatial-dependent impact flux (Lagain et al. 2024). The age of Apollo 16 is taken as 3.85 Ga, instead of 3.92 Ga used by Xie & Xiao (2023), which is the age of Apollo Descartes formation (Stöffler & Ryder 2001). A12 represents Apollo 12, and the other labels are composed similarly. L16 and L24 represent Luna 16 and Luna 24, respectively. (b) Cratering rate of diameter ≥ 1 km craters. Except for the black line, each horizontal line represents the mean cratering rate between two neighbouring ages. The cratering rates were calculated according to the cumulative crater production densities shown in panel (a), and their uncertainties were derived according to the error propagation (Ku 1966). The blue and red colours represent the cratering rates with and without the correction of spatial-dependent impact flux. There is no solid horizontal line at 3.19 Ga due to a negative cratering rate caused by a statistical fluctuation, as is consistent with adjacent cratering rates with 3σ uncertainties (note that the lull between 2 and 2.8 Ga cannot be explained by statistical fluctuation). All uncertainties are given with a 3σ confidence interval. |
| In the text | |
Current usage metrics show cumulative count of Article Views (full-text article views including HTML views, PDF and ePub downloads, according to the available data) and Abstracts Views on Vision4Press platform.
Data correspond to usage on the plateform after 2015. The current usage metrics is available 48-96 hours after online publication and is updated daily on week days.
Initial download of the metrics may take a while.