Fig. 7
Download original image
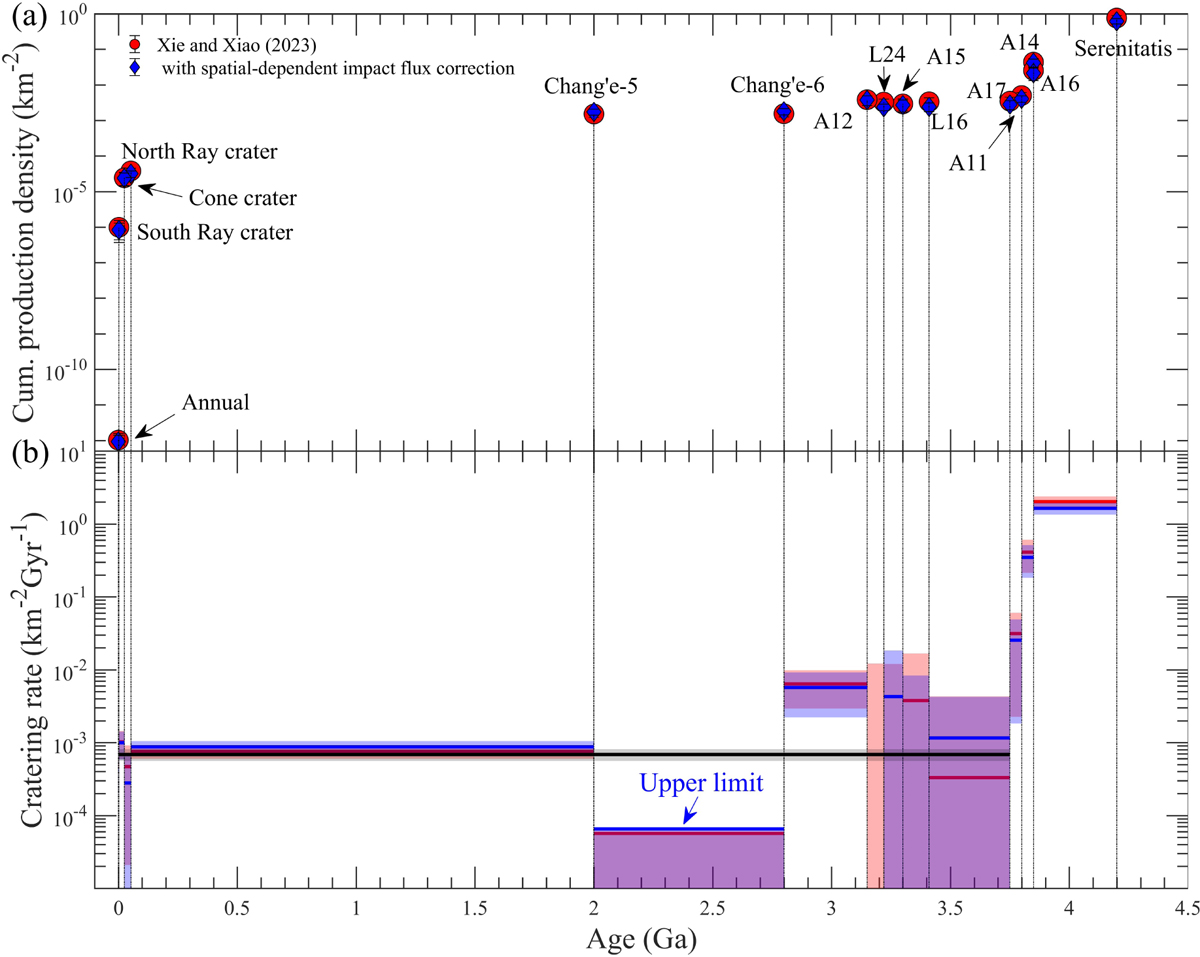
Crater production rate. (a) Relationship between cumulative crater production densities and surface ages (taken from Xie & Xiao 2023). The blue and red represent the densities with and without the correction of spatial-dependent impact flux (Lagain et al. 2024). The age of Apollo 16 is taken as 3.85 Ga, instead of 3.92 Ga used by Xie & Xiao (2023), which is the age of Apollo Descartes formation (Stöffler & Ryder 2001). A12 represents Apollo 12, and the other labels are composed similarly. L16 and L24 represent Luna 16 and Luna 24, respectively. (b) Cratering rate of diameter ≥ 1 km craters. Except for the black line, each horizontal line represents the mean cratering rate between two neighbouring ages. The cratering rates were calculated according to the cumulative crater production densities shown in panel (a), and their uncertainties were derived according to the error propagation (Ku 1966). The blue and red colours represent the cratering rates with and without the correction of spatial-dependent impact flux. There is no solid horizontal line at 3.19 Ga due to a negative cratering rate caused by a statistical fluctuation, as is consistent with adjacent cratering rates with 3σ uncertainties (note that the lull between 2 and 2.8 Ga cannot be explained by statistical fluctuation). All uncertainties are given with a 3σ confidence interval.
Current usage metrics show cumulative count of Article Views (full-text article views including HTML views, PDF and ePub downloads, according to the available data) and Abstracts Views on Vision4Press platform.
Data correspond to usage on the plateform after 2015. The current usage metrics is available 48-96 hours after online publication and is updated daily on week days.
Initial download of the metrics may take a while.