Fig. 3
Download original image
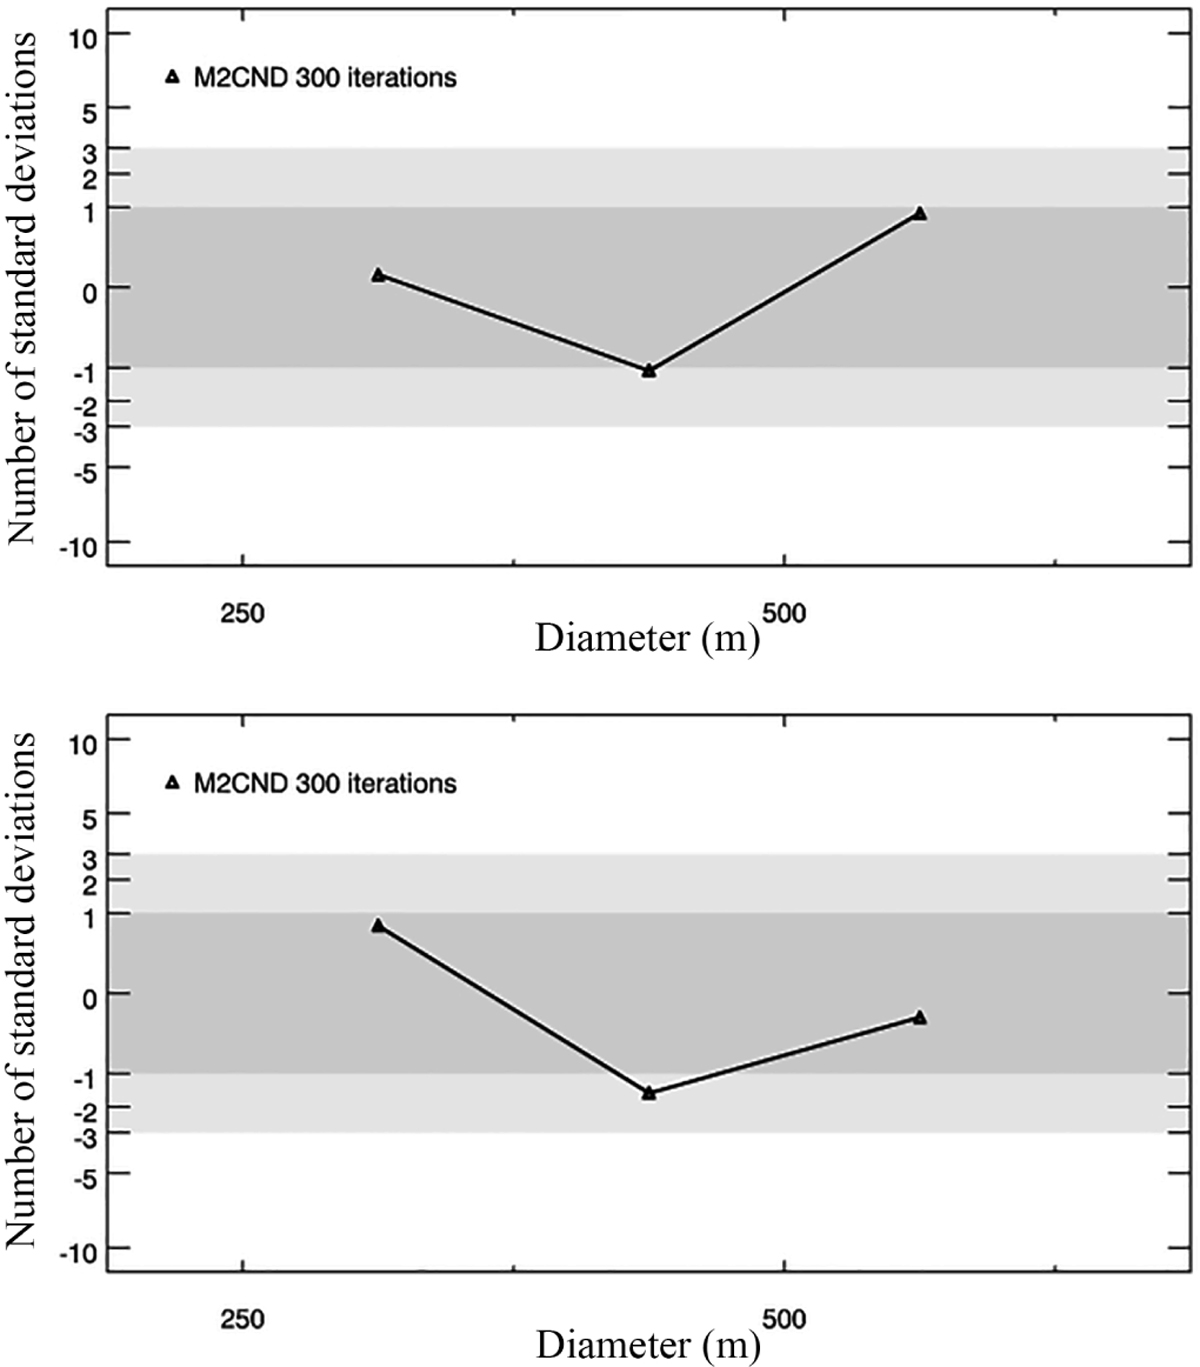
Randomness analysis (Michael et al. 2012) of the craters at Chang’e-5 (craters measured in the nested small region; top) and Chang’e-6 (bottom) landing sites. The Y axis represents the number of standard deviations above or below the mean derived from Monte Carlo simulations. A positive number of standard deviations implies that the tested crater population is more ordered than random, while a negative value suggests that they are more clustered than random. The results of the randomness analysis (within about 1σ uncertainty) suggest minor (if any) contamination of secondary craters, which would cause the data to be more clustered.
Current usage metrics show cumulative count of Article Views (full-text article views including HTML views, PDF and ePub downloads, according to the available data) and Abstracts Views on Vision4Press platform.
Data correspond to usage on the plateform after 2015. The current usage metrics is available 48-96 hours after online publication and is updated daily on week days.
Initial download of the metrics may take a while.