Fig. 4
Download original image
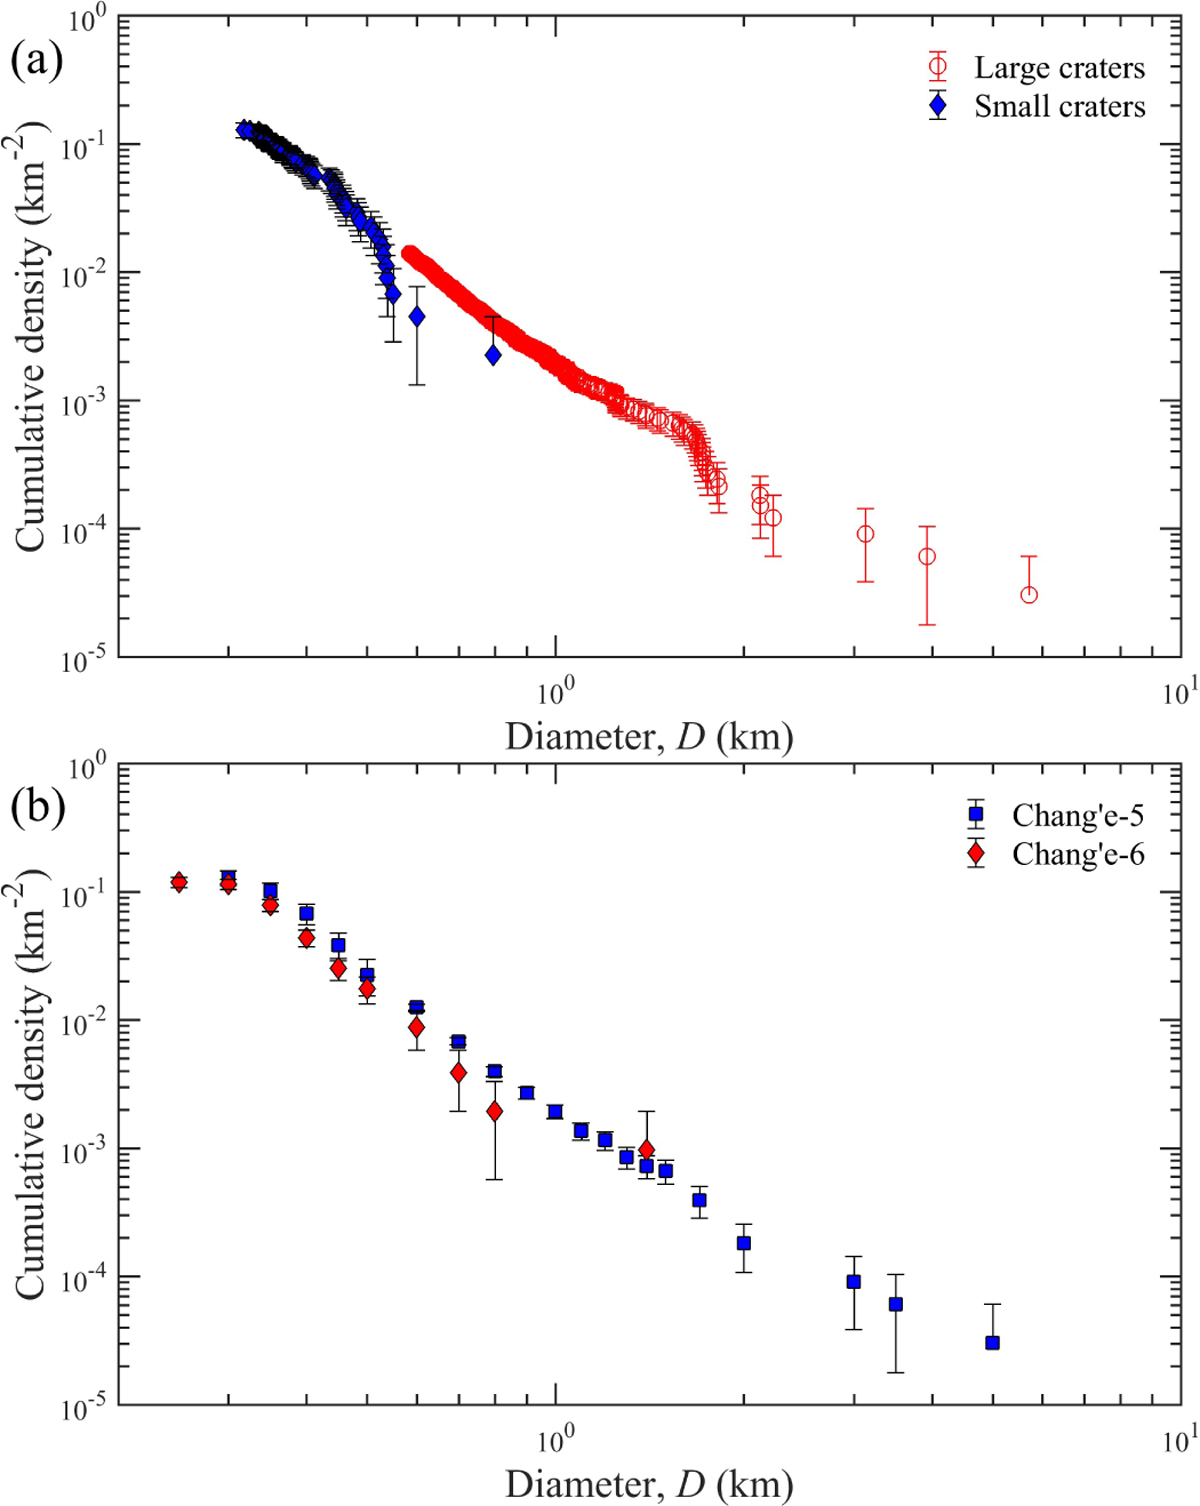
Crater size-frequency distributions. (a) Observed crater sizefrequency distributions by using a nested crater counting technique. Small craters were measured in a small region at the Chang’e-5 landing site (the blue polygon in Fig. 1c), and large craters were counted on the Chang’e-5 unit (the purple polygon in Fig. 1c). (b) SFD comparison. The SFD of Chang’e-5 was constructed from the SFDs of large craters mapped on a large area (the purple polygon in Fig. 1c), and smaller craters (blue) were mapped in a smaller region (the blue polygon in Fig. 1c) around the Chang’e-5 landing site. Error bars (1σ uncertainty) are given according to Poisson statistics. Both SFDs are considered completed for craters with diameters larger than 400 m.
Current usage metrics show cumulative count of Article Views (full-text article views including HTML views, PDF and ePub downloads, according to the available data) and Abstracts Views on Vision4Press platform.
Data correspond to usage on the plateform after 2015. The current usage metrics is available 48-96 hours after online publication and is updated daily on week days.
Initial download of the metrics may take a while.