| Issue |
A&A
Volume 708, April 2026
|
|
|---|---|---|
| Article Number | A278 | |
| Number of page(s) | 13 | |
| Section | Astronomical instrumentation | |
| DOI | https://doi.org/10.1051/0004-6361/202557434 | |
| Published online | 16 April 2026 | |
Diffraction-driven photometry: A novel method for stellar temperature determination
1
Departamento de Física, Universidad de La Laguna (ULL),
38206 San Cristóbal de La Laguna,
Santa Cruz de Tenerife,
Spain
2
Departamento Física de Materiales, Instituto Nicolás Cabrera, Universidad Autónoma de Madrid,
28049
Madrid,
Spain
★ Corresponding author: This email address is being protected from spambots. You need JavaScript enabled to view it.
Received:
26
September
2025
Accepted:
9
March
2026
Abstract
Context. Estimating stellar temperatures is a fundamental task in astrophysics, typically achieved using colour indices (CI) derived from multi-filter photometry. However, this method often requires sequential observations through different filters, making it vulnerable to brightness variations between exposures – such as those caused by stellar variability or transits – and sensitive to inter-filter calibration errors, both of which can compromise temperature estimation.
Aims. We introduce diffraction-driven photometry (DDP), a complementary technique that enables stellar temperature estimation from a single broadband image by extracting spectral information directly from the polychromatic point spread function (P-PSF).
Methods. We analytically derived the relationship between the P-PSF morphology and stellar temperature using Planck's law and diffraction theory. A new metric, the P-PSF intensity ratio (PIR), is defined and shown to correlate monotonically and invertibly with temperature. We performed extensive numerical simulations to verify this behaviour and quantify the performance of temperature retrieval under realistic instrumental noise using synthetic detector models.
Results. Our simulations show that the PIR provides a consistent estimator of stellar temperature and remains monotonic within the airy disc across a broad range of stellar types. The method is intrinsically robust against global flux variations and can be adapted to different optical systems through calibration. It performs best at high signal-to-noise ratios (S/Ns), but it still allows for useful classification at more moderate S/Ns.
Conclusions. We do not aim to replace classical CI techniques with DDP, but rather we offer a complementary route particularly well suited to scenarios where multi-filter observations are impractical. Its simplicity makes it attractive for small satellites and enables retroactive application to single-band archival data, providing a practical pathway towards reliable temperature retrieval under specific observational constraints.
Key words: instrumentation: photometers / methods: observational / space vehicles: instruments / techniques: photometric / stars: fundamental parameters / stars: solar-type
© The Authors 2026
 Open Access article, published by EDP Sciences, under the terms of the Creative Commons Attribution License (https://creativecommons.org/licenses/by/4.0), which permits unrestricted use, distribution, and reproduction in any medium, provided the original work is properly cited.
This article is published in open access under the Subscribe to Open model. This email address is being protected from spambots. You need JavaScript enabled to view it. to support open access publication.
1 Introduction
The development of space-based instrumentation has enabled significant advances in astrophysics by providing uninterrupted observations and access to wavelengths blocked by the Earth's atmosphere. However, deploying scientific payloads into orbit remains costly and subject to strict constraints in mass, volume, and power. In recent decades, the rise of small satellites – often launched as secondary payloads – has offered a cost-effective alternative to traditional large-scale missions, enabling broader access to space-based science. This paradigm shift has ushered satellite technology into a new era, where small satellites play an increasingly dominant role, and innovation now aims to achieve the capabilities of larger platforms in compact form (Helvajian & Janson 2009).
Photometry is a technique used to detect variations in the brightness of celestial objects using a photometer, essentially a calibrated camera (Bonaque-González et al. 2017). Due to its simplicity, photometry has been a fundamental tool in astronomy and remains a common feature in space-based observation (Claret 2017). To complement the purely photometric data, photometers often perform colour index (CI) measurements, defined as the difference between two observations of a star's magnitude at different wavelengths. This allows for an estimate of the star's effective temperature (Golay 2012), which in turn provides indirect access to key physical parameters such as stellar radius, luminosity, and distance when combined with other observables (Binney & Merrifield 1998). Despite its widespread success, CI measurements also face practical limitations. Observing the same target through multiple filters increases noise – especially when exposures are not simultaneous – and effectively reduces mission efficiency. For example, any intrinsic or instrumental flux variability occurring between sequential exposures directly propagates into the measured CI. Even modest brightness variations at the level of ∼0.01 mag, commonly observed due to stellar activity, rotation, or pulsations, can introduce systematic colour offsets comparable to typical photometric uncertainties, leading to temperature biases of tens to hundreds of kelvin, depending on spectral type (Howell 2000; Bessell 2005). In addition, filter-switching mechanisms introduce mechanical complexity, increased mass and power consumption, while narrowband filters require longer integration times (Howell 2000). Such filter changes also entail operational overheads – including mechanical settling times and additional calibration steps – that reduce observing efficiency and overall duty cycle, particularly in resource-limited missions.
An alternative to filter-based photometry is employed Gaia, which uses dispersive prisms to obtain simultaneous lo resolution fluxes in two channels (BP and RP) (Prusti et al. 201 While this approach eliminates the timing offsets of sequ tial filters, it comes at the cost of increased optical complex and effectively splits the incoming light, reducing per-chan signal-to-noise ratio (S/N) and thus requiring longer integ tion times for faint sources. These trade-offs, while mana able in large dedicated missions, become particularly criti for microsatellites, where mass and power constraints comb with inherently smaller apertures and reduced photon-collect capability (Liddle et al. 2020). These restrictions motiv the search for simplified approaches that can complement in specific cases, reduce reliance on traditional multi-fil photometry.
A key optical feature of photometric systems is that stars, being effectively point sources, form images on the detector that correspond to the system's point spread function (PSF), provided no external factors disturb the incoming wavefront. We present diffraction-driven photometry, a technique that extracts temperature information from a single broadband photometric image by analysing the polychromatic PSF (P-PSF), capturing spectral features encoded in its structure. While not intended to replace classical CI, this approach can provide a complementary path in contexts where multi-filter observations are impractical. The theoretical foundation of the approach is presented in Sect. 2, the method is validated through simulations in Sect. 3, and a discussion of the results is given in Sect. 4.
2 Mathematical derivations
In the following, we present a mathematical formulation of the proposed technique to clarify its underlying principles and theoretical behaviour. For analytical tractability, this mathematical development adopts a set of standard assumptions commonly used in diffraction-limited optical analyses, including a circular entrance pupil and the absence of optical aberrations, resulting in a rotationally symmetric P-PSF. The system transmission and detector quantum efficiency are assumed to be approximately wavelength independent over the spectral range considered, and the optical response is taken to be spatially invariant and stable. Stellar spectral energy distributions are modelled using a blackbody approximation. These assumptions provide a simplified but physically meaningful framework to describe the method and assess its theoretical performance.
2.1 The polychromatic PSF
When a star is observed with a diffraction-limited optical system, its image on the detector is not a point but the system's PSF, whose shape is governed by diffraction. In monochromatic light, this PSF is described by the well-known airy pattern. In practice, however, astronomical observations are performed over a finite spectral bandwidth, and the recorded image corresponds to the superposition of monochromatic PSFs at different wavelengths. We refer to this broadband diffraction pattern as the P-PSF. Because diffraction depends explicitly on wavelength, different parts of the stellar spectrum contribute differently to the final P-PSF shape, imprinting spectral information into its spatial intensity distribution. The size of the airy disc can be defined according to the approximate relationship (Born & Wolf 2013):
 (1)
(1)
Here θ is the angular radius of the first minimum of the diffraction pattern, λ is the wavelength, and D is the diameter of the entrance pupil. Assuming a fixed D and diffraction-limited optics, the P-PSF is obtained by integrating the monochromatic airy discs over the spectrum to which the optical system is sensitive, weighting each by their respective amplitude functions. Thus, the P-PSF at a radial coordinate ρ can be defined as:
 (2)
where λmin and λmax represent the spectrum interval in which the detector is sensitive, A is the system amplitude function, QE is the detector quantum efficiency, W is the spectral distribution of the source, T is the temperature, and I is the monochromatic irradiance at wavelength λ and radial distance ρ, i.e., the monochromatic airy intensity profile, defined by:
(2)
where λmin and λmax represent the spectrum interval in which the detector is sensitive, A is the system amplitude function, QE is the detector quantum efficiency, W is the spectral distribution of the source, T is the temperature, and I is the monochromatic irradiance at wavelength λ and radial distance ρ, i.e., the monochromatic airy intensity profile, defined by:
 (3)
with J1 as the Bessel function of the first kind, I0 as the wavelength-dependent peak intensity, and α defined as:
(3)
with J1 as the Bessel function of the first kind, I0 as the wavelength-dependent peak intensity, and α defined as:
 (4)
(4)
Here θ is the angular radial coordinate measured from the optical axis. Given that a star's spectral distribution is governed by its temperature, Eq. (2) implies that this information is inherently encoded in the shape of the P-PSF and could, in principle, be extracted from it.
Figure 1 compares a monochromatic PSF with a P-PSF constructed from three representative bands (RGB), as would be recorded in broadband detection. Both diffraction patterns are shown on a logarithmic scale to improve visualisation. The P-PSF appears broader and less contrasted due to the wavelengthdependent spreading of the airy pattern. The radial intensity profiles (bottom) emphasize how diffraction potentially encodes spectral information into the P-PSF structure.
It is worth noting that the actual irradiance distribution of the P-PSF also depends on the wavefront phase and the system's pupil geometry. These effects can be incorporated in Eq. (2) through the generalised pupil function and a phase term within the Fourier transform framework, as well as with a convolution operation to incorporate spectral dispersion. In this work, we assume diffraction-limited performance over the operating spectral range – an appropriate approximation for small satellite optics – which allows the problem to be reduced to a single radial dimension by exploiting the system's rotational symmetry.
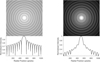 |
Fig. 1 Comparison between a PSF (left) and a P-PSF constructed from RGB components as would be captured by a monochromatic camera (right), both displayed in logarithmic scale. The P-PSF appears wider and less contrasted due to the wavelength-dependent diffraction broadening. Lower panels show the corresponding radial intensity profiles, illustrating how spectral information is potentially encoded in the P-PSF shape. |
2.2 Establishing an analogue to the colour ratio
Several transformations and summary metrics can, in principle, be constructed from the P-PSF to extract its temperaturedependent information. In this work, we focus on a simple and robust operation that captures the dominant wavelengthdependent redistribution of intensity within the P-PSF. Specifically, we introduce the P-PSF intensity ratio (PIR), defined as a ratio between selected radial positions of the normalised P-PSF. In practical implementations, this ratio can be evaluated by integrating the normalised P-PSF over finite spatial regions (e.g. detector pixels) before forming the ratio. This metric emphasises changes in the P-PSF shape and, thanks to normalisation, is largely insensitive to absolute flux variations, making it well suited for temperature-sensitive characterisation. This approach is conceptually analogous to standard photometric techniques, such as CI, in which spectral information is compressed into a small number of robust observables.
In standard photometry, the CI is defined as:
 (5)
where m1 and m2 are the star's magnitudes at different wavelengths, and F1 and F2 are the corresponding fluxes. Temperature is inferred by calibrating this ratio against stellar models based on Planck's law (Planck 1914; Flower 1996):
(5)
where m1 and m2 are the star's magnitudes at different wavelengths, and F1 and F2 are the corresponding fluxes. Temperature is inferred by calibrating this ratio against stellar models based on Planck's law (Planck 1914; Flower 1996):
 (6)
where B(λ, T) is the spectral radiance, h is the Planck's constant, c is the speed of light, k is the Boltzmann's constant, T is the absolute temperature, and λ the wavelength. A key property of this function is that, for any λ, B(λ, T) increases monotonically with temperature. This implies that blackbody curves do not intersect, ensuring:
(6)
where B(λ, T) is the spectral radiance, h is the Planck's constant, c is the speed of light, k is the Boltzmann's constant, T is the absolute temperature, and λ the wavelength. A key property of this function is that, for any λ, B(λ, T) increases monotonically with temperature. This implies that blackbody curves do not intersect, ensuring:
 (7)
(7)
Because the CI depends on the flux ratio between two bands, and because Planck's function is strictly monotonic, this ratio is uniquely determined by temperature. Therefore, the CI can be inverted to retrieve T, provided the two bands are sufficiently separated (Gray 2005). This uniqueness is the foundation for its reliability as a temperature estimator.
To establish an equivalent method using the P-PSF, we defined the PIR as:
 (8)
where P − PS F(ρ) represents the intensity at a given radial position ρ, and j > i. In particular, ρ1 corresponds to the intensity at the central position of the P-PSF. Since the P-PSF is computed as the weighted sum of Planck functions (as shown in Eq. (2), where W(λ, T) is given by Eq. (6)), it inherits the monotonic dependence of the Planck distribution with temperature. Consequently, the PIR also behaves as a monotonic function of T , ensuring a one-to-one mapping between temperature and the measured intensity ratio.
(8)
where P − PS F(ρ) represents the intensity at a given radial position ρ, and j > i. In particular, ρ1 corresponds to the intensity at the central position of the P-PSF. Since the P-PSF is computed as the weighted sum of Planck functions (as shown in Eq. (2), where W(λ, T) is given by Eq. (6)), it inherits the monotonic dependence of the Planck distribution with temperature. Consequently, the PIR also behaves as a monotonic function of T , ensuring a one-to-one mapping between temperature and the measured intensity ratio.
To formalize it, we substituted the P-PSF definition [Eq. (2)] into the PIR expression:
 (9)
(9)
Assuming that the system's transmission function and detector quantum efficiency remain approximately constant over the relevant spectral range, they factor out in the ratio and cancel, leaving the PIR as a function of temperature alone. Differentiating this expression with respect to T yields:
 (10)
where Wi = ∫ W(λ,T) I(λ,ρi) dλ, Wj = ∫ W(λ,T) I(λ,ρj) dλ, ∂TWi = ∫ ∂W/∂T · I(λ,ρi), dλ, and ∂T Wj = ∫ ∂W/∂T · I(λ,ρj) dλ.
(10)
where Wi = ∫ W(λ,T) I(λ,ρi) dλ, Wj = ∫ W(λ,T) I(λ,ρj) dλ, ∂TWi = ∫ ∂W/∂T · I(λ,ρi), dλ, and ∂T Wj = ∫ ∂W/∂T · I(λ,ρj) dλ.
Since ∂W/∂T > 0 for all λ and I(λ,ρ) is independent of T, the numerator in Eq. (10) is non-zero, confirming that PIR(T ) is strictly monotonic.
In addition to being monotonic in T , the PIR must also remain non-degenerate with respect to spatial position. This requires the P-PSF intensity to decrease monotonically with radius within the central airy disc, ensuring that PIR values obtained at different temperatures remain distinct. Both conditions - monotonicity in T and in ρ, at least within a well-defined region, are necessary to guarantee invertibility. The monochromatic airy pattern [Eq. (3)] satisfies this property for ρ > 0 up to its first minimum. Since the P-PSF is a weighted sum of such profiles using the Planck function as a weight, this monotonicity is preserved in the polychromatic case within the central region. To formalize this, we examined the radial derivative of the P-PSF:
 (11)
(11)
Since ∂I(λ,ρ)∂ρ < 0 for all λ within the first airy disc, the integral remains negative at any temperature. This confirms that:
 (12)
(12)
Beyond the first diffraction minimum, the airy pattern exhibits oscillations that disrupt the strict monotonicity of the P-PSF. Consequently, the PIR remains a strictly monotonic and invertible function of temperature only within the central airy disc, where the PIR ensures a unique mapping to temperature. Measurements must therefore be restricted to this region.
2.3 Numerical verification of the P-PSF and PIR uniqueness
To validate the analytical results, we numerically compute the two-dimensional P-PSF for blackbodies with temperatures from 1000 to 40 000 K, in steps of 2000 K, under ideal diffractionlimited conditions. Assuming rotational symmetry, the problem reduces to a single radial dimension and was evaluated using:
 (13)
(13)
Numerical integration was performed using adaptive quadrature implemented in MATLAB R2016a (MathWorks, Natick, Massachusetts), evaluating the P-PSF at 1000 radial positions within a range of 2 × 10⁻⁵ radians from the peak. The simulations assume a 10.5 cm aperture and a spectral sensitivity between 500 and 1000 nm. Although no analytical solution exists for Eq. (13), the function can be accurately sampled numerically under these conditions.
The numerical results are presented in Fig. 2, which shows the normalised radial intensity profiles of the simulated P-PSFs. Each curve corresponds to a different stellar temperature; the first (topmost) curve represents the coolest star, while subsequent curves correspond to increasingly hotter stars. As expected, the profiles remain distinct and non-intersecting within the central region under these assumptions. Cooler stars yield broader profiles with slower intensity decay, while hotter stars generate narrower and steeper distributions. Beyond the first airy minimum, diffraction-induced oscillations become prominent, limiting the region suitable for robust temperature estimation.
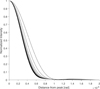 |
Fig. 2 Normalised radial intensity profiles of P-PSFs for blackbodie with temperatures ranging from 1000 K to 40 000 K in steps of 2000 K computed for a 10.5 cm diameter aperture and a spectral range of [50 1000] nm. Only the right half of each P-PSF is shown after individual normalization. Each curve corresponds to a different temperature; the topmost curve represents the coolest star (1000 K), and each subsequent curve corresponds to a hotter star. No legend is included for clarity. |
2.4 Parameter dependencies in diffraction-driven photometry
The performance of DDP potentially depends on several factors, notably the radial measurement position, filter bandwidth, and entrance pupil diameter, which can influence the morphology of the P-PSF and thus the resulting PIR values. We systematically analyse these parameters to assess their impact on temperature sensitivity.
To this end, we repeated the simulation described in the previous section, computing PIR values between the P-PSF peak and radial positions at 0.2 × 10⁻⁵, 0.4 × 10⁻⁵, 0.6 × 10⁻⁵, and 0.8 × 10⁻⁵ radians. The simulation assumed a 10.5, cm pupil and a [500,1000], nm bandwidth, with the results shown in Fig. 3.
The results confirm that the PIR remains a unique and monotonic function of temperature, supporting its potential use as a diagnostic tool. However, at high temperatures, the PIR curves tend to flatten, reducing their sensitivity to small temperature variations. Since the PIR measures intensity ratios at different radial positions, distinguishing between closely spaced temperatures becomes increasingly dependent on the optical system's resolution and the detector's precision, particularly as the difference in intensities diminishes with rising temperature.
Figure 4 shows the absolute PIR difference between 40 000 K and 38 000 K as a function of radial distance, for a 10.5 cm pupil and a [500,1000] nm bandwidth. As expected, sensitivity improves with increasing separation from the P-PSF centre, maximizing before the first diffraction minimum. Beyond this point, secondary oscillations reduce the robustness of the PIR as a temperature indicator. These results emphasize the importance of good P-PSF sampling, either through small plate scales or apertures that enhance diffraction and facilitate temperature discrimination.
Another critical design parameter is the filter bandwidth. Figure 5 shows the behaviour of the PIR derivative at a radial distance of 0.6 × 10⁻⁵ radians and a 10.5cm pupil for different spectral ranges: [500, 1000] nm, [550, 950] nm, [600, 900] nm, and [650, 850] nm. The results reveal that broader bandwidths lead to larger PIR differences at high temperatures, indicating that the method is highly sensitive to the selected spectral range. In particular, wide-band filters enhance temperaturedependent variations in the DDP signal, improving temperature resolution – especially for hotter stars.
Figure 6 shows the dependence of the PIR derivative on the entrance pupil diameter (9.5, 10.5, 11.5, and 12.5 cm) at a fixed radial distance of 0.6 × 10⁻⁵ radians and a bandwidth of [500, 1000] nm. Although larger pupils appear to enhance temperature sensitivity, this effect is not intrinsic: increasing the aperture shrinks the P-PSF, so a fixed angular distance corresponds to a larger relative radial displacement. Therefore, the observed improvement largely reflects diffraction scaling rather than an intrinsic gain in sensitivity, a result we have explicitly verified in our simulations. In practice, the pupil diameter mainly affects the P-PSF sampling, and once this is accounted for, the underlying PIR–temperature relationship appears robust.
The results presented in this section indicate that radial measurement position, filter bandwidth, and P-PSF sampling strongly influence the performance of DDP. Optimal temperature sensitivity is achieved by measuring within the first airy disc, where the PIR–temperature relationship remains monotonic. Wider bandwidths significantly enhance temperature-dependent variations in the PIR, particularly for hotter stars. The entrance pupil diameter affects the spatial sampling of the P-PSF, not the intrinsic temperature sensitivity, requiring careful calibration depending on the optical setup.
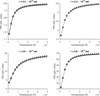 |
Fig. 3 Dependence of the PIR on temperature for different radial distances from the central peak. Each curve represents the PIR computed at 0.2 × 10⁻⁵, 0.4 × 10⁻⁵, 0.6 × 10⁻⁵, and 0.8 × 10⁻⁵ radians from the centre of the P-PSF. |
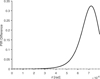 |
Fig. 4 PIR difference between 40 000 K and 38 000 K as a function of radial distance, ranging from 0 to 0.8 × 10⁻⁵ radians, for a 10.5 cm pupil and a [500, 1000] nm bandwidth. |
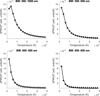 |
Fig. 5 Dependence of the PIR derivative at 0.6 × 10⁻⁵ radians ant 10.5 cm pupil on the filter bandwidth (BW). |
2.5 Empirical relationship between PIR and temperature
To derive an analytical expression relating the PIR to stellar temperature, several fitting models were tested against the simulated PIR values. Among polynomial, power-law, and exponential forms, the best fit was obtained using a modified exponential function:
 (14)
where a, b, c, and d are empirical constants determined by the optical configuration and the selected radial measurement point, i and j. For a representative case with a 10.5 cm pupil, a [500, 1000] nm bandwidth, and θ = 0.4 × 10⁻⁵ radians, the fit yields R2 > 0.9999 and an RMSE below 10−3, indicating that this functional form provides a reasonable approximation across 1000–40 000 K.
(14)
where a, b, c, and d are empirical constants determined by the optical configuration and the selected radial measurement point, i and j. For a representative case with a 10.5 cm pupil, a [500, 1000] nm bandwidth, and θ = 0.4 × 10⁻⁵ radians, the fit yields R2 > 0.9999 and an RMSE below 10−3, indicating that this functional form provides a reasonable approximation across 1000–40 000 K.
The inversion of Eq. (14) provides a direct expression for temperature estimation from a measured PIR:
 (15)
(15)
This relation allows the temperature to be inferred from a single photometric image, once calibration is performed for the specific instrument configuration. The model reproduces the key physical trends expected from diffraction theory: at high temperatures the PIR changes only slowly with T , limiting sensitivity, whereas at lower temperatures the PIR varies more rapidly, enhancing detectability. The method remains valid provided PIR > d, where d denotes the asymptotic value of the PIR at very high temperatures, ensuring that the logarithmic argument remains positive.
The sensitivity of temperature to PIR measurements can be evaluated by differentiating Eq. (15):
 (16)
(16)
This expression quantifies how small variations in the measured PIR translate into uncertainties in the inferred temperature. It confirms that temperature sensitivity is highest at lower temperatures and progressively degrades as temperature increases. Physically, this is because, at low temperatures, the diffraction effects are stronger, leading to greater variations in the P-PSF intensity profile. In contrast, for hotter stars, the blackbody spectrum flattens over the observational bandwidth, causing the PIR to approach an asymptotic value and reducing the sensitivity of DDP to temperature variations.
Finally, although the fitting parameters depend on θ, bandwidth, and optical system design, the modified exponential form remains robust across configurations. This suggests that DDP could be adapted to different instrumental setups, provided that appropriate recalibration is performed.
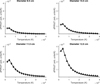 |
Fig. 6 Dependence of the PIR derivative on the entrance pupil diameter at a fixed radial distance of 0.6 × 10⁻⁵ radians and a bandwidth of [500, 1000] nm. Each panel corresponds to a different pupil size: 8.5, 10.5, 11.5, and 12.5 cm. |
2.6 Impact of interstellar extinction on diffraction-driven photometry
Interstellar extinction modifies the observed spectral energy distribution of stars, introducing systematic biases in temperature estimation. In traditional photometry, extinction shifts the CI linearly, following:
 (17)
where A1 and A2 are the extinction values at two photometric bands.
(17)
where A1 and A2 are the extinction values at two photometric bands.
In DDP, extinction modifies the P-PSF intensity across the spectrum. In model this, we adopted a simplified power-law extinction curve consistent with empirical fits in the optical/near-IR regime (e.g., Draine 2003; Cardelli et al. 1989):
 (18)
where AV is the extinction at 550 nm and γ controls the wavelength (λ) dependence. The observed PIR thus became:
(18)
where AV is the extinction at 550 nm and γ controls the wavelength (λ) dependence. The observed PIR thus became:
 (19)
(19)
For small values of AV, the extinction introduces an approximately linear bias in the PIR, analogous to CI distortions, though modulated by the P-PSF structure.
To verify this, we numerically simulated blackbody spectra in the 3000–20 000 K range, applying a standard extinction law with AV = 1.0 mag and γ = 1.8 over a [500, 1000] nm bandpass. The PIR was computed at a radial distance of 0.4 × 10⁻⁵ radians, and compared to the CI derived from two synthetic bands centred at 550 nm and 800 nm.
The resulting temperature bias is shown in Fig. 7. The figure indicates that extinction affects both methods in a comparable way and could, in principle, be corrected using standard laws.
3 Results
Having established the theoretical basis for the P-PSF and its monotonic relation with temperature, we now explore the feasibility of retrieving temperatures under more realistic observational conditions. Unlike idealised models, real observations are limited by pixel size (detectors integrate the P-PSF over finite pixel areas covering Δθ), bit depth, sensor resolution, and finite S/N, all of which affect PIR measurement precision.
To evaluate these effects, we developed a simulation framework incorporating realistic instrumental parameters (Table 1). For concreteness, these parameters were loosely based on the design of the TESS telescope (Chrisp et al. 2015), chosen not because it is optimised for DDP, but because it provides a well-documented, representative example of a modern space-based photometric instrument (the same configuration was also partially adopted in the preceding theoretical simulations). Key settings include a 14-bit sensor, a [600, 1000] nm filter, and sampling scenarios from 2 to 8 pixels across the P-PSF half-profile.
Due to the asymptotic flattening of the PIR–temperature relation at high T , small measurement errors can produce large uncertainties when inverting Eq. (14). To mitigate this, we built a reference database of PIR values at 25 K steps between 1000–40 000 K, computed from noise-free spectra. This database provides a theoretical baseline that enables more robust temperature retrieval by direct interpolation, while observational noise is introduced separately in the simulations.
Regarding the noise introduction, instead of modelling individual sources separately, we applied a direct S/N-based approach:
 (20)
where N(0, σnoise) is Gaussian noise with the standard deviation:
(20)
where N(0, σnoise) is Gaussian noise with the standard deviation:
 (21)
(21)
Quantization effects were modelled assuming a 14-bit detector, applying:
 (22)
(22)
where Cmax denotes the detector full-well capacity. Finally, to replicate the four-fold symmetry of the real P-PSF, independent noise realizations were generated for each quadrant, and the final measurement was computed as:
 (23)
(23)
When sampling the P-PSF with N pixels (11,12,…, IN), multiple PIR values can be defined by forming all unique PIRs ratios:
 (24)
(24)
As N increases, the number of independent PIRs grows rapidly, enabling greater robustness against noise by combining multiple estimates.
For each PIR(i, j), we generated 1000 noise realizations to compute its standard deviation, σPIR, and retrieved its corresponding temperature by matching to the nearest noise-free value in the PIR database:
 (25)
(25)
Each estimate was weighted inversely to its uncertainty:
 (26)
and the final temperature was computed as a weighted average:
(26)
and the final temperature was computed as a weighted average:
 (27)
(27)
For N = 2 (only two pixels sampled), a single PIR is available and the estimation reduces to the basic method. For N > 2, this approach leverages redundancy to enhance precision and noise resilience.
It is important to note that, following the standard definition where the P-PSF extends to contain 90% of the total energy, the outermost sampled pixel is located near the first airy minimum. This positioning has direct implications for temperature retrieval, as the corresponding  associated with these edge pixels tends to be higher due to increased oscillations and reduced intensity contrast. However, since the weighting scheme naturally minimizes the influence of high-uncertainty regions, these outer pixels typically receive negligible weight in the final estimation, regardless of the specific energy threshold adopted.
Figure A.1 in Appendix A summarises the overall behaviour of the method across S/N values and pixel samplings. Rather than focusing on absolute numbers – which is examined in detail in the following section – this figure illustrates the main trends. At all pixel sampling levels, the average error decreases with increasing S/N, but the dispersion of the estimates grows significantly with stellar temperature, in line with the theoretical expectations discussed earlier. This effect becomes especially evident at the highest temperatures, where small PIR differences are harder to resolve.
A more detailed view is provided in Figure 8, which shows how the standard deviation evolves jointly with temperature and S/N. To improve clarity, only a representative subset of S/N values is shown. As expected, increasing the number of sampled pixels reduces the uncertainty, but the general trend remains: the error is relatively well contained at low and intermediate temperatures, while at high temperatures it rises sharply. These results confirm that the limiting factor of DDP is not the mean bias – which can be small even at moderate S/N – but the stability of the retrieval across the full stellar range. Importantly, the inclusion of additional pixels, and thus greater redundancy in PIR combinations, consistently improves robustness against noise and helps to stabilize the retrieval, particularly in regimes where the intrinsic sensitivity of the method decreases.
The analysis of the weights assigned to each PIR, following Eq. (27), reveals that central pixels consistently dominate the temperature retrieval. Their higher signal levels make them less affected by noise, while PIRs involving the outermost pixels receive near-zero weights due to their proximity to the first airy minimum and their greater susceptibility to fluctuations.
Theoretically, as shown in Fig. 3, PIRs between more widely separated pixels should provide stronger temperature sensitivity due to larger intensity contrasts. In practice, however, noise dominates the low-intensity regions, rendering these PIRs unreliable. This produces a divergence between the idealised case and the realistic behaviour: the most sensitive ratios in theory are often the most unstable in observations. Consequently, DDP gains robustness by prioritizing PIRs that maximize stability rather than theoretical sensitivity, with redundancy from multiple pixels further reinforcing this effect.
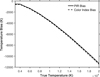 |
Fig. 7 Temperature bias induced by interstellar extinction for PIR (solid line) and traditional colour index methods (dashed line), as a function of the true stellar temperature. |
Simulation parameters for PIR temperature retrieval.
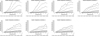 |
Fig. 8 Evolution of standard deviation in temperature estimation using two to eight pixels for the selected S/N values. |
Summary of pixel sampling, objective standard deviation (σobj), and required signal-to-noise ratio (S/N) values for stellar temperature intervals considered in this study.
3.1 Signal-to-noise constraints in diffraction-driven photometry versus colour index
To place the previous results in context and compare them with the gold standard of CI, we can divide the stars into three groups. First, the cool stars, between 2500 and 5000 K, corresponding to late K and M classes. In this range there are about 20 spectral subtypes (K0–M9), with typical temperature separations of 100–150 K, reaching a maximum of ∼150 K and a minimum of ∼80 K between adjacent subtypes. Second, the intermediatetemperature stars, between 5000 and 10 000 K, which include the G, F, and A classes. Here we find roughly 30 subtypes (G0–A9), with average steps of 100–200 K, ranging from ∼80 K in late G stars up to ∼200 K in early A stars. Finally, for stars hotter than 10 000 K we enter the B and O classes, with about 18 subtypes in total. In this regime the separations are much larger: 500–1500 K between B subtypes and as high as 2000–3000 K among the hottest O stars. These values depend on the adopted calibration and luminosity class, but provide representative benchmarks.
To estimate the S/N required for CI, one may either model the full instrument or rely on empirical calibrations. Bessell et al. (1998) tabulate polynomial Teff-colour relations; from their slopes, a colour error of σCI ≍ 0.02 mag in V − I typically propagates to ∼100–150 K for cool K–M stars. This value can be regarded as a representative bound for historical ground-based photometry. Evans et al. (2018), in their validation of Gaia DR2, report per-band random errors as low as σm ≍ 2 mmag per CCD sample in the G channel for bright sources, while large-scale systematics at the ∼10 mmag level set a more realistic floor, particularly for GBP and GRP. These two cases therefore bracket the performance of modern large surveys.
We converted magnitude errors to S/N via
 (28)
and for a colour CI = m1 − m2 with comparable independent band errors, we used
(28)
and for a colour CI = m1 − m2 with comparable independent band errors, we used
 (29)
(29)
Thus, σCI = 0.02 mag implies a per-band requirement of S/N ≍ 77, corresponding to temperature uncertainties of order 100– 150 K for cool stars (Bessell et al. 1998). At the other extreme, σm = 2 mmag (Gaia's best case) implies σCI ≍ 2.8 mmag, S/N ≍ 540 per band, and temperature uncertainties as low as ∼20–30 K, whereas at the more realistic systematic floor of 10 mmag the requirement becomes S/N ≍ 110, corresponding to uncertainties of ∼50–100 K (Evans et al. 2018).
Table 2 summarises the S/N requirements derived for DDP as a function of the number of pixels considered. In the 2500– 5000 K range, to reproduce the best-case performance of CI (20–30 K precision, Gaia bright stars), DDP would demand S/N levels exceeding 3000, which are beyond practical reach. However, for more representative classification thresholds (±100– 150 K), the required S/N is reduced to 200–800 depending on the pixel configuration, comparable to the values routinely achieved in high-quality ground-based photometry. This indicates that while DDP cannot rival CI at the milli-magnitude level, it remains competitive in the astrophysically relevant regime of stellar classification.
For stars in the intermediate range of 5000–10 000 K (roughly G to A classes), CI is intrinsically more sensitive to effective temperature than in cooler stars, because the spectral energy distribution varies more steeply across the optical bands. This is reflected in the slopes of the Teff-colour relations: using the B − V calibration of Casagrande et al. (2010), we find |dTeff/d(B − V)| ≍ 2700–5200 Kmag−1 between 6000 and 8000 K. As a result, a given photometric error translates into smaller temperature uncertainties than for late-type stars. For example, a colour error of σCI = 0.02 mag propagates into ΔTeff ≈ 50–100 K, compared to ∼100–150 K below 5000 K. At the opposite extreme, the Gaia DR2 performance reported by Evans et al. (2018) reaches σm ≍ 0.002 mag (2 mmag) per band, i.e. S/N ≍ 540. The corresponding colour error, σCI ≍ 2.8 mmag, yields ΔTeff ≍ 8–15 K in this temperature range. A more conservative systematic floor of 10 mmag (S/N ≍ 110) still results in ΔTeff below ∼50 K. Thus, although the per-band S/N requirements are formally the same as in the cool regime, the steeper Teff dependence of CI makes temperature determinations significantly more precise for stars between 5000 and 10 000 K.
In this intermediate regime, the simulated DDP configuration cannot compete with the precision of CI: Table 2 shows that achieving uncertainties of ±150 K requires S/Ns above ∼1000, rising to several thousand when limited pixel sampling is used. By contrast, CI delivers tens of Kelvin precision at lower S/N. Nevertheless, if the objective is relaxed to a coarser classification – for example, distinguishing late-type G from early A stars rather than resolving fine temperature differences – the requirements become more moderate. For instance, with 6 pixel sampling, S/N values of the order of 600 are sufficient to maintain uncertainties within ±500 K, which may still be scientifically useful when full multi-band photometry is not available. This highlights that DDP is not a competitor to CI in this temperature range, but can still provide scientifically meaningful constraints when CI is inaccessible.
For stars hotter than 10 000 K (B and O classes), broad-band CI in the optical rapidly lose diagnostic power. In this regime the stellar spectrum approaches the Rayleigh–Jeans limit, so that indices such as B − V change only weakly even for temperature differences of several thousand Kelvin. Martins et al. (2005) provide a modern Teff scale for O stars, showing that adjacent subtypes differ by 2000–3000 K, with typical uncertainties of 500–1500 K depending on luminosity class. These limitations are not primarily instrumental but physical: even if photometric errors were reduced to the millimagnitude level (corresponding to S/N > 500 per band), the insensitivity of optical colours would still prevent uncertainties below ∼1000 K. In practice, the effective temperature of B and O stars is determined from spectroscopic diagnostics such as the He,I/He,II line ratios rather than from CI (Kudritzki & Puls 2000). While ultraviolet or infrared CI can provide additional leverage in this regime, purely optical indices remain intrinsically insensitive and cannot deliver competitive precision for hot stars.
In this high-temperature regime, DDP exhibits its most distinctive behaviour. While the PIR–temperature relation flattens above 10 000 K, DDP does not encounter the intrinsic ceiling that limits CI in the Rayleigh–Jeans domain. As Table 2 shows, with six-pixel sampling, uncertainties of order ±1500 K can already be reached at S/N ∼210–750, and with eight pixels the requirement drops further to ∼150–540. These error bars are comparable to the subtype spacing in the B- and O-star scales (2000–3000 K). Crucially, because the P-PSF integrates information across the full bandpass, higher S/Ns continue to reduce the error: for ±1000 K precision, the required S/N remains finite, whereas CI ceases to provide meaningful constraints regardless of data quality. This makes DDP particularly relevant in resource-limited contexts – such as small satellites equipped with a single wide filter, or when re-analysing archival single-band imaging – where it can provide a practical route to distinguish, for example, early B from late O stars even in the absence of spectroscopic follow-up.
Notably, the S/N thresholds reported in Table 2 correspond to single-frame DDP measurements under photon-limited assumptions. For example, in the 5000–10 000 K range and for a representative sampling configuration of 4 pixels, achieving a temperature precision of 100 K requires S/N values of ∼800–2940. Taking a representative value of S/N ≍ 1000, this requirement refers to a single exposure. For comparison, Gaia DR3 reports typical effective temperature differences of order ∼110 K for well-characterised stars, depending strongly on data quality and stellar parameters (Andrae et al. 2023). These results are based on mission-averaged data typically combining ∼30–70 transits per source. Since S/N scales as  in the photon-noise regime, the accumulation of ∼30 independent exposures enhances the effective S/N by a factor of ~5.5 (and up to ~8 for N ∼ 70). Under equivalent accumulation, reaching a total S/N of ∼1000 would therefore require per-exposure S/N values of order ∼180 for N ∼ 30, or ∼120 for N ∼ 70. This implies that the S/N thresholds reported in Table 2, which correspond to single-frame estimates, effectively place DDP in a different practical S/N regime once realistic multi-epoch accumulation is considered, as the per-exposure S/N required to reach a given temperature precision decreases substantially under the
  photon-noise scaling. However, it should be emphasized that Gaia's performance at bright magnitudes reflects not only photon statistics but also calibration strategies and residual systematic effects refined over years of mission operations (Andrae et al. 2023). Likewise, a practical implementation of DDP would introduce its own instrumental and stability-related systematics (e.g., PSF stability and calibration). Therefore, the comparison presented here should be interpreted as a statistical photonefficiency comparison. Under equivalent accumulated photon budgets and in the photon-noise regime, DDP exhibits a comparable statistical potential in temperature precision, albeit with different observational and calibration trade-offs.
3.2 Exploratory test using ATLAS9 synthetic spectra
To assess the impact of realistic stellar spectral structure, we constructed an alternative P-PSF database using synthetic spectra from the ATLAS9 grid (log g = 4.0; (Castelli & Kurucz 2003)). The P-PSFs were computed for effective temperatures between 4000 K and 8000 K in steps of 250 K. All remaining simulation parameters were kept identical to those listed in Table 1.
Figure 9 presents the comparison between the blackbody approximation (left column) and the Castelli spectra (right column). The first row shows the peak-normalised spectra over the considered wavelength range. The second row displays the corresponding analytic P-PSFs, and the third row shows the pixel-integrated P-PSFs (representative case of four radial pixels). For clarity, only a narrow region near the airy peak is displayed, although the same qualitative behaviour persists across the full diffraction pattern.
Using this database, the monotonic ordering of the P-PSFs with temperature is preserved when realistic stellar spectra are used. The separation between neighbouring temperatures does not collapse and remains clearly distinguishable. In the interval considered here, the spacing between curves is in fact slightly larger in the Castelli case than in the blackbody approximation, as seen in both the analytic and pixel-integrated P-PSFs (rows two and three), which share identical vertical scaling within each row. This behaviour is consistent with the presence of temperature-dependent opacity structure in realistic spectra, which modifies the wavelength-dependent weighting entering the polychromatic integration.
Notably, the 4000–8000 K interval is shown as a representative example, as it includes the solar regime and provides clear visual separation between models. Similar qualitative behaviour was obtained in additional temperature intervals explored, including hotter stars, indicating that the effect is not restricted to this specific range.
A quantitative PIR recalculation is not performed for this exploratory test. The temperature sampling of the available synthetic grids (typically reaching ≥10 000 K at high temperatures) is too coarse to support a controlled noise propagation analysis and would artificially favour discrimination due to discrete model spacing. The objective of this section is therefore not to recalibrate the inversion framework, but to verify that the physical mechanism demonstrated under the blackbody assumption remains valid in the presence of realistic spectral structure.
We also verified the dependence of the P-PSF on stellar surface gravity using ATLAS9 synthetic spectra at fixed effective temperature (6000 K) and log g values between 0.0 and 5.0. Within the adopted bandpass and optical configuration, the corresponding analytic and pixel-integrated P-PSFs are nearly indistinguishable at the present sampling level. In particular, the monotonic temperature dependence described above is not affected by realistic gravity variations. This behaviour is consistent with the fact that surface gravity primarily modifies line profiles and pressure broadening effects, while the large-scale spectral energy distribution within the bandpass remains largely unchanged. Consequently, within the explored parameter space, the method shows negligible sensitivity to surface gravity compared to its temperature dependence.
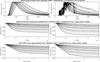 |
Fig. 9 Comparison between blackbody- and Castelli/ATLAS9-based P-PSFs for effective temperatures between 4000 K and 8000 K in steps of 250 K. Left column: blackbody approximation. Right column: castelli synthetic spectra (log g = 4.0). First row: peak-normalised spectra. Second row: analytic P-PSFs. Third row: pixel-integrated P-PSFs (four bins). Only a narrow region near the airy peak is displayed for clarity. |
4 Discussion
The results of this study indicate that DDP provides a promising approach to stellar temperature estimation by exploiting the temperature dependence of the spatial structure of the P-PSF. Our derivations and simulations show that PIR values change systematically with temperature, allowing the construction of a consistent mapping between P-PSF shape and effective temperature.
Several tendencies emerge from the simulations. First, the entrance pupil diameter has little impact on temperature retrieval, as the method depends primarily on the relative shape of the P-PSF rather than its absolute scale. In contrast, the sampling of the diffraction pattern is important: finer sampling generally reduces uncertainties. Second, although peripheral pixels are theoretically more sensitive to temperature changes, in the presence of noise the central pixels contribute most to the retrieval because of their higher signal levels. Finally, the spectral bandwidth influences the sensitivity of the method: broader passbands tend to increase the temperature-dependent contrast in the P-PSF, which can reduce the exposure times needed to reach a given precision.
In analogy with classical CI methods, the optimal wavelength range for DDP depends on the stellar temperature regime. In general, the most favourable bandpass is one that includes or approaches the spectral peak and samples regions of steep spectral slope. Thus, the optical domain is naturally well suited for solar-type stars, while extending toward the UV enhances sensitivity for hotter stars, and coverage toward the red or near-IR becomes advantageous for cooler stars. However, as demonstrated in Sect. 2.4, the precision of DDP improves as the spectral bandpass is broadened, owing to both increased photon statistics and the inclusion of a wider portion of the spectral energy distribution. This improvement holds as long as the additional spectral regions contribute significant temperature-dependent slope; in regimes where the spectrum approaches the Rayleigh–Jeans limit, the gain becomes primarily statistical rather than structural. Very broad bandpasses used in modern imaging systems therefore represent a promising configuration, as they capture a large fraction of the stellar flux within a single exposure while sampling an extended portion of the spectral energy distribution.
Nominally, traditional CI remain the more efficient approach for temperature determination whenever high-quality multi-band photometry is available. In such cases, CI delivers smaller uncertainties at lower S/N, and benefits from decades of empirical calibration across a broad range of stellar types. The DDP, by comparison and in the single-exposure framework considered here, requires a higher S/N to reach equivalent precision, and is therefore unlikely to displace CI under optimal observing conditions.
Nonetheless, DDP retains clear advantages in specific regimes. Because it extracts information from relative intensities within a single broadband exposure, it is less sensitive to time-dependent flux variations such as pulsations, eclipses, or instrumental drifts. It also removes the need for sequential filter changes or dispersive optics, simplifying instrument design and reducing operational overhead. Even if the formal S/N requirements derived here appear demanding, the method can still provide scientifically useful constraints when observations are restricted to a single passband – for example, in small satellite missions, archival imaging datasets, or rapid-cadence surveys. Since the approach relies only on diffraction, in principle it can be applied at any wavelength range where suitable detectors exist, not just in the optical. Moreover, DDP can complement existing multi-band surveys at essentially no additional cost: for very hot stars, where CI becomes intrinsically insensitive, the same broadband images already acquired for photometry can yield extra temperature information through diffraction analysis. In these contexts, uncertainties of a few hundred Kelvin remain sufficient to separate broad spectral classes (e.g. late G versus early A, or early B versus late O), and to identify hot stars. Thus, DDP is best viewed not as a competitor to CI, but as a complementary tool that extends temperature estimation capabilities to cases where traditional methods are limited.
In addition to the fact that the S/N thresholds reported in Table 2 are derived from single-frame DDP measurements, whereas typical CI-based temperature estimates often rely on multiple exposures or mission-averaged data products, a critical advantage of DDP emerges when comparing its efficiency against conventional CI methods under a fixed total photon budget. In CI, the available photons are split between two bands (either sequentially or across channels), so that – at fixed total observing time – each band receives roughly half the photons, reducing its S/N by a factor of  in the photon-noise regime. In addition, propagating two independent uncertainties into a CI introduces a further
  factor in the combined error. By contrast, DDP concentrates all photons into a single broadband exposure and does not incur this splitting penalty. Under photonlimited, non-saturated conditions, this implies that DDP can reach the S/N thresholds reported in Table 2 in approximately half the total integration time required by a two-band CI measurement. Equivalently, for a fixed observing time, higher S/N values are therefore more readily achievable than they may appear in DDP. This advantage is subject to detector saturation limits, which may require stacking shorter exposures in DDP. However, as long as the regime remains photon-noise dominated, the scaling
  ensures that the photon-efficiency argument remains valid. Consequently, the S/N requirements reported in Table 2 for DDP should be interpreted in this context when comparing against CI under identical observing constraints.
It is also important to emphasize that the simulations presented here were based on an arbitrary but realistic instrument design, loosely inspired by the TESS telescope. This configuration was not optimised for DDP and therefore does not highlight the technique's most favourable conditions. In principle, the method can benefit from deeper well capacities, higher detector bit depth, finer pixel sampling, or broader filter bandpasses. Moreover, only vertical and horizontal pixels were considered here for simplicity; including diagonal samples would provide additional high-signal pixels closer to the core, further improving performance. Also, detector-level strategies such as adjusting integration times, binning schemes, or readout cadence can further enhance precision (Zackay & Ofek 2017; Gasdia et al. 2017). Taken together, these considerations indicate that the S/N thresholds reported in this study should be regarded as conservative, with practical implementations likely to outperform the baseline case simulated here.
An additional strength of DDP is its potential for retrospective application to archival data, provided the instrument's optical response is well-characterised. In principle, retrospective application to archival broadband images is conceivable by modelling the system's P-PSF and implementing a centering algorithm. However, such an effort requires detailed knowledge of the instrument, including its pixel response function (PRF), filter behaviour, and detector characteristics – often inaccessible without direct collaboration with mission teams. Given the scope of this paper, we do not attempt a full implementation here, but we view this as a valuable direction for future validation efforts using space mission archives.
As demonstrated in Sect. 3.2, DDP is intrinsically modeldependent, in the same sense as classical CI techniques. The inversion requires internal consistency between the forward spectral model used to construct the P-PSF database and the object being analysed. The ATLAS9-based experiments confirm that realistic stellar spectral structure does not invalidate the physical mechanism, but a fully calibrated implementation across stellar parameter space would require systematic modelling and dedicated calibration efforts, analogous in spirit to those developed for colour–temperature relations. The present work establishes the physical basis and quantitative potential of the method; a comprehensive atmospheric calibration constitutes a dedicated extension beyond the scope of this paper.
Also, it is important to note that in this work, the PIR retrieval assumes an accurate estimation of the stellar centroid for clarity. However, this deserves a dedicated note. For centrosymmetric P-PSFs and symmetric region definitions, the firstorder sensitivity of the PIR to sub-pixel mis-centring vanishes (i.e., the gradient of the PIR with respect to the centroid offset is zero at the origin). In practice, small residual first-order terms may arise from pixel discretization or PRF effects, but these are strongly suppressed when symmetric sampling or azimuthal averaging is adopted. Consequently, centroiding uncertainties – which scale approximately as S/N−1, as implied by the Cramér– Rao bound for image location under Poisson noise (Lindegren 1978) – propagate into the PIR predominantly as a second-order perturbation, scaling approximately as S /N−2. This makes centroiding errors sub-dominant with respect to the direct photometric noise term (S /N−1) over the S/N regime explored in this work, except potentially in the highest-temperature range where the inversion becomes intrinsically more sensitive to small PIR perturbations.
Another potential limitation not addressed explicitly in this study is the presence of optical aberrations. However, unlike random noise or time-dependent distortions, static aberrations do not fundamentally hinder the technique. In practice, any implementation would rely on the PRF specific to the telescope in use, which naturally incorporates the effects of fixed optical imperfections (Anderson & King 2000). Since DDP operates on intensity ratios within the P-PSF, such aberrations affect all relevant pixels in a consistent way and can be calibrated out. This is especially true in space-based systems, where the PRF is stable and routinely characterised for precision photometry. As a result, adopting this technique would not require any hardware changes – only the integration of a dedicated calibration pipeline.
5 Conclusions
This work has introduced DDP as a complementary approach to stellar temperature estimation, based on the temperature dependence of the spatial structure of the P-PSF in broadband images. In the simulations presented here – loosely inspired by the TESS instrument design – the method requires somewhat higher S/N than traditional CI to reach equivalent precision, but the values remain within the range achievable by many current observing facilities. In addition, DDP shows particular promise for stars hotter than 10 000 K, where optical CI become intrinsically insensitive. The quoted S/N requirements should also be viewed as conservative, as they correspond to single-exposure DDP measurements under photon-limited assumptions. In practice, multi-epoch stacking would reduce the per-exposure S/N needed to reach a given temperature precision through the usual  scaling. Furthermore, the requirements could be significantly relaxed in optimised configurations, for example by adopting broader filters, finer pixel sampling, larger detector well capacities, or higher bit depth.
The main strength of DDP is that it extracts temperature information from a single broadband exposure, making it less sensitive to time-dependent flux variability and independent of sequential filter observations. This makes the method most relevant in situations where only one passband is available, such as small satellite missions, archival single-band datasets, or high-cadence monitoring where filter changes are impractical. Rather than competing with CI, the technique should therefore be regarded as complementary, extending temperature constraints to regimes where traditional methods face limitations. In this sense, it stands as a potentially useful addition to the observational toolkit. Therefore, the technique represents a practical advancement for small-space observatories: it can extract additional scientific value from the same photons, with minimal impact on observing time, cost, or payload complexity.
Acknowledgements
Sergio Bonaque-González has a postdoctoral contract “Viera y Clavijo” funded by the Agencia Canaria de Investigación, Innovación y Sociedad de la Información.
References
- Anderson, J., & King, I. R. 2000, PASP, 112, 1360 [NASA ADS] [CrossRef] [Google Scholar]
- Andrae, R., Fouesneau, M., Sordo, R., et al. 2023, A&A, 674, A27 [CrossRef] [EDP Sciences] [Google Scholar]
- Bessell, M. S. 2005, ARA&A, 43, 293 [Google Scholar]
- Bessell, M. S., Castelli, F., & Plez, B. 1998, A&A, 333, 231 [NASA ADS] [Google Scholar]
- Binney, J., & Merrifield, M. 1998, Galactic Astronomy (Princeton, NJ: Princeton University Press) [Google Scholar]
- Bonaque-González, S., de Miguel-Hernández, J., & Fernández, J. J. 2017, Scientific Reduction of Astronomical Images: Practical Examples for Students of Astrophysics (LAP LAMBERT Academic Publishing) [Google Scholar]
- Born, M., & Wolf, E. 2013, Principles of Optics: Electromagnetic Theory of Propagation, Interference and Diffraction of Light, 7th edn. (Elsevier) [Google Scholar]
- Cardelli, J. A., Clayton, G. C., & Mathis, J. S. 1989, ApJ, 345, 245 [Google Scholar]
- Casagrande, L., Ramírez, I., Meléndez, J., Bessell, M., & Asplund, M. 2010, A&A, 512, A54 [NASA ADS] [CrossRef] [EDP Sciences] [Google Scholar]
- Castelli, F., & Kurucz, R. L. 2003, in Modelling of Stellar Atmospheres, 210, A20 [NASA ADS] [Google Scholar]
- Chrisp, M., Clark, K., Primeau, B., Dalpiaz, M., & Lennon, J. 2015, in UV/Optical/IR Space Telescopes and Instruments: Innovative Technologies and Concepts VII, 9602 (SPIE), 96020H [Google Scholar]
- Claret, A. 2017, A&A, 600, A30 [NASA ADS] [CrossRef] [EDP Sciences] [Google Scholar]
- Draine, B. T. 2003, ARA&A, 41, 241 [Google Scholar]
- Evans, D. W., Riello, M., De Angeli, F., et al. 2018, A&A, 616, A4 [NASA ADS] [CrossRef] [EDP Sciences] [Google Scholar]
- Flower, P. J. 1996, ApJ, 469, 355 [NASA ADS] [CrossRef] [Google Scholar]
- Gasdia, F., Barjatya, A., & Bilardi, S. 2017, Sensors, 17, 1239 [Google Scholar]
- Golay, M. 2012, Astrophysics and Space Science Library, 41, Introduction to Astronomical Photometry (Springer) [Google Scholar]
- Gray, D. F. 2005, The Observation and Analysis of Stellar Photospheres, 3rd edn. (Cambridge University Press) [Google Scholar]
- Helvajian, H., & Janson, S. W. 2009, Small Satellites: Past, Present, and Future (American Institute of Aeronautics and Astronautics) [Google Scholar]
- Howell, S. B. 2000, Handbook of CCD Astronomy, 2 (Cambridge University Press) [Google Scholar]
- Kudritzki, R. P., & Puls, J. 2000, ARA&A, 38, 613 [Google Scholar]
- Liddle, J. D., Holt, A. P., Jason, S. J., O’Donnell, K. A., & Stevens, E. J. 2020, Nat. Astron., 4, 1026 [Google Scholar]
- Lindegren, L. 1978, in Modern Astrometry, 197 [Google Scholar]
- Martins, F., Schaerer, D., & Hillier, D. J. 2005, A&A, 436, 1049 [NASA ADS] [CrossRef] [EDP Sciences] [Google Scholar]
- Planck, M. 1914, The Theory of Heat Radiation (Philadelphia: P. Blakiston's Son & Co.) [Google Scholar]
- Prusti, T., de Bruijne, J. H. J., Brown, A. G. A., et al. 2016, A&A, 595, A1 [NASA ADS] [CrossRef] [EDP Sciences] [Google Scholar]
- Zackay, B., & Ofek, E. O. 2017, ApJ, 836, 187 [Google Scholar]
Appendix A Temperature estimation error as a function of S/N and pixel count
This appendix shows the temperature estimation error as a function of S/N for pixel configurations from two to eight pixels.
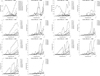 |
Fig. A.1 Average error in the estimation of temperature using two to eight pixels, across a range of S/N values. Each pixel configuration is represented with two panels: First is the case where the standard deviation exceeds σ > 1000 K at least at one temperature, and next to it is the case restricted to those S/Ns for which σ < 1000 K across the entire temperature range. |
All Tables
Summary of pixel sampling, objective standard deviation (σobj), and required signal-to-noise ratio (S/N) values for stellar temperature intervals considered in this study.
All Figures
|
Fig. 1 Comparison between a PSF (left) and a P-PSF constructed from RGB components as would be captured by a monochromatic camera (right), both displayed in logarithmic scale. The P-PSF appears wider and less contrasted due to the wavelength-dependent diffraction broadening. Lower panels show the corresponding radial intensity profiles, illustrating how spectral information is potentially encoded in the P-PSF shape. |
| In the text | |
|
Fig. 2 Normalised radial intensity profiles of P-PSFs for blackbodie with temperatures ranging from 1000 K to 40 000 K in steps of 2000 K computed for a 10.5 cm diameter aperture and a spectral range of [50 1000] nm. Only the right half of each P-PSF is shown after individual normalization. Each curve corresponds to a different temperature; the topmost curve represents the coolest star (1000 K), and each subsequent curve corresponds to a hotter star. No legend is included for clarity. |
| In the text | |
|
Fig. 3 Dependence of the PIR on temperature for different radial distances from the central peak. Each curve represents the PIR computed at 0.2 × 10⁻⁵, 0.4 × 10⁻⁵, 0.6 × 10⁻⁵, and 0.8 × 10⁻⁵ radians from the centre of the P-PSF. |
| In the text | |
|
Fig. 4 PIR difference between 40 000 K and 38 000 K as a function of radial distance, ranging from 0 to 0.8 × 10⁻⁵ radians, for a 10.5 cm pupil and a [500, 1000] nm bandwidth. |
| In the text | |
|
Fig. 5 Dependence of the PIR derivative at 0.6 × 10⁻⁵ radians ant 10.5 cm pupil on the filter bandwidth (BW). |
| In the text | |
|
Fig. 6 Dependence of the PIR derivative on the entrance pupil diameter at a fixed radial distance of 0.6 × 10⁻⁵ radians and a bandwidth of [500, 1000] nm. Each panel corresponds to a different pupil size: 8.5, 10.5, 11.5, and 12.5 cm. |
| In the text | |
|
Fig. 7 Temperature bias induced by interstellar extinction for PIR (solid line) and traditional colour index methods (dashed line), as a function of the true stellar temperature. |
| In the text | |
|
Fig. 8 Evolution of standard deviation in temperature estimation using two to eight pixels for the selected S/N values. |
| In the text | |
|
Fig. 9 Comparison between blackbody- and Castelli/ATLAS9-based P-PSFs for effective temperatures between 4000 K and 8000 K in steps of 250 K. Left column: blackbody approximation. Right column: castelli synthetic spectra (log g = 4.0). First row: peak-normalised spectra. Second row: analytic P-PSFs. Third row: pixel-integrated P-PSFs (four bins). Only a narrow region near the airy peak is displayed for clarity. |
| In the text | |
|
Fig. A.1 Average error in the estimation of temperature using two to eight pixels, across a range of S/N values. Each pixel configuration is represented with two panels: First is the case where the standard deviation exceeds σ > 1000 K at least at one temperature, and next to it is the case restricted to those S/Ns for which σ < 1000 K across the entire temperature range. |
| In the text | |
Current usage metrics show cumulative count of Article Views (full-text article views including HTML views, PDF and ePub downloads, according to the available data) and Abstracts Views on Vision4Press platform.
Data correspond to usage on the plateform after 2015. The current usage metrics is available 48-96 hours after online publication and is updated daily on week days.
Initial download of the metrics may take a while.