Fig. 2
Download original image
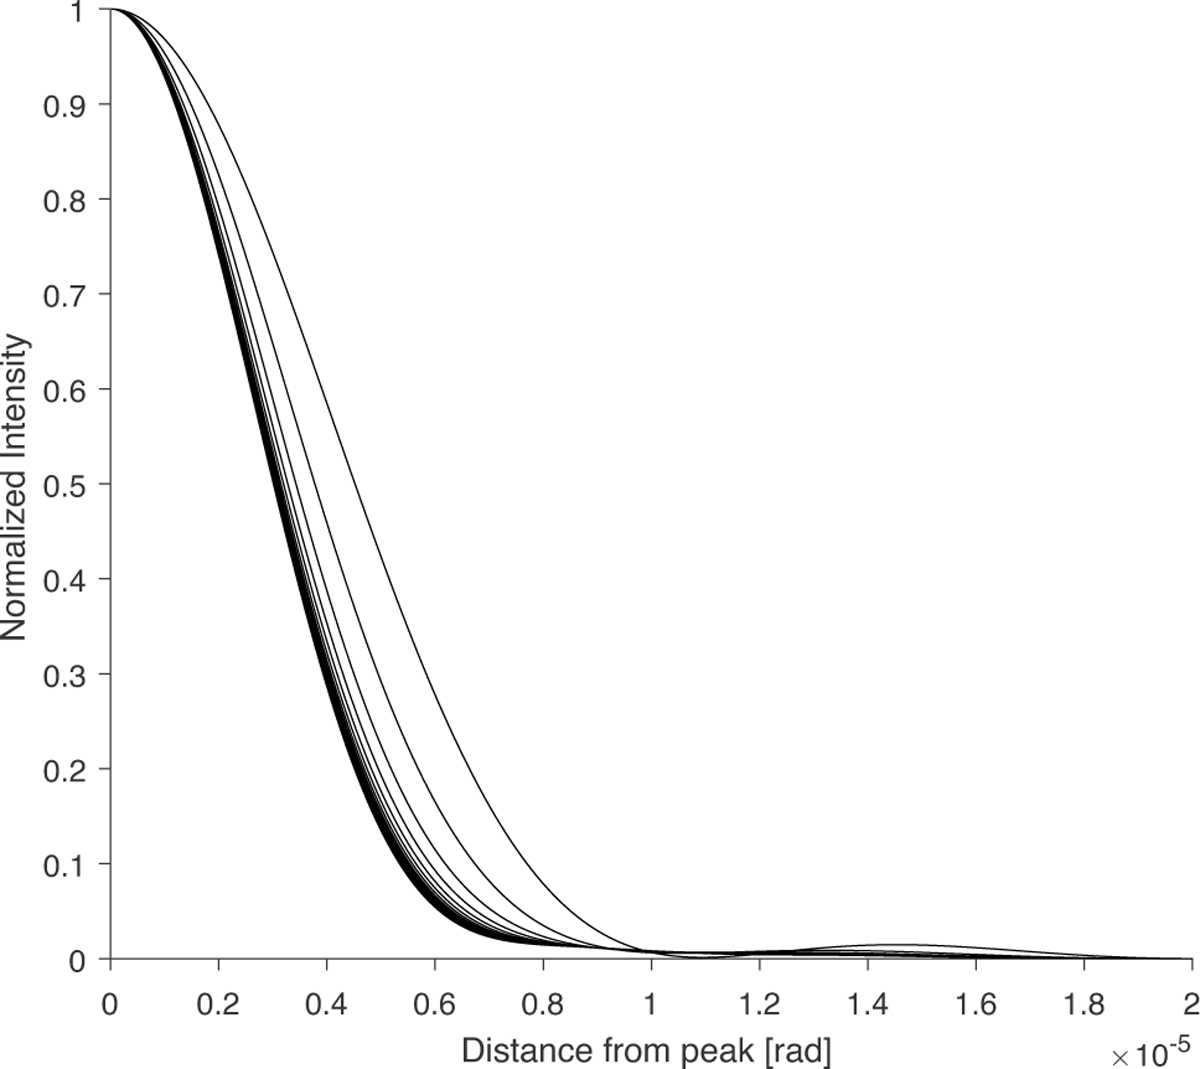
Normalised radial intensity profiles of P-PSFs for blackbodie with temperatures ranging from 1000 K to 40 000 K in steps of 2000 K computed for a 10.5 cm diameter aperture and a spectral range of [50 1000] nm. Only the right half of each P-PSF is shown after individual normalization. Each curve corresponds to a different temperature; the topmost curve represents the coolest star (1000 K), and each subsequent curve corresponds to a hotter star. No legend is included for clarity.
Current usage metrics show cumulative count of Article Views (full-text article views including HTML views, PDF and ePub downloads, according to the available data) and Abstracts Views on Vision4Press platform.
Data correspond to usage on the plateform after 2015. The current usage metrics is available 48-96 hours after online publication and is updated daily on week days.
Initial download of the metrics may take a while.