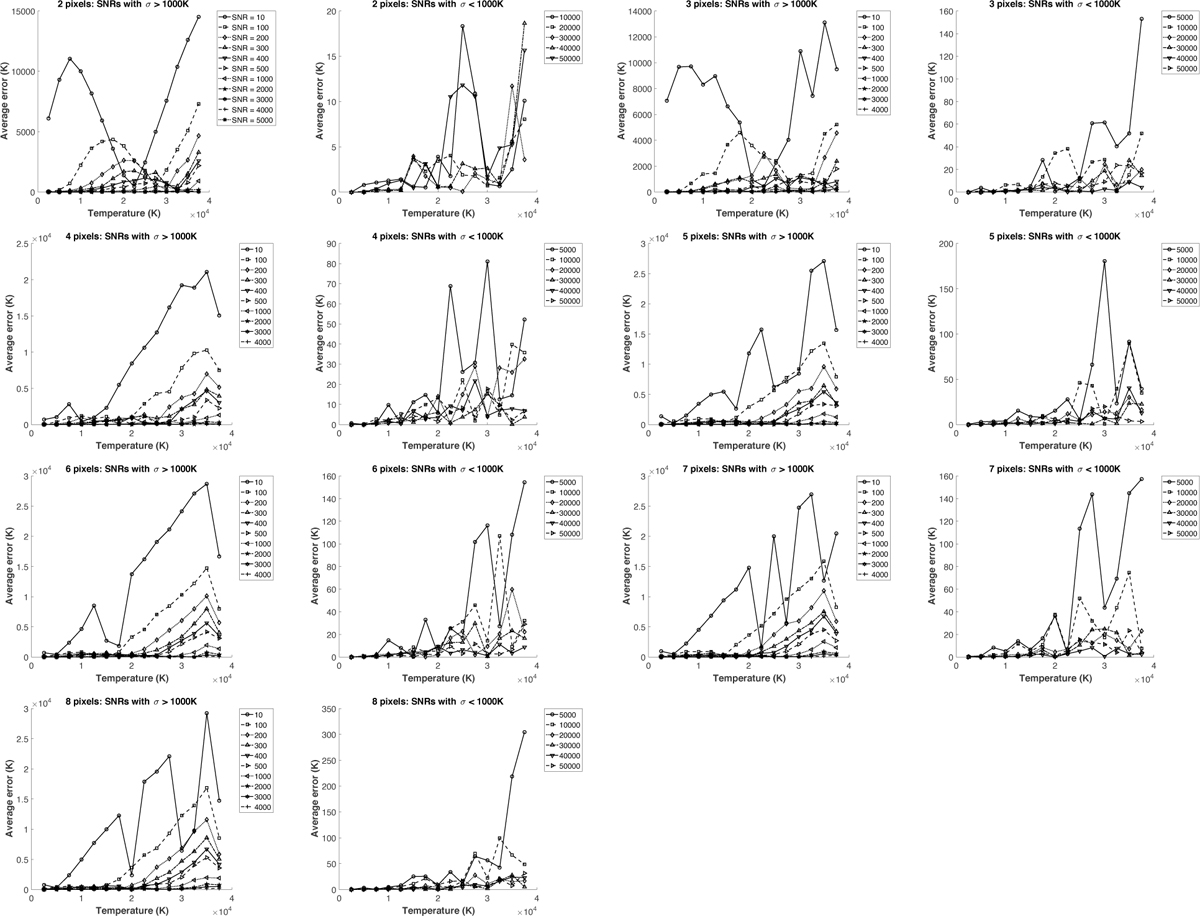
Fig. A.1
Download original image
Average error in the estimation of temperature using two to eight pixels, across a range of S/N values. Each pixel configuration is represented with two panels: First is the case where the standard deviation exceeds σ > 1000 K at least at one temperature, and next to it is the case restricted to those S/Ns for which σ < 1000 K across the entire temperature range.
Current usage metrics show cumulative count of Article Views (full-text article views including HTML views, PDF and ePub downloads, according to the available data) and Abstracts Views on Vision4Press platform.
Data correspond to usage on the plateform after 2015. The current usage metrics is available 48-96 hours after online publication and is updated daily on week days.
Initial download of the metrics may take a while.