| Issue |
A&A
Volume 700, August 2025
|
|
|---|---|---|
| Article Number | A21 | |
| Number of page(s) | 13 | |
| Section | Planets, planetary systems, and small bodies | |
| DOI | https://doi.org/10.1051/0004-6361/202555064 | |
| Published online | 29 July 2025 | |
Direct imaging discovery of a young giant planet orbiting on Solar System scales
1
Leiden Observatory, Leiden University,
Einsteinweg 55,
2333 CC
Leiden,
The Netherlands
2
Max Planck Institute for Astronomy,
Königstuhl 17,
69117
Heidelberg,
Germany
3
Department of Astrophysics/IMAPP, Radboud University,
Heyen-daalseweg 135,
6525 AJ
Nijmegen,
The Netherlands
4
European Southern Observatory,
Karl-Schwarzschild-Straße 2,
85748
Garching,
Germany
5
Department of Physics & Astronomy, Johns Hopkins University,
3400 N. Charles Street,
Baltimore,
MD
21218,
USA
6
Space Telescope Science Institute,
3700 San Martin Drive,
Baltimore,
MD
21218,
USA
7
LESIA, Observatoire de Paris, PSL, CNRS, Sorbonne Université, Université de Paris,
5 place Janssen,
92195
Meudon,
France
8
Department of Astrophysical & Planetary Sciences, JILA,
Duane Physics Bldg., 2000 Colorado Ave, University of Colorado,
Boulder,
CO
80309,
USA
9
Center for Interdisciplinary Exploration and Research in Astrophysics (CIERA) and Department of Physics and Astronomy, Northwestern University,
Evanston,
IL
60208,
USA
10
Institute of Astronomy, University of Cambridge,
Madingley Road,
Cambridge
CB3 0HA,
UK
11
Univ. Grenoble Alpes, CNRS, IPAG,
38000
Grenoble,
France
12
Academia Sinica, Institute of Astronomy and Astrophysics,
11F Astronomy-Mathematics Building, NTU/AS campus, No. 1, Section 4, Roosevelt Rd.,
Taipei
10617,
Taiwan
13
Anton Pannekoek Institute for Astronomy, University of Amsterdam,
Science Park 904,
1098 XH
Amsterdam,
The Netherlands
14
SRON Netherlands Institute for Space Research,
Sorbonnelaan 2,
3584 CA
Utrecht,
The Netherlands
15
Institute for Particle Physics and Astrophysics, ETH Zurich,
Wolfgang-Pauli-Strasse 27,
8093
Zurich,
Switzerland
16
Universidade de Lisboa - Faculdade de Ciências,
Campo Grande,
1749-016
Lisboa,
Portugal
17
CENTRA - Centro de Astrofísica e Gravitação, IST, Universidade de Lisboa,
1049-001
Lisboa,
Portugal
18
Max Planck Institute for extraterrestrial Physics,
Giessenbach-straße 1,
85748
Garching,
Germany
19
Université Côte d’Azur, Observatoire de la Côte d’Azur, CNRS, Laboratoire Lagrange,
Bd de l’Observatoire, CS 34229,
06304
Nice Cedex 4,
France
20
Aix Marseille Univ, CNRS, CNES, LAM,
Marseille,
France
21
STAR Institute, Université de Liège,
Allée du Six Août 19c,
4000
Liège,
Belgium
22
Institute of Physics, University of Cologne,
Zülpicher Straße 77,
50937
Cologne,
Germany
23
Max Planck Institute for Radio Astronomy,
Auf dem Hügel 69,
53121
Bonn,
Germany
24
Universidade do Porto, Faculdade de Engenharia, Rua Dr. Roberto Frias,
4200-465
Porto,
Portugal
25
School of Physics, University College Dublin,
Belfield,
Dublin 4,
Ireland
26
Astrophysics Group, Department of Physics & Astronomy, University of Exeter,
Stocker Road,
Exeter,
EX4 4QL,
UK
27
Departments of Physics and Astronomy, Le Conte Hall, University of California,
Berkeley,
CA
94720,
USA
28
European Southern Observatory,
Casilla
19001,
Santiago 19,
Chile
29
Advanced Concepts Team, European Space Agency, TEC-SF, ESTEC,
Keplerlaan 1, NL-2201,
AZ Noordwijk,
The Netherlands
30
University of Exeter,
Physics Building, Stocker Road,
Exeter
EX4 4QL,
UK
31
Fakultät für Physik, Universität Duisburg-Essen,
Lotharstraße 1,
47057
Duisburg,
Germany
32
Institüt für Astronomie und Astrophysik, Universität Tübingen,
Auf der Morgenstelle 10,
72076
Tübingen,
Germany
33
Astronomy Department, University of Michigan,
Ann Arbor,
MI
48109 USA
34
European Space Agency (ESA), ESA Office, Space Telescope Science Institute,
3700 San Martin Drive,
Baltimore,
MD
21218,
USA
35
Department of Earth & Planetary Sciences, Johns Hopkins University,
Baltimore,
MD,
USA
36
Max Planck Institute for Astrophysics,
Karl-Schwarzschild-Str. 1,
85741
Garching,
Germany
37
Excellence Cluster ORIGINS,
Boltzmannstraße 2,
85748
Garching bei München,
Germany
38
The Kavli Institute for Astronomy and Astrophysics, Peking University,
Beijing
100871,
PR China
★ Corresponding author.
Received:
7
April
2025
Accepted:
6
June
2025
Abstract
Context. HD 135344 AB is a young visual binary system that is best known for the protoplanetary disk around the secondary star. The circumstellar environment of the A0-type primary star, on the other hand, is already depleted. HD 135344 A is therefore an ideal target for the exploration of recently formed giant planets because it is not obscured by dust.
Aims. We searched for and characterized substellar companions to HD 135344 A down to separations of about 10 au.
Methods. We observed HD 135344 A with VLT/SPHERE in the H23 and K12 bands and obtained YJ and YJH spectroscopy. In addition, we carried out VLTI/GRAVITY observations for the further astrometric and spectroscopic confirmation of a detected companion.
Results. We discovered a close-in young giant planet, HD 135344 Ab, with a mass of about 10 MJ. The multi-epoch astrometry confirms the bound nature based on common parallax and common proper motion. This firmly rules out the scenario of a non-stationary background star. The semi-major axis of the planetary orbit is approximately 15-20 au, and the photometry is consistent with that of a mid L-type object. The inferred atmospheric and bulk parameters further confirm the young and planetary nature of the companion.
Conclusions. HD 135344 Ab is one of the youngest directly imaged planets that has fully formed and orbits on Solar System scales. It is a valuable target for studying the early evolution and atmosphere of a giant planet that could have formed in the vicinity of the snowline.
Key words: techniques: high angular resolution / planets and satellites: detection / planets and satellites: gaseous planets / stars: individual: HD 135344 A
© The Authors 2025
 Open Access article, published by EDP Sciences, under the terms of the Creative Commons Attribution License (https://creativecommons.org/licenses/by/4.0), which permits unrestricted use, distribution, and reproduction in any medium, provided the original work is properly cited.
This article is published in open access under the Subscribe to Open model. This email address is being protected from spambots. You need JavaScript enabled to view it. to support open access publication.
1 Introduction
HD 135344 AB is a visual binary system that is located in Upper Centaurus Lupus (UCL) region of the Sco-Cen OB association. The secondary F4-type star, HD 135344 B, has been studied for several decades because of its prominent IR excess. During more recent years, the protoplanetary disk was spatially resolved and revealed a central cavity (Brown et al. 2009; Garufi et al. 2013), spiral arms (Muto et al. 2012), and variable shadowing by the inner disk (Stolker et al. 2017). These disk features might indicate planet-disk interactions, but the suspected planets have remained hidden (e.g., Maire et al. 2017; Cugno et al. 2024).
While planet formation appears to be ongoing at HD 135344 B, the circumstellar environment of the A0-type primary star, HD 135344 A, is already largely depleted, given the absence of strong IR excess in the spectral energy distribution (SED). HD 135344 A and B are proper-motion binary partners (Mason et al. 2001) with an angular separation of 21″.2 (≈2800 au), and their circumstellar disks have therefore likely evolved independently, depending on the eccentricity of the orbits. We note that the secondary star has incorrectly been referred to as HD 135344 in some cases, although the issue had already been pointed out by Coulson & Walther (1995).
The two stars in the HD 135344 AB binary system are expected to be coeval. The pre-main-sequence age of the secondary star can therefore be adopted as the age of the main-sequence primary star. Garufi et al. (2018) inferred an age of  Myr for HD 135344 B by using stellar evolutionary tracks and the Gaia parallax. In addition to the young age, giant planets on wide orbits are most commonly detected around intermediate-mass stars (e.g., Nielsen et al. 2019; Vigan et al. 2021). The youth, spectral type, and dust-depleted environment make HD 135344 A an excellent target to search for young giant planets.
We report high-contrast imaging observations with which we explore the circumstellar environment of HD 135344 A for the first time. We discovered a young giant planet that we confirmed through a detailed astrometric and spectral analysis. The evidence for the bound and planetary nature accumulated based on the observations and results. For simplicity, we refer to the discovered source as HD 135344 Ab from here on.
Observation details.
2 Observations and data reduction
2.1 VLT/SPHERE high-contrast imaging
HD 135344 A was observed with VLT/SPHERE (Beuzit et al. 2019) on the nights of 2019 May 8, 2019 July 5, 2021 July 16, and 2022 May 3. The first observations were carried out with the IRDIFS mode so that we could benefit from the highest angular resolution. We used the IRDIS dual-band camera with the H23 filters (Dohlen et al. 2008; Vigan et al. 2010), and we obtained a low-resolution YJ spectrum (R ≈ 50) with IFS (Claudi et al. 2008). The first observation, which led to the discovery, did not fully meet the requested conditions (and hence, it was repeated in July), but the quality was sufficient for a robust detection. We then repeated the observation in 2021 to confirm the source at the same wavelength. In 2022, we used the IRDIFS_EXT mode to obtain K 12 dual-band imaging and a low-resolution YJH spectrum (R ≈ 30).
The integration times and observing conditions are listed in Table 1. We used deep exposures with a detector integration time (DIT) of 48 and 64 seconds for the simultaneous IRDIS and IFS measurements, respectively, in 2019. After we detected the source at a small separation, we decided to change the observing strategy. Specifically, we used a DIT of 4 and 6 seconds for IRDIS and IFS, respectively, to sample the speckle variation on a faster timescale, which is beneficial for the post-processing. We also left the satellite spots on throughout the observations to enable a more accurate centering and flux calibration.
The IRDIS and IFS data were reduced with vlt-sphere1 (Vigan 2020), which provides a Python wrapper for the EsoRex recipes. It also applies a recalibration of the IFS wavelength solution, and it centers the coronagraphic frames based on the satellite spots. We post-processed the IRDIS data with PynPoint2 by applying full-frame principal component analysis (PCA) to subtract the stellar halo and speckles (Amara & Quanz 2012; Stolker et al. 2019). For the astrometric and photometric measurements, we followed the procedure outlined by Stolker et al. (2020), which corrects for self-subtraction and includes the systematic uncertainty in the error budget. The extracted fluxes were corrected for the coronagraph throughput, which ranged from 97% to 93% as the separation of the planet decreased.
The IFS data were post-processed with TRAP3, which specifically is a more powerful detection and calibration technique for sources at small separation because systematics are modeled in the temporal instead of the spatial domain (Samland et al. 2021). We analyzed the YJ and YJH spectra from 2021 and 2022, respectively, because these datasets were obtained with continuous satellite spots. Similar to the IRDIS data, the amplitudes of the spots were used to identify low-quality frames and their temporal variation was accounted for in the spectral extraction. The wavelength-averaged S/N of the discovered source is 2.9 and 1.5 for the YJ and YJH spectra, respectively. The higher S/N of the YJ spectrum might be due to the better seeing conditions.
The contrasts were converted into magnitudes and fluxes by using a synthetic stellar spectrum and a flux-calibrated spectrum of Vega (Bohlin et al. 2014). Table A.1 in Appendix A lists the inferred stellar parameters and the synthetic magnitudes of HD 135344 A in the IRDIS filters that were computed from the posterior distributions. The synthetic IFS spectrum of HD 135344 A was extracted by sampling random spectra from the posterior, smoothing them to R = 30, and rebinning to the wavelength solution of the instrument.
2.2 VLTI/GRAVITY dual-field interferometry
The system was also observed with the four unit telescopes (UTs) of VLTI/GRAVITY on the nights of 2022 July 19, 2023 May 8, and 2023 July 1 (see Table 1). GRAVITY provides exquisite astrometric precision for directly imaged planets and medium-resolution (R ≈ 500) K-band spectroscopy (GRAVITY Collaboration 2017). We used the dual-field on-axis mode with the fringe-tracking fiber centered on the star and the science fiber alternating between the star and planet. This strategy enables referencing and accurate calibration of the interferometric visibilities (GRAVITY Collaboration 2020; Lacour et al. 2020). For the third observation, we benefitted from the recently commissioned faint mode, which turns the metrology lasers off during the science exposures. This yields a detection with a higher S/N of faint companions (Widmann et al. 2022).
Standard data reduction procedures were applied with the run_gravi_reduce script4 that calls the EsoRex recipes. We then used the exoGravity5 pipeline for phase referencing, subtracting the stellar component from the visibilities, and extracting the astrometry and spectrum (GRAVITY Collaboration 2019, 2020; Nowak et al. 2020). After calibrating the full datasets, we excluded the baselines of UT3 from the 2023 May data because of an issue with the metrology. The wavelength-averaged S/N of the spectra of the discovered source is 1.1, 2.6, and 5.0 (in chronological order). We only included the GRAVITY spectrum from 2023 July in the analysis because a covariance-weighted combination with the other two spectra did not improve the S/N, in particular, because the systematics in these two spectra are stronger. Similar to the IFS flux calibration, we used a synthetic spectrum to convert the contrast spectrum into fluxes while taking the uncertainties on the stellar spectrum into account.
3 Results
3.1 Direct detection of a young giant planet
The residuals of the PSF subtraction from the imaging observations with SPHERE are shown in Fig. 1. In 2019, we detected an off-axis point source, HD 135344 Ab, which is located west of the star at an approximate separation of 4λ/D in H23. In 2021, the source was detected again, but at a somewhat smaller separation, and in 2022, it was also detected with the K 12 filters. The PSF shape is typical for a post-processed point source. The negative lobes are due to the inherent self-subtraction effect by angular differential imaging (ADI). The source clearly stands out against the fainter speckle field in the background and is detected with S/N ≈ 10 in all IRDIS imaging data. We did not detect extended emission in the data, indicating that the circumstellar environment is indeed depleted in small dust. A feature is also visible in the IRDIS image from 2019 May in the eastward direction, at a separation of 2.5λ/D from the star. It appears to be noisier than HD 135344 Ab and self-subtracts more quickly with an increasing number of components. Two months later, it was no longer detected, suggesting it was likely a speckle residual, as neither a background star nor a planet could have moved enough to become obscured by the coronagraph.
The SPHERE data were not fully conclusive for a confirmation that the discovered source was bound to HD 135344 A. We therefore decided to follow it up with the GRAVITY instrument. Figure 2 shows the detection maps of the GRAVITY observations. The planet is clearly detected in all datasets. We adopted the feature with the highest Δχ2 as the position of the planet, and the contrast spectrum was also extracted at this position. The pattern and elongated shapes in the detection maps depend on the coverage of the (u, v) plane (i.e., the UT baselines and field rotation). For the observation in 2022, the pointing of the fiber was 13.5 mas south of the actual location of the planet, which resulted in a fiber coupling efficiency of 0.89. For the other two observations, the fiber position was (almost) spot-on with the planet due to the improved orbital constraint.
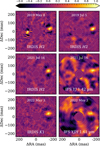 |
Fig. 1 Detections of HD 135344 Ab with VLT/SPHERE. For IRDIS, the images show the residuals from the PSF subtraction for one of the dual-band filters. For IFS, the images show the detection maps for one of the wavelength channels. The planet is seen in westward direction (i.e., toward the right). The color scale is linear and normalized to the brightest pixel in each image. The dotted circles indicate the separation from the central star in integer multiples of λ/D. The night of the observation is given in each panel. |
3.2 Relative astrometry: Planet or background star?
HD 135344 AB is located in the Sco-Cen OB association, which is close to the direction of the Galactic center. There are typically several, if not many, background sources in the 12″ × 12″ field of view of the IRDIS camera. In addition to the inner source identified in Sect. 3.1, we detected four more sources. We extracted their astrometry by directly fitting a 2D Gaussian model to the sources in the derotated frames.
The astrometric measurements of HD 135344 Ab are listed in Table 2 and are shown in Fig. 3 together with the suspected background sources. This figure displays the astrometry relative to the first epoch and shows that the planet moves mostly eastward, whereas the background sources move northeast. The direction of the background sources matches the stationary track, but it shows that the proper motions of the background sources are not negligible. This is also seen in the sample of Gaia sources, from which we adopted the proper motions to create a sample of non-stationary background stars.
From this comparison, we conclude that the relative astrometry of the IRDIS background sources is approximately consistent with the population of Gaia sources. We did not take differences in the parallax into account, which we expect to be the reason that the IRDIS background sources do not match the bulk of the Gaia sources exactly. There might also be systematics in the astrometry, such as the true north uncertainty, which affects sources far from the on-axis science target more strongly.
The planet appears to move distinctly from the background sources, although somewhat in the same direction. This initially seemed suspicious. For the last epoch, the simulated positions of the bulk of the Gaia sources differ by more than 100 mas from the position of the planet. The sample includes however a few outliers for which the magnitude and direction of the proper motions are similar to HD 135344 A. This yields a probability of ≈0.1% that the putative planet instead is a background star with an unusually high proper motion. It is important to consider and rule out a peculiar proper motion scenario, as was shown by Nielsen et al. (2017) for the case of HD 131399 A.
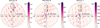 |
Fig. 2 Detections of HD 135344 AB with VLTI/GRAVITY. The color scale of the detection maps shows |

Astrometry of HD 135344 Ab.
3.3 Ruling out a non-stationary background star
The analysis in Sect. 3.2 showed that the astrometric measurements are difficult to explain with a background star. In this section, we statistically explore the scenario of a background (or foreground) object by fitting the relative astrometry of HD 135344 Ab with a non-stationary background model. We used backtracks6 (Balmer et al. 2025) to determine the coordinates, proper motion, and parallax that best describe the astrometry as a background object. The code uses dynamic nested sampling with the dynesty package (Speagle 2020) to estimate the parameter posteriors. At the start, the Gaia catalog is queried for the parallaxes and proper motions of sources within a window of 0.2 deg centered on HD 135344 A, and these are used as priors with the Bayesian inference, ϖGaia = 0.4 ± 0.8 mas, μRA,Gaia = −5.1 ± 5.6 mas yr−1, and μDec,Gaia = −3.8 ± 4.2 mas yr−1. We note that a similar sample was used for the proper motions applied in Fig. 3.
Figure 4 shows a random selection of posterior background tracks in comparison with the astrometry. The tracks are close to linear because the inferred parallax,  mas, of the modeled background source is consistent with the parallax of HD 135344 Ab, ϖ* = 7.41 ± 0.04 mas. This result is in particular driven by the linear displacement of the GRAVITY astrometry, which was obtained about two months apart. Specifically, the high-precision measurements rule out a helix shape due to a heliocentric parallax of a background star. This is the first confirmation of a directly imaged planet by a common parallax to our knowledge.
The retrieved proper motion, μRA = −9.0 ± 0.1 and μDec = −22.9 ± 0.1 mas yr−1, further confirms that the object is comoving with HD 135344 A. While μRA is consistent with the prior distribution from Gaia, which is also shown in Fig. 3, μDec, on the other hand, is a 4.5σ outlier with respect to the Gaia sources. Therefore, the analysis shows that the object is most consistent with the proper motion of HD 135344 A. The difference is attributed to the orbital motion, which is approximately linear in the eastward direction. The background fit used the proper motion parameter to mimic the orbital movement, which caused the difference in particular to the RA component of the stellar proper motion, μRA,* = −18.74 ± 0.05 mas yr−1 and μDec,* = −24.01 ± 0.04 mas yr−1 (Gaia Collaboration 2023).
To further quantify the significance, we list in Table 3 the Bayesian evidence (i.e., the marginalized likelihood), ln Z, for three cases of the background fit. For the stationary model, we fixed the parallax and proper motion to zero. The parameter estimation informed by the Gaia priors is the fit that we described earlier in this section. For comparison, loosening the priors to uniform distributions increases ln Z because the measurements did not match the bulk of the Gaia sample. Instead, as we describe in the next section in more detail, the Bayes factor of the model comparison between the orbit and background fit is Δ ln Z ≥ 30. We therefore conclude that the evidence is strong that the source is comoving with and orbiting HD 135344 A.
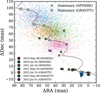 |
Fig. 3 Astrometric measurements relative to the first epoch. The crosses show the positions of HD 135344 Ab, which moves eastward. The colored circles show the positions of the suspected background sources in the IRDIS field of view, which are connected with dotted lines between epochs. The dashed line shows the track for a stationary background source, and the gray circles and squares indicate the three SPHERE and three GRAVITY epochs, respectively, after the initial detection. The small dots represent a sample of Gaia sources within 0.1 deg from HD 135344 A (see main text for details). The colors indicate a specific epoch, for example, all pink markers correspond to 2021 Jul. 16. |
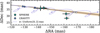 |
Fig. 4 Background fit of the relative astrometry. The figure shows 200 randomly drawn background tracks from the posterior. The track calculated from the median parameters is shown as the solid gray line. The astrometric measurements are shown with colored markers, and their respective epochs of the best-fit model are shown with gray markers. For comparison, the dashed blue line shows the best-fit model for a parallax prior that forces the source to the background (≥500 pc). |
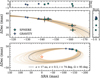 |
Fig. 5 Orbit fit of the relative astrometry. The bottom panel shows the full orbits, and the top panel shows a zoom of the observation epochs. Both panels show the same 200 orbit samples that were randomly drawn from the posterior. The orbit with the highest likelihood is shown as the solid gray line, and the residuals of the best fit are normalized by the data uncertainties. The astrometric measurements are shown with colored markers, and their respective epochs of the best-fit model are shown with gray markers and are connected with dotted lines. The planet moves in counterclockwise direction. |
Bayesian evidence.
3.4 Orbital analysis
The discovered planet shows clear orbital movement, possibly even with a slight curvature. We therefore carried out a fit with orbitize!7 (Blunt et al. 2020) to infer its orbital elements. The posterior distributions were sampled with the nested sampling algorithm from MultiNest (Feroz & Hobson 2008; Buchner et al. 2014) while marginalizing over the parallax and system mass (see Table A.1). We used 2000 live points and restricted the priors on the argument of periastron, ω, and longitude of the ascending node, Ω, to one of the two solutions.
Figure 5 shows the posterior orbits, and the credible regions are provide in Table 5. We retrieved a semi-major axis of  au, which corresponds to a period of
  yr. The eccentricity is hardly constrained and is negatively correlated with the inclination, which is a common outcome of fitting astrometry that covers a small fraction of the orbit (Ferrer-Chávez et al. 2021). This is also shown in Fig. 5: circular orbits are symmetric with respect to the star, whereas eccentric orbits have a smaller periastron. The orientation of the orbit on the sky is set by the inclination, i ≈ 74 deg, and the longitude of the ascending node, Ω ≈ 95 deg. Since we only fit relative astrometry, there is a second solution for Ω and ω with a difference of ≈180 deg.
Photometry of HD135344Ab.
3.5 Photometric analysis
The contrast measurements and calibrated photometry are listed in Table 4 as magnitudes and fluxes. The dual-band imaging with SPHERE in the H23 and K12 bands enabled a photometric characterization of the planet, for which we adopted the magnitudes from 2021 and 2022 because these data were obtained with a dedicated strategy for an optimized accuracy of the flux calibration (see Sect. 2.1). Figure 6 shows a color-magnitude diagram that was created with the species8 toolkit (see Stolker et al. 2020 for details). In the figure, HD 135344 Ab is compared with late-type field objects, other directly imaged companions, and synthetic photometry from models. The isochrones that were used to calculate the synthetic fluxes were interpolated from the AMES-Cond and AMES-Dusty grids. These are evolutionary models with a cloudless and a cloudy atmosphere, respectively, as the boundary condition for the interior structure (Chabrier et al. 2000; Allard et al. 2001; Baraffe et al. 2003).
The absolute flux and color of HD 13534 Ab are consistent with the field objects that have a mid-L spectral type. The photospheric temperature of L-type giant planets and brown dwarfs allows for the condensation of refractory species, and their dusty atmospheres therefore cause a red photometric appearance compared to cloudless atmospheres. The atmospheric reddening by clouds is typically stronger for young objects because their surface gravity is lower (e.g., HIP 65426 b; Chauvin et al. 2017). The H2-K1 color of HD 135344Ab is not unusually red and consistent with the field objects, although it is in particular similar to the reddest objects of that sample. At an age of 12 Myr, the H2 luminosity of HD 135344 Ab is consistent with a planetary-mass object of ≈10 MJ. We provide a statistical inference of the planetary mass in Sect. 3.7.
3.6 Atmospheric modeling
The spectral appearance and inferred atmospheric parameters provide further insight into the nature of HD 135344 Ab. We compiled the near-infrared SED in Fig. 7 by combining the SPHERE and GRAVITY data. We used the Bayesian framework of the species toolkit (Stolker et al. 2020) to fit the data with an atmospheric model, specifically, by interpolating a grid of synthetic spectra from Sonora Diamondback (Morley et al. 2024). This is a radiative-convective equilibrium model that accounts for the condensation of refractory species into cloud particles. The vertical density profile of the cloud deck is parameterized by the sedimentation efficiency, fsed. The model uses chemical equilibrium, which is a reasonable assumption in the temperature regime of HD 135344 Ab, where CO will be the dominant carbon-bearing species. The parameters were estimated with the nested sampling algorithm from MultiNest (Feroz & Hobson 2008; Buchner et al. 2014), using 2000 live points and accounting for the spectral covariances.
The photometry and spectra are compared with the best-fit model spectrum in Fig. 7, which has a goodness-of-fit statistic of  . The IFS spectra have a low S/N (see Sect. 2.1), but the broad H2O absorption feature between the J and H bands is visible in the YJH spectrum. The GRAVITY spectrum also shows slopes in the pseudo-continuum that are expected to be caused by H2O opacities. The CO bandheads might tentatively be detected in the K band, but the GRAVITY spectrum also shows correlated noise that appears with a frequency and amplitude that might mimic the CO bands. The initial residuals indeed showed that the systematics were not fully accounted for by the covariances, and we therefore fit an uncertainty inflation for the GRAVITY spectrum. This yielded a 10 ± 2% increase relative to the model fluxes. From the photometry, the H3 flux of the first epoch is in particular discrepant with the best-fit model, possibly due to the poorer observing conditions and because continuous satellite spots for the calibration were lacking (see Sect. 2.1).
The inferred parameters are listed in Table 5. The temperature, Teff ≈ 1510 K, is consistent with a mid L-type object, as empirically estimated from the H2 brightness in Fig. 6. The surface gravity, log g, and metallicity, [M/H], are challenging to constrain from the low-resolution spectra because this requires a highly accurate calibration, while the parameters might easily be biased otherwise. We therefore adopted the constraint from the evolution fit, log g = 4.1 ± 0.1 (see Sect. 3.7), as the normal prior for the atmospheric fit. The likelihood of the metallicity peaked at the supersolar edge of the model grid, but the data are also consistent with the solar abundances. The low sedimentation parameter clearly favors a dusty atmosphere, while we can rule out an atmosphere with strongly settled clouds. When we repeated the fit with a fixed sedimentation parameter of fsed = 8, this resulted in a Bayes factor of Δ ln Z = 43 relative to the model in which fsed was a free parameter.
From the Teff and Rp posterior posterior, we computed the bolometric luminosity, log L/L⊙ = −3.9 ± 0.1. We note that the statistical uncertainty on the luminosity was only ≈0.01 dex, and we therefore reran the spectral fit using five other cloudy models: Exo-REM (Charnay et al. 2018), petitCODE (Mollière et al. 2015), DRIFT-PHOENIX (Helling et al. 2008), BT-Settl (Allard et al. 2012), and AMES-Dusty (Allard et al. 2001). The dispersion on the retrieved luminosity, Δ log L/L⊙ ≈ 0.1 dex, was adopted as the approximate systematic uncertainty. In the next section, we use the luminosity to quantify the mass of the planet.
Planet parameters of HD 135344 Ab.
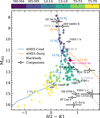 |
Fig. 6 Color-magnitude diagram of MH2 vs. H2 - K1. The field objects are color-coded by M, L, and T spectral types, and the directly imaged companions are labeled individually. HD 135344 Ab is highlighted with a pink cross. The blue and orange lines show the synthetic colors computed from the AMES-Cond and AMES-Dusty evolutionary tracks at an age of 12 Myr. Blackbody emission is shown for an object with a radius of 1 RJ (dashed gray line). |
3.7 Bulk parameters and evolutionary constraints
In Sect. 3.5 we showed that the H-band luminosity of HD 135344 Ab is consistent with a dusty mid L-type object with an approximate mass of 10 MJ. We now quantify the mass and other bulk parameters using the species toolkit. To do this, we fit the bolometric luminosity, log L/L⊙ = −3.9 ± 0.1, which we inferred from the atmospheric modeling, with a grid of evolutionary tracks that we interpolated as function of mass and age. The age of the system was applied as asymmetric normal prior by adopting the pre-main-sequence age of HD 135344 B,  Myr (Garufi et al. 2018). Similar to the spectral fit, a main limitation here are non-linear variations in the model grid, which can lead to inaccuracies and underestimated uncertainties. For the fit, we used the ATMO model (Phillips et al. 2020) because the cooling tracks seemed to be reasonably spaced for interpolation. The parameters were estimated with MultiNest (Feroz & Hobson 2008; Buchner et al. 2014) by sampling the posterior distributions with 1000 live points.
The mass and evolutionary constraints are presented in Fig. 8, which shows the isochrones and cooling tracks that describe the luminosity and age of HD 135344 Ab. We inferred a mass of Mp ≈ 10 MJ, and the age is consistent with the prior, but is slightly more constrained (see Table 5). After the fit, we interpolated the evolutionary grid again for each mass-age sample in order to extract the related temperature, Teff ≈ 1585, surface gravity, log g ≈ 4.1, and radius, Rp ≈ 1.5. Table 5 shows that the inferred bulk parameters are consistent within the considered credible regions with the parameter values estimated with the spectral modeling in Sect. 3.6. This suggests that the results are robust because we used two different, although correlated, approaches. The exception is the radius, which differs by 2σ between the atmospheric and the evolution fit.
4 Discussion and conclusions
We have reported the direct discovery of a young giant planet at the A0V-type star HD 135344 A. The planet was detected through high-contrast imaging and interferometric observations. Our astrometric analysis of seven datasets, with a total baseline of four years, showed that the object is comoving with the central star. This was confirmed both by a common parallax and common proper motion. The inferred atmospheric and bulk parameters indicate a planetary nature, with a model-dependent mass of Mp ≈ 10 MJ. The planet position changed by ≈30 mas and is slightly curved, which yielded a constraint on the orbital semi-major axis of approximately 15-20 au.
When we adopt the pre-main-sequence age of ≈12 Myr from the secondary star, HD 135344 Ab might be the youngest directly imaged planet that has fully formed and orbits on Solar System scales. Figure 9 shows a comparison with the ages and semi-major axes of other close-in directly imaged planets. Young directly imaged planets at small separations (≲100 au) have only been detected at intermediate-mass stars. The planets in Fig. 9 all orbit A- and F-type stars, and the discovery of HD 135344 Ab at an A0-type star therefore follows that trend. This contrasts young planetary-mass objects on wide orbits (≳100 au), which are typically found at late-type stars (e.g., Bowler et al. 2014). Because the orbit of HD 135344 Ab is relatively small, this planetary-mass companion is expected to have formed in a protoplanetary disk and is likely not the low-mass tail of binary star formation. The current planet location might be in the vicinity of the approximate snowline location for the spectral type of the host star (see Fig. 9), although the planet may have migrated during its formation phase.
In addition to the age constraint from HD 135344 B, Ratzenböck et al. (2023) recently used a clustering algorithm to map the star formation history of Sco-Cen. HD 135344 AB was associated with the φ Lup group in UCL, for which an isochrone age of ≈10 and ≈17 Myr was determined with two evolutionary models. An age of 10 Myr would match the pre-main-sequence age of HD 135344 B. Arguably, it is also be more consistent with the high IR excess of the secondary star, because it would be (even more) puzzling if a dust-rich disk were maintained up to 17 Myr. If the system were to be ≈ 17 Myr old, then the planet mass would still be in the planetary regime, Mp ≈ 12 MJ, but close to the deuterium-burning limit.
In contrast to the secondary star, the circumstellar environment of HD 135344 A is already depleted, given the minor IR excess (see Appendix A). This is also consistent with a nondetection of a disk in scattered light in the SPHERE imagery. The origin of the different disk evolution timescales of the primary and secondary star is not known, but it might be related to a more efficient photoevaporation by the stronger radiation field of HD 135344 A. Disk lifetimes are indeed known to increase toward later spectral types (e.g., Luhman 2022). During the early evolution of the system, the primary star likely was a Herbig Ae star with a protoplanetary disk in which HD 135344 Ab would have carved a wide gap during its formation. Dust- and gas-depleted cavities and gaps are quite common at Herbig Ae stars (e.g., van der Marel & Mulders 2021). These resolved substructures are signposts for forming planets, but only a few gap-carving planets have been detected (e.g., PDS 70 b/c; Keppler et al. 2018; Haffert et al. 2019). The discovery of close-in directly imaged planets such as HD 135344 Ab shows that Jovian planets might indeed have caused at least some of the large cavities. They might be more difficult to detect during formation because the dust has not yet been dispersed because even cavities are not fully cleared from small dust.
HD 135344 Ab is an appealing target for a spectral characterization with the next generation of large ground-based telescope facilities (e.g., Brandl et al. 2010) because of its small angular and physical separation from the star. The quality of the current measurements was sufficient to identify H2O absorption in the low-resolution spectra and to infer the bulk parameters.
A spectral inference of the molecular abundances will be more challenging because the planet is faint, but it might be feasible with KPIC, the fiber-fed high-resolution infrared spectrograph at Keck (Wang et al. 2024), or with the enhanced sensitivity of the recent upgrade to GRAVITY+ (GRAVITY+ Collaboration 2022). Extending the SED from NIR to MIR wavelengths will increase the accuracy on the bolometric luminosity and other bulk parameters, and so will the extraction and calibration at short NIR wavelengths. Specifically, the fluxes at the blue end (λ ≲ 1.1 μm) of the IFS spectrum are systematically higher than the model spectra in Fig. 7. We suspect that this is a bias in the spectral extraction, possibly due to the lower planet contrast, enhanced speckle noise, and/or reduced instrument transmission at the shortest wavelengths. Similar contaminating systematics are also seen at the short wavelengths in the IFS spectra of other faint planets (e.g. Samland et al. 2017). The effect did not impact the parameter estimation given the S/N of the spectra. Since the inferred luminosity is consistent with a planet mass of Mp ≈ 10 MJ, but the Rp from the spectral fit is slightly too large given the mass and age constraint, this might imply that the Teff and Rp inferred from the SED are somewhat under- and overestimated, respectively.
The orbital analysis yielded first constraints on the elements, given that the astrometry covers about 9% of the orbital period, P ≈ 45 yr. The semi-major axis has a precision of ≈2-3 au, but is correlated with the poorly constrained eccentricity, and therefore, also with the inclination. The posterior favors low to intermediate eccentricities, ruling out highly eccentric face-on orbits. However, this result requires confirmation through continued astrometric monitoring. The projected motion will be somewhat linear during the coming years, while the curvature will again increase toward periastron, which is in 2038.5 ± 4.4. Since the planet orbit has an high inclination, we conclude that the orbit is not coplanar with the protoplanetary disk of the secondary star in the HD 135344 AB binary system, as it is seen close to face-on (idisk ≈ 20 deg; e.g. Pérez et al. 2014). This is also not surprising, given the large projected separation between the two stars (≈2800 au); their circumstellar environments are therefore expected to have evolved independently.
Since the star was not observed by Hipparcos, we are unable to determine a proper motion anomaly. It will be interesting to analyze the astrometric measurements from Gaia DR4. Although the orbital period of HD 135344 Ab is ≈45 years and the baseline of DR4 is 5.5 years, an acceleration of the stellar proper motion might be detectable. When future Gaia epoch astrometry will be included in the orbit fit, a first constraint on the dynamical mass can be obtained, which will be valuable given the early evolutionary stage of the planet and its possible formation in a protoplanetary disk. Furthermore, a combined analysis of the absolute and relative astrometry could place constraints on the multiplicity of the planetary system because close-in directly imaged planets are often found in pairs (e.g., at β Pic, HD 206893, and PDS 70).
The detection of HD135344Ab at only 3-4λ/D demonstrates the powerful high-contrast and high-resolution capabilities of the SPHERE and GRAVITY instrument. This study also highlights the importance of high-precision astrometric measurements to fully disentangle orbital from background motion in a region of non-stationary background stars. A good portion of luck was involved with the discovery of HD 135344 Ab, however, because we caught the planet at a favorable separation along its inclined orbit. In the next 10 to 20 years, the angular separation with its star will decrease to ≈10-35 mas, which means that the planet would not have been discovered with SPHERE for a large fraction of its orbit.
Finally, direct imaging surveys have established that giant planets are rare at separations ≳20 au (Nielsen et al. 2019; Vigan et al. 2021). The detection rate is expected to increase toward shorter separations, where radial velocity surveys have revealed a turnover point in the occurrence rates (Fernandes et al. 2019; Fulton et al. 2021). Gaia DR4 may reveal hints of similar close-in giant planets in star-forming regions, which will guide direct imaging searches and post-processing algorithms (e.g., Currie et al. 2023; Winterhalder et al. 2024). HD 135344 Ab might be part of a population of giant planets that could have formed in the vicinity of the snowline. These objects have remained challenging to detect since most surveys and observing strategies have not been optimized for such small separations.
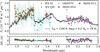 |
Fig. 7 Near-infrared spectral energy distribution of HD 135344 Ab. The black line shows the best-fit model spectrum from Sonora Diamondback, and the gray lines show 30 random samples from the posterior distribution, both shown at R = 500. The SPHERE/IFS and GRAVITY spectra are shown with circular markers, and the latter are downsampled for clarity. The SPHERE/IRDIS photometry is shown by square markers, with horizontal error bars indicating the FWHM of the corresponding filter profiles. The bottom panel shows the residuals of the best-fit model, calculated at the resolution and wavelength sampling of the data. |
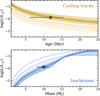 |
Fig. 8 Cooling tracks and isochrones inferred from the planetary luminosity. The colored lines show 50 random samples from the posterior distributions. The best-fit model is shown with the dashed line in each panel. The crosses represent the luminosity of HD 135344 Ab, log L/L⊙ = −3.9 ± 0.1, and the horizontal error bars indicate the prior age and posterior mass in the top and bottom panel, respectively. |
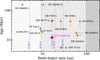 |
Fig. 9 Age vs. semi-major axis of directly imaged planets. We selected young companions with planetary masses (except for HD 206893 B), M ≲ 13 MJ, planet-to-star mass ratios of |

Acknowledgements
We thank the referee for the helpful and constructive feedback. Based on observations collected at the European Southern Observatory under ESO programmes 0103.C-0189(A), 105.20A8.001, 109.22ZA.004, 1104.C-0651(G), and 111.24FS.001. T.S. acknowledges the support from the Netherlands Organisation for Scientific Research (NWO) through grant VI.Veni.202.230. J.J.W. is supported by NASA XRP Grant 80NSSC23K0280. S.L. acknowledges the support of the French Agence Nationale de la Recherche (ANR), under grant ANR-21-CE31-0017 (project ExoVLTI). Part of this work was performed using the ALICE compute resources provided by Leiden University. This work used the Dutch national e-infrastructure with the support of the SURF Cooperative using grant no. EINF-1620. This research has made use of the Jean-Marie Mariotti Center Aspro service.
Appendix A Stellar parameters
In this appendix, we analyze the spectral energy distribution (SED) of HD 135344 A. This is important for the calibration of the contrast measurements and, given the age of the system, to identify potential IR excess by circumstellar dust. Similar to fit of the near-infrared planet SED in Sect. 3.6, we used species (Stolker et al. 2020) to model the stellar SED and retrieve the atmospheric parameters, in this case using the BT-NextGen model spectra (Allard et al. 2012). The parameter posteriors were then used for computing synthetic photometry and spectra of the star, in order to convert the contrast to flux. The main stellar parameters are listed in Table A.
The parameter estimation is based on the low-resolution Gaia XP spectrum, and Gaia G and GRVS, TYCHO BV, and 2MASS JHKs photometry. We fitted an error bar inflation for the XP spectrum to account for the systematics that were seen as low-frequency oscillations. Similarly, we inflated the uncertainty of the GRVS flux. The best-fit model spectrum has a goodness-of-fit of  and is compared with the data in Fig. A.1. The WISE fluxes were not included in the fit since the residuals revealed excess emission starting at WISE W3 (λ0 ≈ 12 μm) or perhaps already at W2 (λ0 ≈ 4.6 μm). The WISE photometry is however flagged as possibly contaminated by a diffraction spike of the secondary star, which has a high IR excess. Also, the initial WISE magnitudes are ≈0.2 and ≈2.0 mag fainter in W3 and W4, respectively, compared to the ALLWISE release (Wright et al. 2010). Extracting robust photometry might be difficult since the two stars are hardly resolved at W4. So, while there seems to be evidence for IR excess, the magnitude is yet to determined. A more detailed analysis of the potential circumstellar disk will be deferred to a followup work.
The retrieved stellar parameters are provided in Table A. The error bars reflect only the statistical uncertainties from the Bayesian inference, which might be be underestimated because model-dependent systematics are not accounted for. The effective temperature, Teff ≈ 9540 K, is consistent with an A0V type star as evolutionary tracks predict about 9500 K for a stellar mass of M* = 2.2 M⊙ (see Fig. A.2). The posterior distribution of the metallicity peaks near zero, the lower boundary of the model grid, indicating a preference for solar abundances. The visual extinction, AV ≈ 0.2, is consistent with the value derived for HD 135344 B, AV = 0.23 ± 0.06, by Fairlamb et al. (2015). The radius, R* ≈ 1.5 R⊙, is smaller than the model prediction, R* = 1.8 R⊙. The radius acts as a flux scaling of the model spectrum, together with the normal prior for the parallax. The Gaia astrometric solution has a RUWE of 0.95 and the astrometric excess noise is 0.21 mas, indicating that the parallax measurement is sufficiently reliable to not bias the inferred stellar radius. From Teff and R*, we computed a bolometric luminosity of log L*/L⊙ = 1.22 ± 0.01. The luminosity is low for an A0V type star (see Fig. A.2), as a result of the small inferred stellar radius.
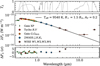 |
Fig. A.1 Spectral energy distribution ofHD 135344 A. The black line is the best-fit model spectrum and the colored markers are the photometric fluxes with horizontal error bars showing the FWHM of the filters. The top panel shows the filter profiles and the bottom panel the residuals relative to the measurement uncertainties. For clarity, every 15th wavelength of the Gaia XP spectrum is shown, whereas the full spectrum was used in the fit. |
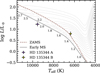 |
Fig. A.2 Stellar evolutionary tracks in comparison with the HD 135344 AB binary system. The parameters of the primary star have been estimated in this work, but here showing inflated uncertainties of σTeff = 200 K and σlog L/L⊙ = 0.1 dex. The parameters of the secondary star have been adopted from Fairlamb et al. (2015) and were corrected to the Gaia DR3 distance. The pre-main-sequence tracks are adopted from Siess et al. (2000). Stellar masses are provided next to the pre-main-sequence tracks in solar masses. The brown dashed line shows the zero age main-sequence (ZAMS; Lnuclear > 0.99Ltotal), which is at 13.7 Myr for HD 135344B (M* = 1.5 M⊙). The solid line is the early main-sequence, defined as the moment when the CNO cycle of intermediate-mass stars has reached its equilibrium. |
Stellar parameters of HD135344A.
References
- Allard, F., Hauschildt, P. H., Alexander, D. R., Tamanai, A., & Schweitzer, A. 2001, ApJ, 556, 357 [Google Scholar]
- Allard, F., Homeier, D., & Freytag, B. 2012, Phil. Trans. R. Soc. London Ser. A, 370, 2765 [Google Scholar]
- Amara, A., & Quanz, S. P. 2012, MNRAS, 427, 948 [Google Scholar]
- Balmer, W. O., Otten, G. P. P. L., & Stolker, T. 2025, https://doi.org/10.5281/zenodo.14838369 [Google Scholar]
- Baraffe, I., Chabrier, G., Barman, T. S., Allard, F., & Hauschildt, P. H. 2003, A&A, 402, 701 [NASA ADS] [CrossRef] [EDP Sciences] [Google Scholar]
- Bell, C. P. M., Mamajek, E. E., & Naylor, T. 2015, MNRAS, 454, 593 [Google Scholar]
- Beuzit, J. L., Vigan, A., Mouillet, D., et al. 2019, A&A, 631, A155 [NASA ADS] [CrossRef] [EDP Sciences] [Google Scholar]
- Blunt, S., Wang, J. J., Angelo, I., et al. 2020, AJ, 159, 89 [NASA ADS] [CrossRef] [Google Scholar]
- Bohlin, R. C., Gordon, K. D., & Tremblay, P. E. 2014, PASP, 126, 711 [NASA ADS] [Google Scholar]
- Bowler, B. P., Liu, M. C., Kraus, A. L., & Mann, A. W. 2014, ApJ, 784, 65 [NASA ADS] [CrossRef] [Google Scholar]
- Brandl, B. R., Lenzen, R., Pantin, E., et al. 2010, SPIE Conf. Ser., 7735, 77352G [Google Scholar]
- Brandt, G. M., Brandt, T. D., Dupuy, T. J., Michalik, D., & Marleau, G.-D. 2021, ApJ, 915, L16 [NASA ADS] [CrossRef] [Google Scholar]
- Brown, J. M., Blake, G. A., Qi, C., et al. 2009, ApJ, 704, 496 [Google Scholar]
- Buchner, J., Georgakakis, A., Nandra, K., et al. 2014, A&A, 564, A125 [NASA ADS] [CrossRef] [EDP Sciences] [Google Scholar]
- Chabrier, G., Baraffe, I., Allard, F., & Hauschildt, P. 2000, ApJ, 542, 464 [Google Scholar]
- Charnay, B., Bézard, B., Baudino, J. L., et al. 2018, ApJ, 854, 172 [Google Scholar]
- Chauvin, G., Desidera, S., Lagrange, A. M., et al. 2017, A&A, 605, L9 [NASA ADS] [CrossRef] [EDP Sciences] [Google Scholar]
- Claudi, R. U., Turatto, M., Gratton, R. G., et al. 2008, SPIE Conf. Ser., 7014, 70143E [Google Scholar]
- Coulson, I. M., & Walther, D. M. 1995, MNRAS, 274, 977 [NASA ADS] [Google Scholar]
- Cugno, G., Leisenring, J., Wagner, K. R., et al. 2024, AJ, 167, 182 [NASA ADS] [CrossRef] [Google Scholar]
- Currie, T., Brandt, G. M., Brandt, T. D., et al. 2023, Science, 380, 198 [NASA ADS] [CrossRef] [Google Scholar]
- Cutri, R. M., Skrutskie, M. F., van Dyk, S., et al. 2003, 2MASS All Sky Catalog of point sources [Google Scholar]
- De Rosa, R. J., Nielsen, E. L., Wahhaj, Z., et al. 2023, A&A, 672, A94 [NASA ADS] [CrossRef] [EDP Sciences] [Google Scholar]
- Dohlen, K., Langlois, M., Saisse, M., et al. 2008, SPIE Conf. Ser., 7014, 70143L [Google Scholar]
- Fairlamb, J. R., Oudmaijer, R. D., Mendigutía, I., Ilee, J. D., & van den Ancker, M. E. 2015, MNRAS, 453, 976 [Google Scholar]
- Fernandes, R. B., Mulders, G. D., Pascucci, I., Mordasini, C., & Emsenhuber, A. 2019, ApJ, 874, 81 [NASA ADS] [CrossRef] [Google Scholar]
- Feroz, F., & Hobson, M. P. 2008, MNRAS, 384, 449 [NASA ADS] [CrossRef] [Google Scholar]
- Ferrer-Chávez, R., Wang, J. J., & Blunt, S. 2021, AJ, 161, 241 [Google Scholar]
- Fulton, B. J., Rosenthal, L. J., Hirsch, L. A., et al. 2021, ApJS, 255, 14 [NASA ADS] [CrossRef] [Google Scholar]
- Gaia Collaboration (Vallenari, A., et al.) 2023, A&A, 674, A1 [NASA ADS] [CrossRef] [EDP Sciences] [Google Scholar]
- Garufi, A., Quanz, S. P., Avenhaus, H., et al. 2013, A&A, 560, A105 [CrossRef] [EDP Sciences] [Google Scholar]
- Garufi, A., Benisty, M., Pinilla, P., et al. 2018, A&A, 620, A94 [NASA ADS] [CrossRef] [EDP Sciences] [Google Scholar]
- GRAVITY Collaboration (Abuter, R., et al.) 2017, A&A, 602, A94 [NASA ADS] [CrossRef] [EDP Sciences] [Google Scholar]
- GRAVITY Collaboration (Lacour, S., et al.) 2019, A&A, 623, L11 [NASA ADS] [CrossRef] [EDP Sciences] [Google Scholar]
- GRAVITY Collaboration (Nowak, M., et al.) 2020, A&A, 633, A110 [NASA ADS] [CrossRef] [EDP Sciences] [Google Scholar]
- GRAVITY+ Collaboration (Abuter, R., et al.) 2022, The Messenger, 189, 17 [NASA ADS] [Google Scholar]
- Haffert, S. Y., Bohn, A. J., de Boer, J., et al. 2019, Nat. Astron., 3, 749 [Google Scholar]
- Helling, C., Dehn, M., Woitke, P., & Hauschildt, P. H. 2008, ApJ, 675, L105 [NASA ADS] [CrossRef] [Google Scholar]
- Hinkley, S., Lacour, S., Marleau, G. D., et al. 2023, A&A, 671, L5 [NASA ADS] [CrossRef] [EDP Sciences] [Google Scholar]
- Høg, E., Fabricius, C., Makarov, V. V., et al. 2000, A&A, 355, L27 [Google Scholar]
- Houk, N. 1982, Michigan Catalogue of Two-dimensional Spectral Types for the HD stars. Volume_3. Declinations –40_f0 to –26_f0 (Ann Arbor: University of Michigan) [Google Scholar]
- Keppler, M., Benisty, M., Müller, A., et al. 2018, A&A, 617, A44 [NASA ADS] [CrossRef] [EDP Sciences] [Google Scholar]
- Lacour, S., Wang, J. J., Nowak, M., et al. 2020, SPIE Conf. Ser., 11446, 114460O [NASA ADS] [Google Scholar]
- Luhman, K. L. 2022, AJ, 163, 25 [NASA ADS] [CrossRef] [Google Scholar]
- Macintosh, B., Graham, J. R., Barman, T., et al. 2015, Science, 350, 64 [Google Scholar]
- Maire, A. L., Stolker, T., Messina, S., et al. 2017, A&A, 601, A134 [NASA ADS] [CrossRef] [EDP Sciences] [Google Scholar]
- Mason, B. D., Wycoff, G. L., Hartkopf, W. I., Douglass, G. G., & Worley, C. E. 2001, AJ, 122, 3466 [Google Scholar]
- Miret-Roig, N., Galli, P. A. B., Brandner, W., et al. 2020, A&A, 642, A179 [NASA ADS] [CrossRef] [EDP Sciences] [Google Scholar]
- Mollière, P., van Boekel, R., Dullemond, C., Henning, T., & Mordasini, C. 2015, ApJ, 813, 47 [Google Scholar]
- Morley, C. V., Mukherjee, S., Marley, M. S., et al. 2024, ApJ, 975, 59 [NASA ADS] [CrossRef] [Google Scholar]
- Müller, A., Keppler, M., Henning, T., et al. 2018, A&A, 617, L2 [Google Scholar]
- Muto, T., Grady, C. A., Hashimoto, J., et al. 2012, ApJ, 748, L22 [Google Scholar]
- Nielsen, E. L., Rosa, R. J. D., Rameau, J., et al. 2017, AJ, 154, 218 [NASA ADS] [CrossRef] [Google Scholar]
- Nielsen, E. L., De Rosa, R. J., Macintosh, B., et al. 2019, AJ, 158, 13 [Google Scholar]
- Nowak, M., Lacour, S., Lagrange, A. M., et al. 2020, A&A, 642, L2 [NASA ADS] [CrossRef] [EDP Sciences] [Google Scholar]
- Öberg, K. I., Murray-Clay, R., & Bergin, E. A. 2011, ApJ, 743, L16 [Google Scholar]
- Pecaut, M. J., Mamajek, E. E., & Bubar, E. J. 2012, ApJ, 746, 154 [Google Scholar]
- Pérez, L. M., Isella, A., Carpenter, J. M., & Chandler, C. J. 2014, ApJ, 783, L13 [Google Scholar]
- Phillips, M. W., Tremblin, P., Baraffe, I., et al. 2020, A&A, 637, A38 [NASA ADS] [CrossRef] [EDP Sciences] [Google Scholar]
- Ratzenböck, S., Großschedl, J. E., Alves, J., et al. 2023, A&A, 678, A71 [NASA ADS] [CrossRef] [EDP Sciences] [Google Scholar]
- Samland, M., Mollière, P., Bonnefoy, M., et al. 2017, A&A, 603, A57 [NASA ADS] [CrossRef] [EDP Sciences] [Google Scholar]
- Samland, M., Bouwman, J., Hogg, D. W., et al. 2021, A&A, 646, A24 [NASA ADS] [CrossRef] [EDP Sciences] [Google Scholar]
- Siess, L., Dufour, E., & Forestini, M. 2000, A&A, 358, 593 [Google Scholar]
- Speagle, J. S. 2020, MNRAS, 493, 3132 [Google Scholar]
- Stolker, T., Sitko, M., Lazareff, B., et al. 2017, ApJ, 849, 143 [Google Scholar]
- Stolker, T., Bonse, M. J., Quanz, S. P., et al. 2019, A&A, 621, A59 [NASA ADS] [CrossRef] [EDP Sciences] [Google Scholar]
- Stolker, T., Quanz, S. P., Todorov, K. O., et al. 2020, A&A, 635, A182 [EDP Sciences] [Google Scholar]
- van der Marel, N., & Mulders, G. D. 2021, AJ, 162, 28 [NASA ADS] [CrossRef] [Google Scholar]
- Vigan, A. 2020, Astrophysics Source Code Library [record ascl:2009.002] [Google Scholar]
- Vigan, A., Moutou, C., Langlois, M., et al. 2010, MNRAS, 407, 71 [Google Scholar]
- Vigan, A., Fontanive, C., Meyer, M., et al. 2021, A&A, 651, A72 [EDP Sciences] [Google Scholar]
- Wang, J. J., Kulikauskas, M., & Blunt, S. 2021a, Astrophysics Source Code Library [record ascl:2101.003] [Google Scholar]
- Wang, J. J., Vigan, A., Lacour, S., et al. 2021b, AJ, 161, 148 [Google Scholar]
- Wang, J. J., Mawet, D., Xuan, J. W., et al. 2024, SPIE Conf. Ser., 13096, 130961X [NASA ADS] [Google Scholar]
- Widmann, F., Gillessen, S., Ott, T., et al. 2022, SPIE Conf. Ser., 12183, 121830U [NASA ADS] [Google Scholar]
- Winterhalder, T. O., Lacour, S., Mérand, A., et al. 2024, A&A, 688, A44 [NASA ADS] [CrossRef] [EDP Sciences] [Google Scholar]
- Wright, E. L., Eisenhardt, P. R. M., Mainzer, A. K., et al. 2010, AJ, 140, 1868 [Google Scholar]
- Zuckerman, B. 2019, ApJ, 870, 27 [Google Scholar]
All Tables
All Figures
|
Fig. 1 Detections of HD 135344 Ab with VLT/SPHERE. For IRDIS, the images show the residuals from the PSF subtraction for one of the dual-band filters. For IFS, the images show the detection maps for one of the wavelength channels. The planet is seen in westward direction (i.e., toward the right). The color scale is linear and normalized to the brightest pixel in each image. The dotted circles indicate the separation from the central star in integer multiples of λ/D. The night of the observation is given in each panel. |
| In the text | |
|
Fig. 2 Detections of HD 135344 AB with VLTI/GRAVITY. The color scale of the detection maps shows |
| In the text | |
|
Fig. 3 Astrometric measurements relative to the first epoch. The crosses show the positions of HD 135344 Ab, which moves eastward. The colored circles show the positions of the suspected background sources in the IRDIS field of view, which are connected with dotted lines between epochs. The dashed line shows the track for a stationary background source, and the gray circles and squares indicate the three SPHERE and three GRAVITY epochs, respectively, after the initial detection. The small dots represent a sample of Gaia sources within 0.1 deg from HD 135344 A (see main text for details). The colors indicate a specific epoch, for example, all pink markers correspond to 2021 Jul. 16. |
| In the text | |
|
Fig. 4 Background fit of the relative astrometry. The figure shows 200 randomly drawn background tracks from the posterior. The track calculated from the median parameters is shown as the solid gray line. The astrometric measurements are shown with colored markers, and their respective epochs of the best-fit model are shown with gray markers. For comparison, the dashed blue line shows the best-fit model for a parallax prior that forces the source to the background (≥500 pc). |
| In the text | |
|
Fig. 5 Orbit fit of the relative astrometry. The bottom panel shows the full orbits, and the top panel shows a zoom of the observation epochs. Both panels show the same 200 orbit samples that were randomly drawn from the posterior. The orbit with the highest likelihood is shown as the solid gray line, and the residuals of the best fit are normalized by the data uncertainties. The astrometric measurements are shown with colored markers, and their respective epochs of the best-fit model are shown with gray markers and are connected with dotted lines. The planet moves in counterclockwise direction. |
| In the text | |
|
Fig. 6 Color-magnitude diagram of MH2 vs. H2 - K1. The field objects are color-coded by M, L, and T spectral types, and the directly imaged companions are labeled individually. HD 135344 Ab is highlighted with a pink cross. The blue and orange lines show the synthetic colors computed from the AMES-Cond and AMES-Dusty evolutionary tracks at an age of 12 Myr. Blackbody emission is shown for an object with a radius of 1 RJ (dashed gray line). |
| In the text | |
|
Fig. 7 Near-infrared spectral energy distribution of HD 135344 Ab. The black line shows the best-fit model spectrum from Sonora Diamondback, and the gray lines show 30 random samples from the posterior distribution, both shown at R = 500. The SPHERE/IFS and GRAVITY spectra are shown with circular markers, and the latter are downsampled for clarity. The SPHERE/IRDIS photometry is shown by square markers, with horizontal error bars indicating the FWHM of the corresponding filter profiles. The bottom panel shows the residuals of the best-fit model, calculated at the resolution and wavelength sampling of the data. |
| In the text | |
|
Fig. 8 Cooling tracks and isochrones inferred from the planetary luminosity. The colored lines show 50 random samples from the posterior distributions. The best-fit model is shown with the dashed line in each panel. The crosses represent the luminosity of HD 135344 Ab, log L/L⊙ = −3.9 ± 0.1, and the horizontal error bars indicate the prior age and posterior mass in the top and bottom panel, respectively. |
| In the text | |
|
Fig. 9 Age vs. semi-major axis of directly imaged planets. We selected young companions with planetary masses (except for HD 206893 B), M ≲ 13 MJ, planet-to-star mass ratios of |
| In the text | |
|
Fig. A.1 Spectral energy distribution ofHD 135344 A. The black line is the best-fit model spectrum and the colored markers are the photometric fluxes with horizontal error bars showing the FWHM of the filters. The top panel shows the filter profiles and the bottom panel the residuals relative to the measurement uncertainties. For clarity, every 15th wavelength of the Gaia XP spectrum is shown, whereas the full spectrum was used in the fit. |
| In the text | |
|
Fig. A.2 Stellar evolutionary tracks in comparison with the HD 135344 AB binary system. The parameters of the primary star have been estimated in this work, but here showing inflated uncertainties of σTeff = 200 K and σlog L/L⊙ = 0.1 dex. The parameters of the secondary star have been adopted from Fairlamb et al. (2015) and were corrected to the Gaia DR3 distance. The pre-main-sequence tracks are adopted from Siess et al. (2000). Stellar masses are provided next to the pre-main-sequence tracks in solar masses. The brown dashed line shows the zero age main-sequence (ZAMS; Lnuclear > 0.99Ltotal), which is at 13.7 Myr for HD 135344B (M* = 1.5 M⊙). The solid line is the early main-sequence, defined as the moment when the CNO cycle of intermediate-mass stars has reached its equilibrium. |
| In the text | |
Current usage metrics show cumulative count of Article Views (full-text article views including HTML views, PDF and ePub downloads, according to the available data) and Abstracts Views on Vision4Press platform.
Data correspond to usage on the plateform after 2015. The current usage metrics is available 48-96 hours after online publication and is updated daily on week days.
Initial download of the metrics may take a while.