Fig. 7
Download original image
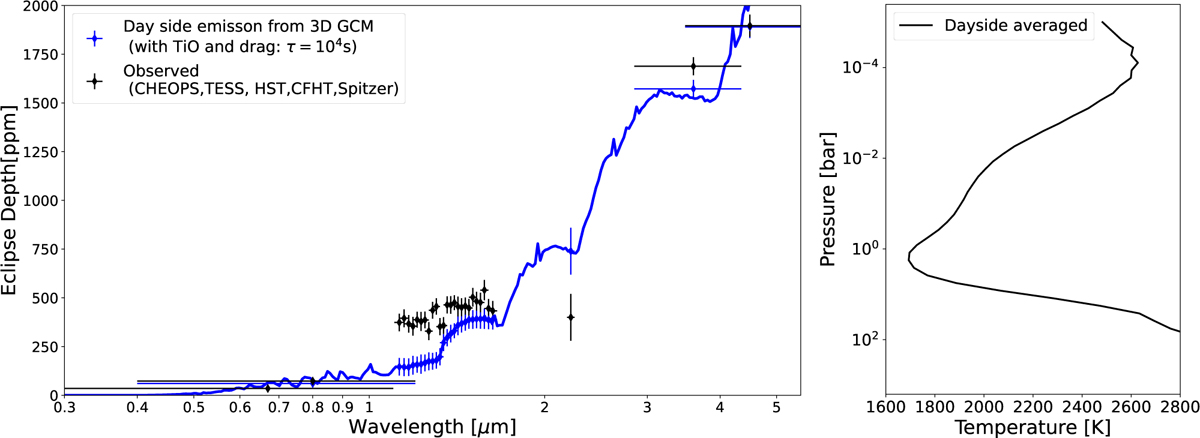
Left panel: theoretically calculated dayside emission from the 3D GCM expeRT/MITgcm for KELT-7b including TiO and VO as well as high magnetic drag (blue line) compared to the observational data (black dots). The model data are binned down for better comparison with the observational data (blue dots, assuming the same uncertainty as the observational data). The 3D GCM model agrees within 1σ with the CHEOPS and TESS observations. Right panel: associated dayside averaged T-P profile.
Current usage metrics show cumulative count of Article Views (full-text article views including HTML views, PDF and ePub downloads, according to the available data) and Abstracts Views on Vision4Press platform.
Data correspond to usage on the plateform after 2015. The current usage metrics is available 48-96 hours after online publication and is updated daily on week days.
Initial download of the metrics may take a while.