Fig. 4
Download original image
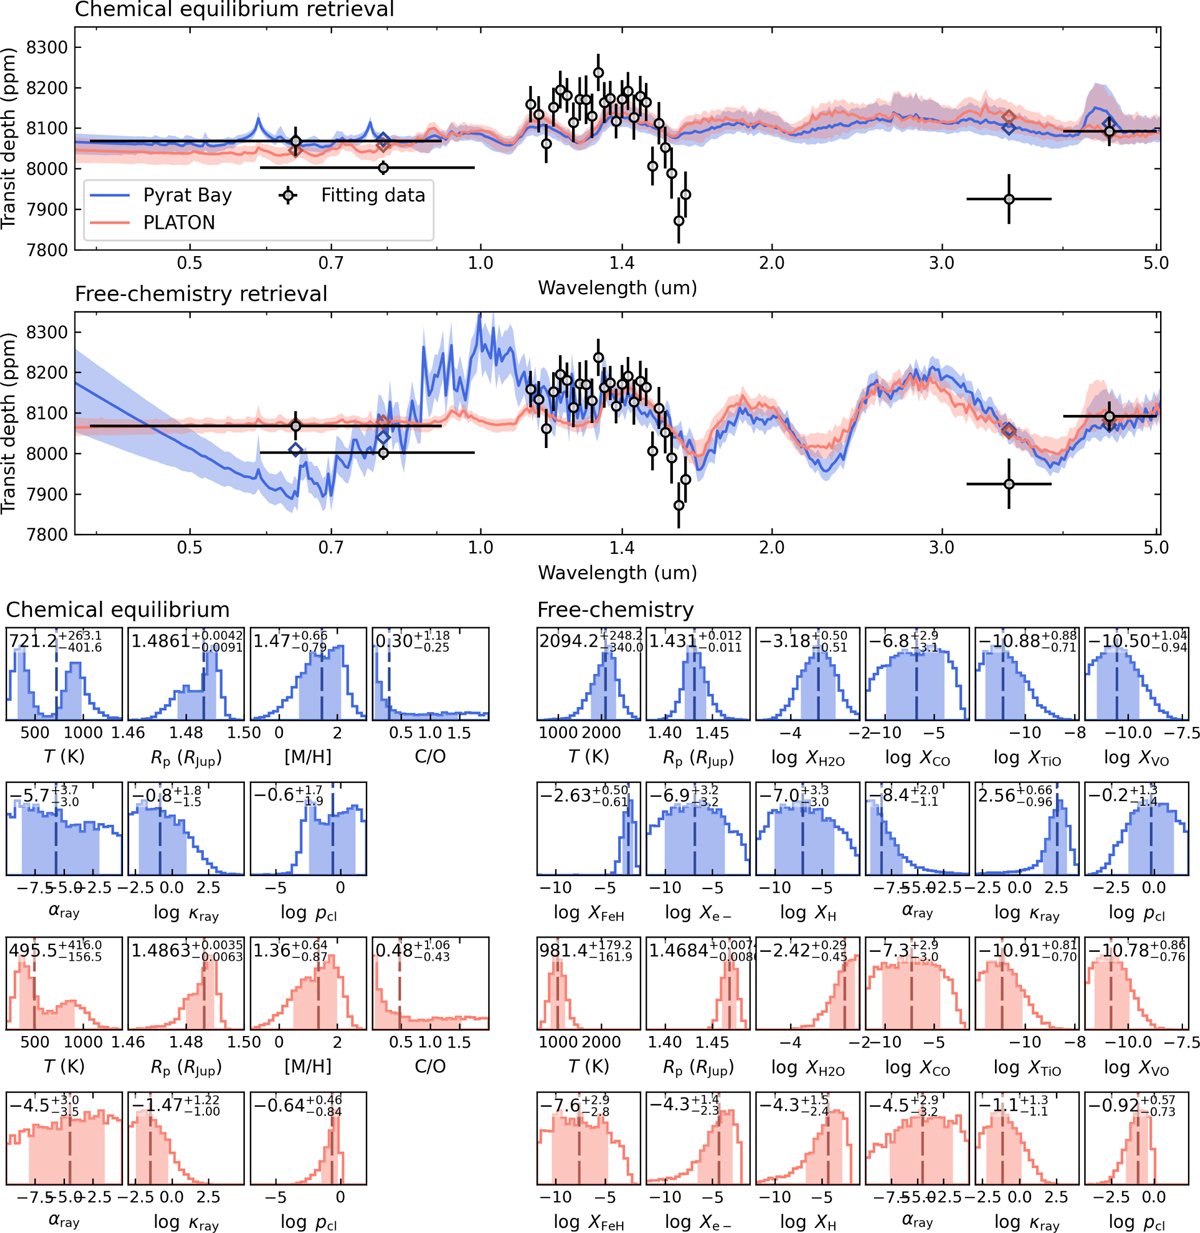
KELT-7b atmospheric retrieval of the transmission observations assuming thermochemical equilibrium (top panel) and free-chemistry (middle panel). The solid curves with shaded areas show the median and 1σ span of the posterior model spectra for PYRAT BAY (blue) and PLATON (pink), displayed at a resolution of R = 150. The black circle markers with error bars show observations used to constrain the models. The diamond markers show the model spectra integrated over the observing bands. Bottom panels: Posterior distribution of the model parameters (same color coding as above). The labels on top of each posterior show the mean and 1σ uncertainties for each parameter posterior (denoted with a dashed line and shaded area, respectively). Some parameters have been omitted from this figure (see Table 5 for the full list of free parameters).
Current usage metrics show cumulative count of Article Views (full-text article views including HTML views, PDF and ePub downloads, according to the available data) and Abstracts Views on Vision4Press platform.
Data correspond to usage on the plateform after 2015. The current usage metrics is available 48-96 hours after online publication and is updated daily on week days.
Initial download of the metrics may take a while.