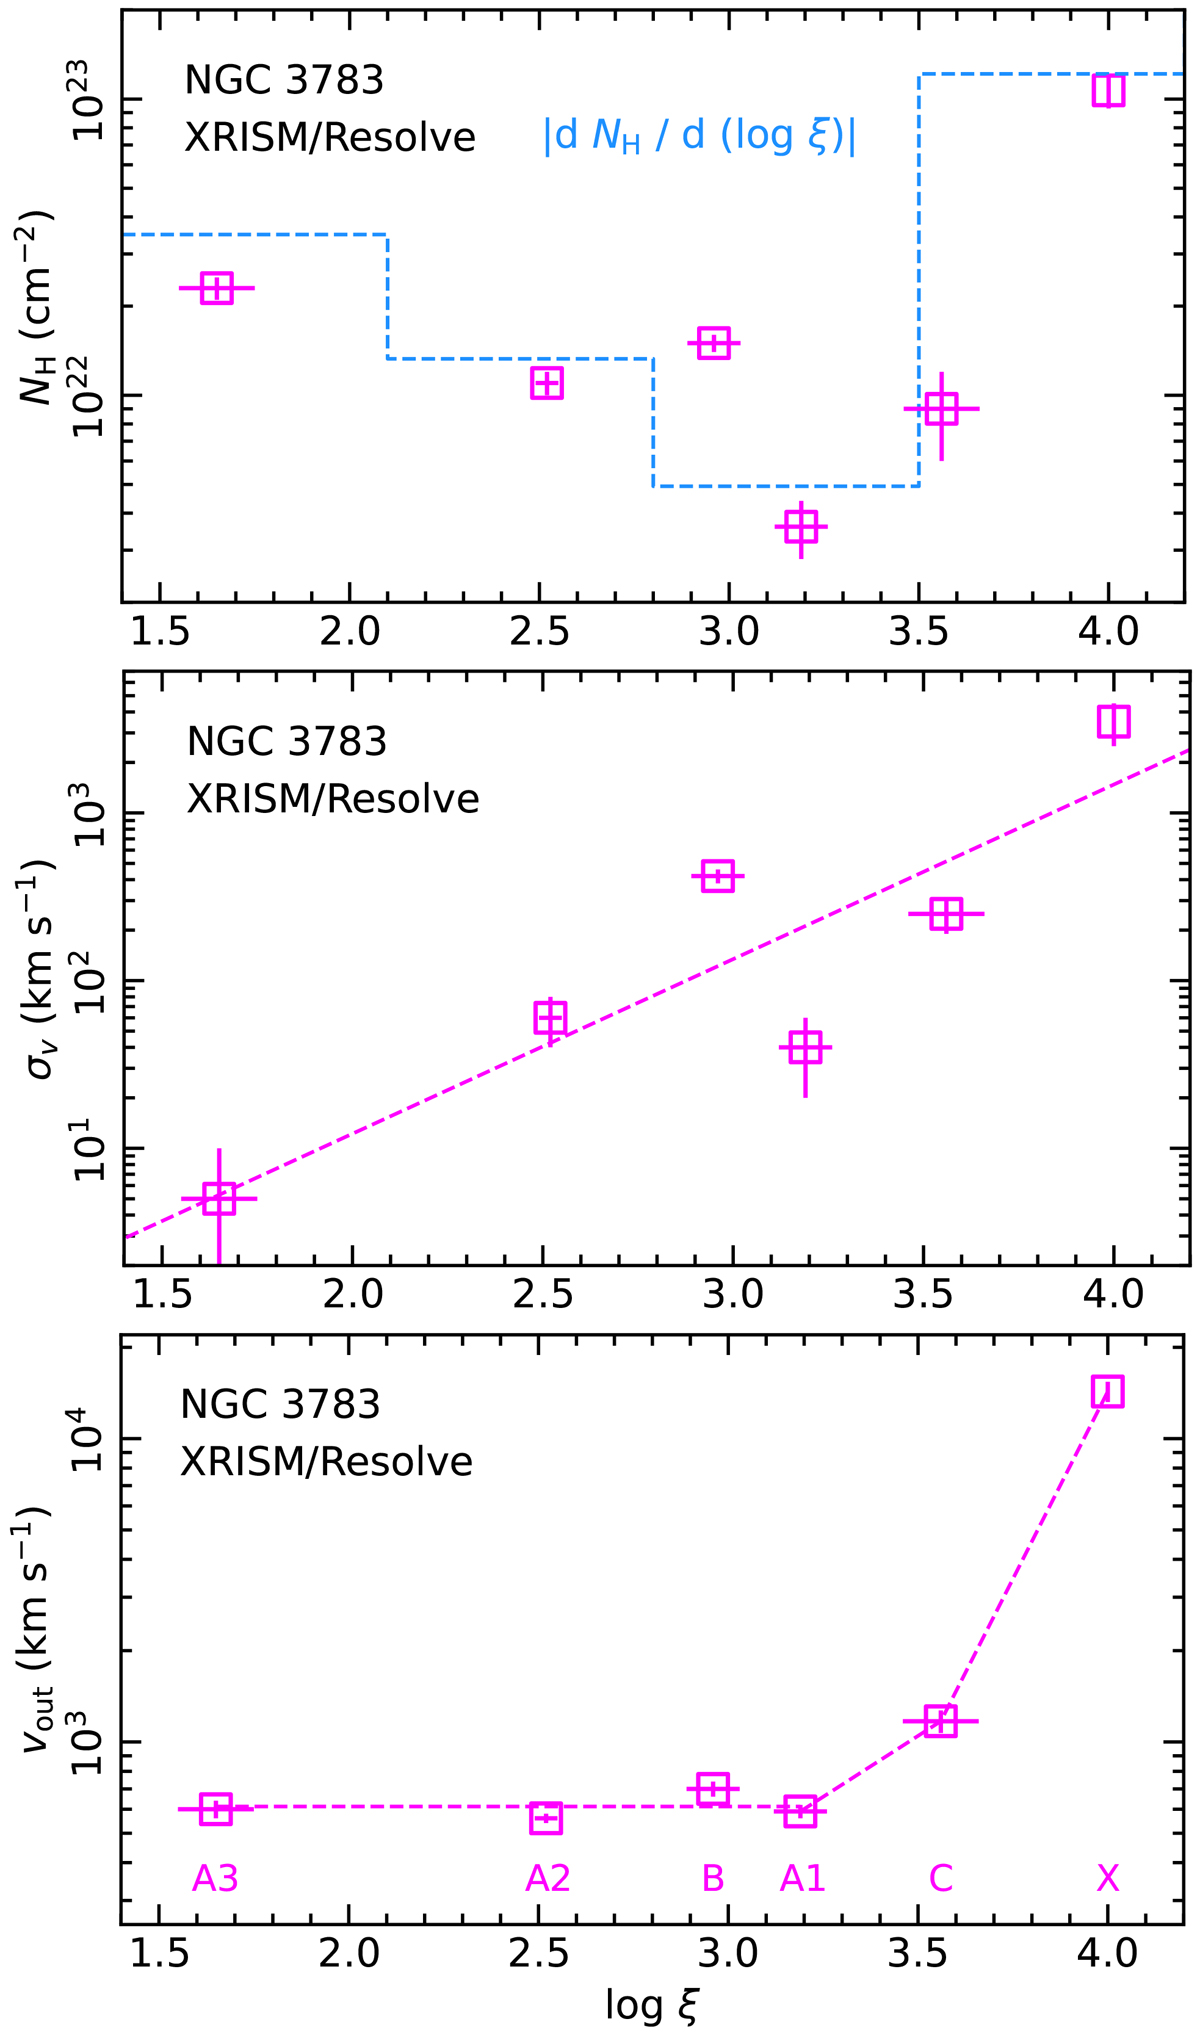
Fig. 5.
Download original image
Relations between the parameters of the six outflow components derived from the XRISM Resolve spectrum of NGC 3783. The top panel displays the column density (NH) and the AMD as functions of the ionization parameter (log ξ). The middle and bottom panels show the turbulent velocity (σv) and outflow velocity (vout) as functions of log ξ, respectively. The component label (Table 1) for each data point is shown along the lower edge of the bottom panel.
Current usage metrics show cumulative count of Article Views (full-text article views including HTML views, PDF and ePub downloads, according to the available data) and Abstracts Views on Vision4Press platform.
Data correspond to usage on the plateform after 2015. The current usage metrics is available 48-96 hours after online publication and is updated daily on week days.
Initial download of the metrics may take a while.