| Issue |
A&A
Volume 665, September 2022
|
|
|---|---|---|
| Article Number | A72 | |
| Number of page(s) | 11 | |
| Section | Extragalactic astronomy | |
| DOI | https://doi.org/10.1051/0004-6361/202142637 | |
| Published online | 12 September 2022 | |
Transient obscuration event captured in NGC 3227
III. Photoionization modeling of the X-ray obscuration event in 2019
1
Department of physics, Hiroshima University, 1-3-1 Kagamiyama, Higashi-Hiroshima, Hiroshima 739-8526, Japan
e-mail: This email address is being protected from spambots. You need JavaScript enabled to view it.
2
SRON Netherlands Institute for Space Research, Niels Bohrweg 4, 2333 CA Leiden, The Netherlands
3
Leiden Observatory, Leiden University, PO Box 9513 2300 Leiden, The Netherlands
4
Space Telescope Science Institute, 3700 San Martin Drive, Baltimore, MD 21218, USA
5
CAS Key Laboratory for Research in Galaxies and Cosmology, Department of Astronomy, University of Science and Technology of China, Hefei 230026, PR China
6
School of Astronomy and Space Science, University of Science and Technology of China, Hefei 230026, PR China
7
Department of Astronomy, Nanjing University, Nanjing 210093, PR China
8
Key Laboratory of Modern Astronomy and Astrophysics (Nanjing University), Ministry of Education, Nanjing 210093, PR China
9
Mullard Space Science Laboratory, University College London, Holmbury St. Mary, Dorking, Surrey RH5 6NT, UK
10
INAF-IASF Palermo, Via U. La Malfa 153, 90146 Palermo, Italy
11
Centre for Extragalactic Astronomy, Department of Physics, Durham University, South Road, Durham DH1 3LE, UK
12
Institute of Astronomy, University of Cambridge, Madingley Road, Cambridge CB3 0HA, UK
13
Italian Space Agency (ASI), Via del Politecnico snc, 00133 Roma, Italy
14
Dipartimento di Matematica e Fisica, Università degli Studi Roma Tre, via della Vasca Navale 84, 00146 Roma, Italy
15
Univ. Grenoble Alpes, CNRS, IPAG, 38000 Grenoble, France
16
Departament de Física, EEBE, Universitat Politècnica de Catalunya, Av. Eduard Maristany 16, 08019 Barcelona, Spain
17
INAF-Osservatorio Astronomico di Brera, Via E. Bianchi 46, 23807 Merate (LC), Italy
18
Max Planck Institute fur Extraterrestriche Physik, 85748 Garching, Germany
19
Telespazio UK for the European Space Agency (ESA), European Space Astronomy Centre (ESAC), Camino Bajo del Castillo, s/n, 28692 Villanueva de la Cañada, Madrid, Spain
20
Department of Physics, Technion-Israel Institute of Technology, 32000 Haifa, Israel
Received:
11
November
2021
Accepted:
14
April
2022
Abstract
Context. A growing number of transient X-ray obscuration events in type I active galactic nuclei suggest that our line of sight to the central engine is not always free. Multiple X-ray obscuration events were reported in the nearby Seyfert 1.5 galaxy NGC 3227 from 2000 to 2016. In late 2019, another X-ray obscuration event was identified with Swift. Two coordinated target-of-opportunity observations with XMM-Newton, NuSTAR, and the Hubble Space Telescope (HST) Cosmic Origins Spectrograph (COS) were triggered in November and December 2019 to study this obscuration event.
Aims. We aim to constrain the physical properties of the absorbing material (i.e., the obscurer) that caused the X-ray obscuration event in late 2019. We also aim to compare the handful of obscuration events in NGC 3227 and other Seyfert galaxies.
Methods. For each observation, we analyzed the time-averaged X-ray spectra collected with XMM-Newton and NuSTAR. We performed photoionization modeling with the SPEX code, which allows us to constrain the intrinsic continuum simultaneously with various photoionized absorption and emission components.
Results. Similar to previous transient X-ray obscuration events in NGC 3227, the one caught in late 2019 is short-lived (less than five months). If the obscurer has only one photoionized component, the two X-ray observations in late 2019 cannot be explained by the same obscurer that responds to the varying ionizing continuum. Due to the unknown geometry of the obscurer, its number density and distance to the black hole cannot be well constrained. The inferred distance covers at least two orders of magnitude, from the broad-line region to the dusty torus. Unlike some other X-ray obscuration events in Seyfert galaxies, such as NGC 5548 and NGC 3783, no prominent blueshifted, broad absorption troughs were found in the 2019 HST/COS spectra of NGC 3227 when compared with archival UV spectra. This might be explained if the X-ray obscurer does not intercept our line of sight to (a significant portion of) the UV-emitting region. Understanding the variety of observational differences in the X-ray obscuration events observed so far is not straightforward. Future observations with high-quality data are needed to unveil the nature of the X-ray obscuration events.
Key words: X-rays: galaxies / galaxies: active / galaxies: Seyfert / galaxies: individual: NGC 3227 / techniques: spectroscopic
© J. Mao et al. 2022
 Open Access article, published by EDP Sciences, under the terms of the Creative Commons Attribution License (https://creativecommons.org/licenses/by/4.0), which permits unrestricted use, distribution, and reproduction in any medium, provided the original work is properly cited.
This article is published in open access under the Subscribe-to-Open model. This email address is being protected from spambots. You need JavaScript enabled to view it. to support open access publication.
1. Introduction
Active galactic nuclei (AGN) are the energetic power houses at the centers of active galaxies (Netzer 2015). Matter can flow towards the supermassive black hole via accretion. At the same time, matter can also flow outward from the black hole (Crenshaw et al. 2003; Laha et al. 2021), regulating the accretion process as well as providing feedback to the host galaxy. With detectable emission across the entire electromagnetic spectrum, AGN have many interesting properties and and can be separated into many subclasses (Padovani et al. 2017). One of the main classifiers is the dusty torus (Antonucci 1993). Type I AGN are those whose line of sight towards the central engine is not blocked by the dusty torus.
A growing number of transient X-ray obscuration events are being reported in Type I AGN (e.g., Lamer et al. 2003; Risaliti et al. 2007, 2011; Markowitz et al. 2014; Kaastra et al. 2014; Ebrero et al. 2016; Mehdipour et al. 2017; Longinotti et al. 2019; Gallo et al. 2021; Miller et al. 2021; Serafinelli et al. 2021). These events indicate that, in at least some type I AGN, our line of sight to the central engine is not always free. During the transient X-ray obscuration events, one of the key features is the significant lowering of the soft X-ray continuum. Narrow emission lines in the soft X-ray band, previously hidden under the relatively high continuum level, might become observable. Furthermore, such X-ray obscuration events might be accompanied by the emergence and variation of absorption features in the UV (e.g., Kaastra et al. 2014; Ebrero et al. 2016; Mehdipour et al. 2017; Longinotti et al. 2019; Kara et al. 2021; Saez et al. 2021) and near-infrared (NIR) spectra (Landt et al. 2019; Wildy et al. 2021).
NGC 3227 is a nearby (z = 0.003859, de Vaucouleurs et al. 1991) Seyfert 1.5 galaxy containing a supermassive black hole (MBH = 5.96 × 10⁶ M⊙, Bentz & Katz 2015). Multiple X-ray obscuration events were reported in NGC 3227 from 2003 to 2016 (Lamer et al. 2003; Markowitz et al. 2014; Beuchert et al. 2015; Turner et al. 2018). As described in Mehdipour et al. (2021, Paper I hereafter), a Swift (Gehrels et al. 2004) monitoring campaign was carried out in XMM-Newton Cycle 18 (PI: J. S. Kaastra) to catch transient X-ray obscuration events in a sample of type I AGN. In late 2019, an X-ray obscuration event in NGC 3227 was identified with the Swift monitoring. We triggered two joint target-of-opportunity observations with XMM-Newton (Jansen et al. 2001), NuSTAR (Harrison et al. 2013), and HST Cosmic Origins Spectrograph (COS, Green et al. 2012) on 2019-11-15 and 2019-12-05, respectively.
Taking advantage of the multi-wavelength data of NGC 3227 obtained in late 2019, we constructed the broadband spectral energy distribution of NGC 3227 in Paper I. In Wang et al. (2022, Paper II hereafter), we analyzed the archival XMM-Newton data of NGC 3227 to characterize the warm absorber observed in the X-ray band in the absence of the obscuration event. In Paper II, we also describe transient obscuration events in December 2006 and in late 2016. The former was not identified in studies prior to Paper II, while the latter was reported by Turner et al. (2018). In the study presented here, we analyzed time-averaged X-ray spectra for each observation in November and December 2019 to study the physical properties of the absorbing material (namely, obscurer) that caused the X-ray obscuration event. Variability of the obscurer, as well as the continuum, within each observation will be studied by Grafton-Waters et al. (2022 Paper IV hereafter). Detailed analysis of the HST/COS spectra will be presented in a future paper by our team.
2. Observation
In Fig. 1, we show the archival Swift data for NGC 3227 from 2008-10-28 to 2020-12-27. During X-ray obscuration events, the significantly lowered soft X-ray flux leads to an elevated X-ray hardness ratio. The X-ray hardness ratio of NGC 3227 increased by ∼0.5 in ∼2 weeks around early November 2019 (Fig. 2, bottom panel). It remained at a high-level until 2019-12-05. After that, the target was out of the Swift visibility window until April 2020, where the hardness ratio was negative. Accordingly, the duration of the X-ray obscuration event in 2019 was less than five months. We note that the timescales of both the elevation and duration can be even shorter for NGC 3227. Around November 2008, the Swift X-ray hardness ratio increased by ∼0.3 within a day and ∼0.5 in ∼2 weeks (Fig. 2, upper panel). On 2016-12-09, the duration of the X-ray obscuration was ∼20 ks (Paper II).
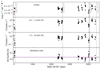 |
Fig. 1. Archival Swift data for NGC 3227 from 2008-10-28 to 2020-12-27. The top panel is the UVW2 flux. The two middle panels are the count rates in the hard (H: 1.5 − 10 keV) and soft (S: 0.3 − 1.5 keV) X-ray bands. Statistical uncertainties are in general too small to be visible in the plot. The bottom panel shows the X-ray hardness ratio (H − S)/(H + S). The horizontal solid line in purple is the historical average hardness ratio before late 2020. Calendar dates are marked by the vertical dashed lines. The vertical dotted lines in blue mark the joint HST/COS, XMM-Newton, and NuSTAR observations in late 2019. |
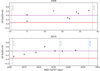 |
Fig. 2. Swift X-ray hardness ratio (H − S)/(H + S) for NGC 3227 in 2008 (top) and 2019 (bottom). The horizontal solid line in purple is the historical average hardness ratio before late 2020. The horizontal dashed line in purple, corresponding to (H − S)/(H + S)=0.4, is shown merely to guide the eye. Calendar dates are marked by the vertical dashed lines. The vertical dotted lines in blue mark the joint HST/COS, XMM-Newton, and NuSTAR observations in late 2019. |
The relatively large Swift X-ray hardness ratio in late 2019 triggered two coordinated multi-wavelength observations with HST/COS, XMM-Newton, and NuSTAR of NGC 3227. Table 1 lists the XMM-Newton and NuSTAR data used in the present work. The data reduction was the same as described in Sect. 2 of Paper I. In Table 1, we also list four HST observations, one in 2000, one in 2010, and two in late 2019. With these UV grating spectra, we aim to briefly investigate the X-ray and UV connection of the obscuring event (Sect. 5).
Observation log.
For each observation, the two first-order spectra of Reflection Grating Spectrometer (RGS, den Herder et al. 2001) were fitted simultaneously over the 6–37 Å wavelength range. The EPIC/pn spectrum in the 1.8 − 10 keV energy range was used. The NuSTAR spectra from the two detector modules (FPMA and FPMB) are combined and fitted over the 5 − 78 keV energy range. To correct for the cross calibration of different instruments, the following scaling parameters were used. These scaling parameters were obtained by matching the flux level in common energy ranges less affected by emission and absorption features: 8 − 10 Å to match RGS and EPIC/pn and 7 − 10 keV to match EPIC/pn and NuSTAR. For 2019-11-15, the scaling parameters were 1.0 (RGS1), 1.0 (RGS2), 1.038 (EPIC/pn), and 1.027 (NuSTAR), respectively. For 2019-12-05, the scaling parameters were 1.00 (RGS1), 1.041 (RGS2), 1.062 (EPIC/pn), and 1.073 (NuSTAR), respectively. HST/COS spectra are not included in our spectral analysis.
3. X-ray spectral analysis
We used SPEX v3.05.00 (Kaastra et al. 2018) and C-statistics for the X-ray spectral analysis (Kaastra 2017). One of the key features of the photoionization modeling with the SPEX code is that the intrinsic continuum can be constrained simultaneously with the absorption (and obscuration) effects. Paper I described the baseline model, which we briefly summarize here. The intrinsic broadband spectral energy distribution (SED) of NGC 3227 consists of a disk blackbody component (dbb) that dominates the optical to UV band, a warm Comptonized disk component (comt) for the soft X-ray excess, a power-law component (pow), and a neutral reflection component (refl) for the hard X-ray band. The intrinsic continuum is absorbed by the obscurer, warm absorber, and the Galactic absorption. Both the obscurer and warm absorber are assumed to be photoionized and are modeled with pion (Mehdipour et al. 2016b) components. The Galactic absorption (by neutral gas) was modeled with a hot component with its temperature and hydrogen column density frozen to 0.5 eV and NH = 2.07 × 1020 cm−2 (Murphy et al. 1996), respectively. The protosolar abundances of Lodders et al. (2009) are used for all the plasma models.
In NGC 5548 (Kaastra et al. 2014; Whewell et al. 2015; Mao et al. 2018), NGC 3783 (Mehdipour et al. 2017; Mao et al. 2019), and Mrk 335 (Longinotti et al. 2019; Parker et al. 2019), because of the presence of the obscurer, emission features of the warm emitter (Turner et al. 1996) stand out above the reduced soft X-ray continuum. However, the physical origin of the warm emitter is not clearly understood. We note that the warm emitter is not included in Paper I, which used the EPIC/pn spectra for the soft X-ray band data. Narrow emission lines in the soft X-ray band are not resolved by EPIC/pn but its large effective area is useful when building the broadband SED model. The RGS spectra are used in the present work to resolve emission line features from the warm emitter. Accordingly, we included an emission pion component (Mao et al. 2018) for the warm emitter. Due to the relatively low signal-to-noise ratio of the line features, we reduced the free parameters of the emission pion component. The emission covering factor Cem = Ω/4π depends on the solid angle (Ω) subtended by the warm emitter with respect to the central engine. We assume a fiducial value of Cem = 0.01, which is within the range of 10−4 − 10−1 (e.g., Mao et al. 2018, 2019; Grafton-Waters et al. 2020). Default values of vout = 0 km s−1 and vmic = 100 km s−1 were used. Note that in SPEX v3.05, the microscopic turbulent velocity  , where σturb is the root-mean square RMS of the line of sight velocity. The best-fit parameters (NH, log ξ, and broadening velocity due vmac to macroscopic motion around the black hole) of the warm emitter derived from the first observation were kept frozen for the second, which has a shorter exposure (Table 1) and an overall lower flux level (Fig. 2 of Paper I). That is to say, the warm emitter is assumed to be identical in the two late 2019 observations.
We note that the photoionizing continuum of the warm emitter is likely different from that of the obscurer and warm absorber. The obscurer is directly exposed to the broadband SED of NGC 3227. For the warm absorber components, the one with the highest ionization parameter is closest to the central engine (Paper II); thus it is exposed to the filtered broadband SED of NGC 3227 with the obscurer as the filter. This warm absorber component in turn further filters the photoionizing continuum received by outer and lowly ionized warm absorber components. Hence, all the warm absorber components are deionized by the obscurer. For the warm emitter, we used the intrinsic continuum derived from the observation taken on 2016-12-05 as its photoionizing continuum, because distant and/or low-density photoionized plasmas observed as soft X-ray narrow emission lines are likely in a quasi-steady state with their ionization balance (Nicastro et al. 1999; Kaastra et al. 2012; Silva et al. 2016).
In Paper I, the intrinsic continuum derived from the observation taken on 2016-12-05 was also used for the reflection component. Here, we performed fits to test alternative photoionization continua. In the first column of Table 2 (Model M1), for the observed spectrum in 2019-11-15, we couple the ionizing continuum of the reflection component to that of the present power law. In the second column (Model M2), we fix the ionizing continuum of the reflection component to that of the power law observed on 2016-12-05, as in Paper I. While the C-statistics of two models differ by ∼28, their best-fit parameters are consistent with each other within the 3σ confidence level. For the observed spectrum in 2019-12-05, while most of the best-fit parameters are comparable between Models M1 and M2, the scaling factor of the reflection component in the two models does not agree within the 3σ confidence level (Table 3). This scaling parameter (“scale” in Tables 2 and 3) is identical to that of the pexrav model in XSPEC. Furthermore, we tested a third model (Model M3) for 2019-12-05, where the ionizing continuum of the reflection component is fixed to that derived from the 2019-11-15 spectrum. In this case, the best-fit continuum parameters are more consistent with those of Model M2, with their C-statistics differing by ∼28. In these exercises, the choice of the photoionization continuum of the reflection component has no significant impact on the best-fit parameters of the obscurer, which is the main focus of this work.
Best-fit parameters of NGC 3227 observed on 2019-11-15.
Throughout this work, the ionization parameter (Tarter et al. 1969; Krolik et al. 1981) is defined as ξ = L/(nHr2), where L is the 1 − 1000 Ryd ionizing luminosity, nH the hydrogen number density, and r the distance to the black hole. Between the two observations in 2019 fitted with Model M1, we found that while the 1 − 1000 Ryd ionizing flux was lower in December (smaller by a factor of ∼2), the ionization parameters (ξ) were larger (larger by a factor of ≳100). If nHr2 of the obscurer remains the same in December, one would expect the ionization parameter to be smaller by a factor of ∼2 according to the definition of the ionization parameter. The best-fit ionization parameter does not support a constant nHr2. That is to say, unless the number density and/or distance of the obscurer decreases significantly within one month, the observed data cannot be explained by the same obscurer. The hydrogen column density is also larger by a factor of ∼2 in December. Therefore, we might be seeing two different obscurers in the two observations in 2019. A detailed variability study of the obscurer and the intrinsic continuum is beyond the scope of this work. We refer readers to Paper IV (Grafton-Waters et al. 2022).
For both 2019 spectra, we also attempted to add another pion component for the obscurer. The best-fit results are listed as Model M3 in Table 2 and Model M4 in Table 3. When using two pion components instead of one, the C-statistics can be significantly improved. Between the two obscuring components, the hydrogen column densities (NH) differed by nearly an order of magnitude. The one with relatively large NH is the additional component. For 2019-11-15, the ionization parameter of the leading NH component cannot be well constrained. For 2019-12-05, the ionization parameters of both components were poorly constrained. Moreover, the hydrogen column density of the additional photoionized component (log ξ ∼ 0.5) is much higher than the other component. The significantly increased normalization of the continuum components also contributes to the increased NH for the additional component. Without discrete observable absorption lines of the obscurer, adding a second pion component introduces degeneracy among the parameters (NH, log ξ, and the normalizations of the continuum components). These parameters can therefore have relatively large uncertainties.
As discussed below, we are not able to pinpoint the location of the X-ray obscurer. We are also puzzled by the lack of UV absorption features of the X-ray obscurer. Using two photoionized components instead of one for the X-ray obscurer does not mitigate these issues. For simplicity, we only show the best-fit model to the observed data for Model M1 in Fig. 3. In the same figure, the transmissions of the obscurer, de-ionized warm absorber, and Galactic absorption can also be found. Figure 4 shows the best-fit model to the observed RGS data in the soft X-ray band. We note that the flux level of the 2019-12-05 spectrum is rather low and the emission lines of the warm emitter are barely observed.
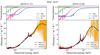 |
Fig. 3. Best-fit model (Model M1 in Tables 2 and 3) to the XMM-Newton (EPIC/pn and RGS) and NuSTAR spectra of NGC 3227 in late 2019. The top panels are the transmission of the X-ray obscurer (XO), de-ionized warm absorber (de-WA), and the Galactic absorption (MW). Data (colored curves with 1σ uncertainties in gray) and model (black curves) of each instrument are rebinned for clarity. |
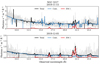 |
Fig. 4. Best-fit model (Model M1 in Tables 2 and 3) to the RGS spectra of NGC 3227 on 2019-11-15 (top) and 2019-12-05 (bottom). The warm emitter component is shown in red and is identical for both observations, while the continuum is shown in blue. The black curves are the total emission. |
We caution that the transmission plots (upper panels of Fig. 3) are derived from plasma models in a rather fine energy grid. Si and S absorption lines around ∼1.5 − 3 keV are not resolved with the current instruments. In the left panel of Fig. 5, we show the spectral region around ∼7.0 Å (or ∼1.77 keV) for EPIC/pn. Si VI to Si XII absorption lines from the obscurer dominates this energy range, probing a wide range in ionization parameter (e.g., Mao et al. 2017). Three sets of models with different ionization parameters for the X-ray obscurer are shown for comparison. Based on Model M1 in Table 2, we re-fitted the observed 2019-11-15 data set with different ionization parameters (frozen). Although Si lines are not resolved with EPIC/pn, models with different ionization parameters can lead to different C-statistics, e.g., ΔC ∼ 9 between log ξ = −1.0 and log ξ = 0.5, in this narrow wavelength range of 6.7 − 7.3 Å. This explains the relatively small 1σ (ΔC = 1) statistical uncertainties for the obscurer in Tables 2 and 3. In Fig. 5, we also show simulated XRISM/Resolve (XRISM Science Team 2020) and Athena/X-IFU (Barret et al. 2018) spectra. The Si absorption lines can be better resolved with XRISM/Resolve, which has a relatively small effective area though. Athena/X-IFU is the most ideal instrument to put tight constraints on the ionization parameter of the X-ray obscurer.
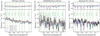 |
Fig. 5. X-ray spectra around ∼7.0 Å (or ∼1.77 keV) for EPIC/pn (100 ks, left), XRISM/Resolve (100 ks, middle), and Athena/X-IFU (50 ks, right). Data are shown in black with 1σ uncertainties shown in gray. Absorption lines from Si VI to Si XII and Mg XI are highlighted with vertical dashed lines in green. Three sets of models with different ionization parameters for the X-ray obscurer are shown: log ξ = −1.0 in orange and dashed lines, log ξ = 0.5 in blue and solid lines, log ξ = 2.0 in purple and dashed lines, respectively. Deviation (in percentage) among the three models is shown in the upper panels. |
With the above being said, we emphasize that the current data sets can rule out a highly ionized X-ray obscurer. Based on Model M1 for both observations, we fixed the ionization parameter of the obscurer to different values spanning six decades and re-fit the observed spectra. The changes of C-statistics (ΔC) are shown in Fig. 6, where ΔC is rapidly increasing when log ξ ≳ 1.5 for 2019-11-15 and log ξ ≳ 3.0 for 2019-12-05. On one hand, this is due to the lack of absorption lines (e.g., Si X, S XV, Fe XXVI) in the observed spectra. On the other hand, a large fraction of soft X-ray photons would leak through a highly ionized obscurer. Taking into account the absorption effect of the de-ionized warm absorber, this would lead to a rather different continuum shape in the soft X-ray band than the observed one. A lowly ionized X-ray obscurer is also statistically unacceptable, especially for the 2019-11-15 data set. Due to the relatively short exposure (Table 1) and low flux (e.g., Fig. 3), the 2019-12-05 data set is less sensitive (ΔC ≲ 20) to a wide range of ionization parameters.
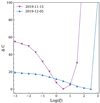 |
Fig. 6. Change in C-statistics (ΔC) for models with different ionization parameters for the X-ray obscurer. These are obtained by varying the ionization parameter of the obscurer (frozen to different values) of Models M1 in Tables 2 and 3 and re-fitting the observed 2019 spectra. |
4. C IV emission line profiles
For the long-lasting X-ray obscuration event in NGC 5548 (Kaastra et al. 2014), fingerprints of the obscurer were found as blueshifted broad absorption troughs in the UV (Kriss et al. 2019a) and NIR (Landt et al. 2019; Wildy et al. 2021) collected in 2011 − 2016. As the obscurer is closer to the central engine than the warm absorber, the shielding effect provided by the obscurer can also give rise to new narrow absorption lines of weakly ionized species of the warm absorber, as well as variation of the existing narrow UV absorption lines of the warm absorber (Arav et al. 2015). Blueshifted broad absorption troughs in the UV spectra were also found for the short-lived X-ray obscuration events in December 2016 for NGC 3783 (Mehdipour et al. 2017). We note that X-ray obscuration events in NGC 3783 are also recurrent (Kaastra et al. 2018).
For NGC 3227, if the obscurer observed in the X-ray band intercepts our line of sight to (a significant portion of) the UV-emitting region, we would expect to see absorption features in the UV band. As shown in Fig. 7, the ionic column densities of for example, H I, C IV, N V, and Si IV for the X-ray obscurer are all well above 1014 cm−2 for a wide range of the ionization parameter (−3 ≲ log ξ ≲ 3). These column densities are large enough to produce blueshifted absorption troughs in the HST/COS spectra for NGC 3227, similar to those in NGC 5548 (Kaastra et al. 2014) and NGC 3783 (Mehdipour et al. 2017; Kriss et al. 2019b). Although a highly ionized X-ray obscurer can result in low ionic column densities, it is not consistent with the observed X-ray data (Sect. 3).
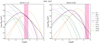 |
Fig. 7. Ionic column densities of the obscurer in NGC 3227 observed on 2019-11-15 (left) and 2019-12-05 (right). The shaded areas mark the 1σ range of the ionization parameters of the obscurer (Model M1 in Tables 2 and 3). |
Figure 8 compares the two 2019 HST/COS spectra with the 2010-05-10 HST/COS and 2000-02-08 HST/STIS spectra. No prominent blueshifted broad absorption troughs were found in any of these data. We did not find the emergence of new narrow absorption features either. No significant variations among the known narrow absorption lines were found, although we caution that the strongest ones were saturated. The apparent variable feature at ∼ + 1800 km s−1 in the C IV emission-line profile is Si Iλ1568 absorption intrinsic to NGC 3227; its actual variability is not significant. It appears enhanced in Fig. 8 due to the continuum subtraction and scaling applied to individual spectra so that the blue wings of C IV are comparable.
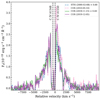 |
Fig. 8. C IV line profile in NGC 3227 observed with HST/COS on 2000-02-08 (blue), 2010-05-10 (pink), 2019-11-15 (green), and 2019-12-05 (purple). Local continua are subtracted here. Both the 2000-02-08 and 2019-11-15 line profiles are scaled by 0.6. The vertical dashed lines mark the C IVλλ1548, 1550 doublet. |
Multiple X-ray obscuration events were found in NGC 3227 in 2000–2001 (Lamer et al. 2003; Markowitz et al. 2014), 2002 (Markowitz et al. 2014), 2006 (Paper II), 2008 (Beuchert et al. 2015), 2016 (Turner et al. 2018, and Paper II), and 2019 (present work). We first check whether NGC 3227 was obscured in the X-ray band on 2000-02-08 and 2010-05-10. If so, it might explain the similarity between the scaled C IV emission line profiles.
Unfortunately, no X-ray observations were available in the entire year of 2010. On the other hand, there was a weekly monitoring campaign of NGC 3227 with RXTE in early 2000 (Markowitz et al. 2014). According to the authors, between November 2000 and February 2001, the general indicator of hard X-ray spectral shape (“apparent photon index” introduced by the authors) varied significantly, similar to the two secure obscuration events identified (their Fig. A.12). Moreover, the maximum hardness ratio of F7 − 10 keV/F2 − 4 keV was 6σ above the average. Nonetheless, this period was not considered as an obscuration event because it failed to meet one of the criteria of secure events defined by Markowitz et al. (2014), where the hardness ratio was required to increase for at least two consecutive snapshots in a row.
We cannot rule out the possibility that a short-lived (less than the one-week cadence of RXTE observations in early 2000) obscuration event occurred on 2000-02-08. Markowitz et al. (2014) identified a secure short (∼2.1 − 6.6 day) obscuration event with RXTE in October 2002. On 2016-12-09, another short-lived (≲4 d) obscuration event was identified (Turner et al. 2018, and Paper II) with deep XMM-Newton observations. We note that XMM-Newton provides data in the soft X-ray band below 2 keV, which is outside the band pass of RXTE but the soft X-ray band is where the obscuration effect is most prominent (e.g., Fig. 2 of Paper I).
Considering the variation of the known obscurer (on both shorter and longer timescales) in other Seyfert galaxies (Di Gesu et al. 2015; Mehdipour et al. 2016a; Cappi et al. 2016; De Marco et al. 2020), even if X-ray obscuration events occurred on 2000-02-08 and 2010-05-10, it is still difficult to reconcile the similar UV absorption features in all four HST spectra. Therefore, we explore possible explanations of the lack of new UV absorption features assuming that X-ray obscuration events were absent on 2000-02-08 and 2010-05-10.
5. Discussion
We argue that large ionic column densities inferred from the X-ray analysis (Fig. 7) do not necessarily produce observable absorption features in HST/COS. This might be explained if the X-ray obscurer does not intercept our line of sight to (a significant portion of) the UV-emitting region. There are two possible scenarios: (1) the obscurer is launched in the vicinity of the central engine and has not yet reached the UV-emitting region; or (2) the obscurer is above the UV-emitting region but is rather compact in size, meaning that it does not cover a significant portion of the UV-emitting region. For the former, we estimated the distance of the obscurer and compared it to the UV-emitting region (Sect. 5.2). For the latter, we showed this is plausible considering the size of the X-ray- and UV-emitting region and the X-ray covering factor (Sect. 5.3).
5.1. Effective UV-emitting region radius
We first estimate the effective radius of the UV-emitting region (R2500 Å) following Eq. (S7) of Burke et al. (2021)
 (1)
(1)
where L5100 Å is the optical continuum luminosity. For NGC 3227, with L5100 Å ∼ 3 × 1042 erg s−1 (De Rosa et al. 2015), we have R2500 Å ∼ 1.4 × 1014 cm or ∼0.05 ld. This is equivalent to ∼80 RS, where the Schwarzschild radius RS = 2GMBH/c2 = 1.76 × 1012 cm.
5.2. Distance estimation of the X-ray obscurer
We estimate the distance of the obscurer to the central engine and compare it to the distance of the broad-line region (BLR) and torus given in the literature. The distance estimation is based on the following assumptions. The obscurer has a uniform density and ionization parameter ξ = Lion/nH r2 (Tarter et al. 1969; Krolik et al. 1981), where Lion is the 1 − 1000 Ryd ionizing luminosity, nH is the hydrogen number density of the obscurer, r is the distance to the central engine. The length scale of the obscurer along the line of sight is NH/nH. We assume that the length scale of the obscurer across the line of sight is simply fNH/nH, where f is the ratio of the azimuthal to radial length scale. The obscurer might be viewed as a stream line (f < 1), a spherical cloud (f = 1), or a flatbread (f > 1). The velocity of the obscurer across our line of sight is vcross = f NH/(nH tcross), where tcross is the crossing time. We further assume  , where G is the gravitational constant and MBH the black hole mass. We note that the radial velocity can be much larger than the crossing (or azimuthal) velocity. We have
 (2)
(2)
where MBH, 7 = MBH/107 M⊙, Lion, 42 = Lion/1042 erg s−1, and NH, 22 = NH/1022 cm−2. With f = 1, we obtain the distance estimation equations used by Lamer et al. (2003) and Beuchert et al. (2015).
Table 4 lists the distance estimation of the obscurer to the black hole for f = 0.1, 1, 10, and 3000, including all the previously identified X-ray obscuration events (Lamer et al. 2003; Markowitz et al. 2014; Beuchert et al. 2015; Turner et al. 2018, and Paper II). Originally, Markowitz et al. (2014, M14) used a black hole mass of 7.59 × 10⁶ M⊙ (Denney et al. 2010) and Beuchert et al. (2015, B15) used the average value of various black hole mass measurements of 1.75 × 10⁷ M⊙. Following Paper I, we adopt the black hole mass of 5.96 × 10⁶ M⊙ from Bentz & Katz (2015). The distance to the black hole for the X-ray obscuration events identified by Markowitz et al. (2014) and Beuchert et al. (2015) is re-calculated for comparison purposes.
Distance of the obscurers to the black hole (Eq. (2)) with MBH = 5.96 × 10⁶ M⊙ (Bentz & Katz 2015). M14 and B15 are short for Markowitz et al. (2014) and Beuchert et al. (2015), respectively.
We also compare the distance of the obscurer to that of the BLR, the dusty torus, and the innermost warm absorber from the literature. Denney et al. (2009) measured a 3.8 ± 0.8 ld distance of the broad Hβ line via reverberation mapping. This value is consistent with values tabulated in Markowitz et al. (2014), which range from ∼2 ld (He Iλ5876) to ∼6 ld (Paβ and Paδ). In Paper II, the estimated inner radius of the dusty torus is ∼107 ld following Nenkova et al. (2008). We caution that the inner torus radius estimated by Nenkova et al. (2008) is valid for small dust grains. For large dust grains, one would expect a smaller distance value by a factor of ∼4 − 5 (for NGC 5548, Landt et al. 2019). The reverberation measurement of the inner radius of the dusty torus is ∼20 ld (Suganuma et al. 2006). In Paper II, the innermost warm absorber component has a distance of ∼36 − 190 ld.
Figure 9 compares the distance of the spherical obscuring cloud to that of the BLR and the dusty torus. As we can infer from Table 4, as the azimuthal to radial size ratio (f) increases, the obscurer gets closer to the black hole (r ∝ f−2/5) and its number density increases while its radial size decreases. For f ∼ 1, the number density of the obscurer (∼108 − 9 cm−3) is lower than the typical number density of the BLR clouds (∼109 − 13 cm−3, Peterson 2006) but similar to the number density of torus materials (∼108 cm−3, Landt et al. 2015).
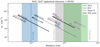 |
Fig. 9. Distance and number density (nH) of obscurers in NGC 3227, assuming a spherical geometry (f = 1 in Table 4) for the obscurer. As the azimuthal to radial size ratio (f) increases, the estimated distance decreases while the density increases. M14 and B15 denotes obscuration events reported by Markowitz et al. (2014) and Beuchert et al. (2015), respectively. Shaded area in blue mark the distance of the BLR from M14 (2 − 6 ld), as well as the Hβ distance from Denney et al. (2009). Shaded area in grey mark the distance range of the inner radius of the dusty torus. The upper limit (∼107 ld) is obtained for small dust grains (Eq. (8) of Paper II). The lower limit (∼20 ld, Suganuma et al. 2006) is the reverberation measurement. Shaded area in green mark the distance of the inner most warm absorber (Paper II). When multiple obscuration events occur on the same day, we use lower case letters (a and b) to differentiate them. When the obscurer requires two components with different ionization parameters, upper case letters H and L refer to the high- and low-ionization component, respectively. |
In our spectral analysis (Sect. 3), we assume that all the warm absorber components are de-ionized by the obscurer. The same assumption is adopted in Papers I and II for NGC 3227, as well as Kaastra et al. (2014) for NGC 5548 and Mehdipour et al. (2017) for NGC 3783. An obscurer with r ≲ 107 ld (the inner edge of the dusty torus) is consistent with our spectral analysis. This expectation can be met with f ≳ 1 as shown in Table 4. Nonetheless, we caution that it does not firmly rule out a geometry with f ≲ 1. In particularly, for f ≪ 1, our assumption of a uniform density and ionization parameter would likely fail due to stratification (e.g., Fukumura et al. 2014; Matthews et al. 2020; Ganguly et al. 2021).
In Sect. 3, we also fit the observed spectra with two pion components. For the 2019-11-15 observation, the highly ionized component of the obscurer only has an upper limit on the ionization parameter (log ξ ≲ 2). For the 2019-12-05 observation, the weakly ionized component has very large uncertainties on the ionization parameter ( ). Thus, we cannot well constrain the distance of the obscuring components via Eq. (2).
In summary, for an X-ray obscurer with one photoionized component, the effective UV-emitting region radius (R2500 Å ∼ 0.05 ld, Sect. 5.1) is closer to the black hole than the obscurer unless the azimuthal to radial length scale of the obscurer is ≫103. Moreover, R2500 Å ∼ 80RS means that a spherical X-ray obscurer with a radius of ≳80 RS is expected to intercept our line of sight to the UV-emitting line region, whether the X-ray obscurer is close to the BLR or the torus. Such deductions do not apply to other geometries with f ≠ 1. In Table 4, for f = 1, in only two of the eight X-ray obscuration events (late 2000 to early 2001 and 2008), the radius (equal to the radial size) of the X-ray obscurer is larger than 80 RS. Unfortunately, we do not have UV grating spectroscopic observations in coordination with these X-ray observations.
5.3. UV covering factor of the X-ray obscurer
As we cannot rule out the possibility that the obscurer is above the UV-emitting region, here we explore possible interpretations of the observed data in this case. The weakness or absence of the blueshifted broad absorption troughs in the HST/COS spectra can be explained if the obscurer observed in the X-ray band does not intercept our line of sight to (a significant portion of) the UV-emitting region. We note that the X-ray covering factor of the obscurer is ≲0.7 for NGC 3227 in 2019. The UV covering factor is expected to be even smaller. Assuming a fiducial X-ray-emitting central engine of the order of 10 RS, the UV-emitting region with R2500 Å ∼ 80RS would be a factor of 64 larger. The X-ray obscurer would then cover ≲1% of the UV-emitting region. Given the quality of our HST/COS spectra, it would be hard to detect broad absorption features of a few hundred km s−1 in width. In NGC 5548, the X-ray covering factor between 2012 and 2016 is ≳0.7 (Mehdipour et al. 2016b). The relatively large inclination angle (∼60°, Li et al. 2013; Fischer et al. 2013) for NGC 3227 might also play a role. For comparison, the inclination angles for both NGC 3783 and NGC 5548 are ∼40° (Li et al. 2013; Fischer et al. 2013; Pancoast et al. 2014).
6. Summary
Multiple X-ray obscuration events were reported in the nearby Seyfert 1.5 galaxy NGC 3227 from 2000 to 2016. Another X-ray obscuration event was found in late 2019. Our photoionization modeling of the two X-ray observations (in mid-November and early December) requires distinct parameters of the obscurer, which cannot be explained by the same obscurer (whether it has one or two photoionized components) responding to the variable ionizing continuum.
In the UV band, previous X-ray obscuration events found in for example NGC 5548 and NGC 3783 are accompanied with blueshifted broad absorption troughs in the simultaneous UV grating spectra. However, no prominent blueshifted broad absorption troughs were found in NGC 3227 when comparing the new HST/COS spectra obtained in 2019 with archival UV spectra obtained in 2000 and 2010.
We discuss two possible explanations for the lack of X-ray and UV association in NGC 3227: namely either (1) the obscurer is launched in the vicinity of the central engine and has not yet reached the UV-emitting region; or (2) the obscurer is above the UV-emitting region but is rather compact in size so that the X-ray obscurer does not cover a significant portion of the UV-emitting region. For the former, due to the unknown geometry of the obscurer, we cannot well constrain its distance to the central engine and compare it to that of the UV-emitting region. For the latter, we argue that this might be the case based on the size of the X-ray- and UV-emitting region and the X-ray covering factor.
Understanding the variety of observational differences in the X-ray obscuration events in NGC 3227 and other targets like NGC 5548 and NGC 3783 is not straightforward. Future multi-wavelength spectroscopic observations are needed to establish a general understanding of the nature of the X-ray obscuration events in type I AGN.
Acknowledgments
A supplementary package is available at Zenodo DOI: https://doi.org/10.5281/zenodo.6459682. This package includes data and scripts used to reproduce the fitting results and figures presented in this work. We thank the referee for careful reading and constructive suggestions to improve the quality of the manuscript. This work is based on observations obtained with XMM-Newton, an ESA science mission with instruments and contributions directly funded by ESA Member States and the USA (NASA). This research has made use of data obtained with the NuSTAR mission, a project led by the California Institute of Technology (Caltech), managed by the Jet Propulsion Laboratory (JPL) and funded by NASA. We thank the Swift team for monitoring our AGN sample, and the XMM-Newton, NuSTAR, and HST teams for scheduling our ToO triggered observations. This work work was supported by NASA through a grant for HST program number 15673 from the Space Telescope by the Association of Universities for Research in Astronomy, incorporated, under NASA contract NAS5-26555. SRON is supported financially by NWO, the Netherlands Organization for Scientific Research. J.M. acknowledges useful discussions with Zhu Liu. S.G.W. acknowledges the support of a PhD studentship awarded by the UK Science & Technology Facilities Council (STFC). S.B. acknowledges financial support from ASI under grants ASI-INAF I/037/12/0 and n. 2017-14-H.O and from PRIN MIUR project “Black Hole winds and the Baryon Life Cycle of Galaxies: the stone-guest at the galaxy evolution supper”, contract no. 2017PH3WAT. POP acknowledges financial support from the CNRS Programme National des Hautes Energies (PNHE) and from the french space agency CNES. B.D.M. acknowledges support via Ramón y Cajal Fellowship RYC2018-025950-I. D.J.W. also acknowledges support from STFC in the form of an Ernest Rutherford Fellowship (ST/N004027/1). G.P. acknowledges funding from the European Research Council (ERC) under the European Union’s Horizon 2020 research and innovation programme (grant agreement No. 865637).
References
- Antonucci, R. 1993, ARA&A, 31, 473 [Google Scholar]
- Arav, N., Chamberlain, C., Kriss, G. A., et al. 2015, A&A, 577, A37 [NASA ADS] [CrossRef] [EDP Sciences] [Google Scholar]
- Barret, D., Lam Trong, T., den Herder, J. W., et al. 2018, in Space Telescopes and Instrumentation 2018: Ultraviolet to Gamma Ray, eds. J. W. A. den Herder, S. Nikzad, & K. Nakazawa, SPIE Conf. Ser., 10699, 106991G [NASA ADS] [Google Scholar]
- Bentz, M. C., & Katz, S. 2015, PASP, 127, 67 [Google Scholar]
- Beuchert, T., Markowitz, A. G., Krauß, F., et al. 2015, A&A, 584, A82 [NASA ADS] [CrossRef] [EDP Sciences] [Google Scholar]
- Burke, C. J., Shen, Y., Blaes, O., et al. 2021, Science, 373, 789 [NASA ADS] [CrossRef] [Google Scholar]
- Cappi, M., De Marco, B., Ponti, G., et al. 2016, A&A, 592, A27 [NASA ADS] [CrossRef] [EDP Sciences] [Google Scholar]
- Crenshaw, D. M., Kraemer, S. B., & George, I. M. 2003, ARA&A, 41, 117 [NASA ADS] [CrossRef] [Google Scholar]
- De Marco, B., Adhikari, T. P., Ponti, G., et al. 2020, A&A, 634, A65 [NASA ADS] [CrossRef] [EDP Sciences] [Google Scholar]
- De Rosa, G., Peterson, B. M., Ely, J., et al. 2015, ApJ, 806, 128 [NASA ADS] [CrossRef] [Google Scholar]
- de Vaucouleurs, G., de Vaucouleurs, A., Corwin, H. G. J., et al. 1991, Third Reference Catalogue of Bright Galaxies (New York: Springer) [Google Scholar]
- den Herder, J. W., Brinkman, A. C., Kahn, S. M., et al. 2001, A&A, 365, L7 [NASA ADS] [CrossRef] [EDP Sciences] [Google Scholar]
- Denney, K. D., Peterson, B. M., Pogge, R. W., et al. 2009, ApJ, 704, L80 [NASA ADS] [CrossRef] [Google Scholar]
- Denney, K. D., Peterson, B. M., Pogge, R. W., et al. 2010, ApJ, 721, 715 [NASA ADS] [CrossRef] [Google Scholar]
- Di Gesu, L., Costantini, E., Ebrero, J., et al. 2015, A&A, 579, A42 [NASA ADS] [CrossRef] [EDP Sciences] [Google Scholar]
- Ebrero, J., Kriss, G. A., Kaastra, J. S., & Ely, J. C. 2016, A&A, 586, A72 [NASA ADS] [CrossRef] [EDP Sciences] [Google Scholar]
- Fischer, T. C., Crenshaw, D. M., Kraemer, S. B., & Schmitt, H. R. 2013, ApJS, 209, 1 [Google Scholar]
- Fukumura, K., Tombesi, F., Kazanas, D., et al. 2014, ApJ, 780, 120 [Google Scholar]
- Gallo, L. C., Gonzalez, A. G., & Miller, J. M. 2021, ApJ, 908, L33 [NASA ADS] [CrossRef] [Google Scholar]
- Ganguly, S., Proga, D., Waters, T., et al. 2021, ApJ, 914, 114 [NASA ADS] [CrossRef] [Google Scholar]
- Gehrels, N., Chincarini, G., Giommi, P., et al. 2004, ApJ, 611, 1005 [Google Scholar]
- Grafton-Waters, S., Branduardi-Raymont, G., Mehdipour, M., et al. 2020, A&A, 633, A62 [EDP Sciences] [Google Scholar]
- Grafton-Waters, S., Mao, J., Mehdipour, M., et al. 2022, A&A, submitted (Paper IV) [Google Scholar]
- Green, J. C., Froning, C. S., Osterman, S., et al. 2012, ApJ, 744, 60 [NASA ADS] [CrossRef] [Google Scholar]
- Harrison, F. A., Craig, W. W., Christensen, F. E., et al. 2013, ApJ, 770, 103 [Google Scholar]
- Jansen, F., Lumb, D., Altieri, B., et al. 2001, A&A, 365, L1 [NASA ADS] [CrossRef] [EDP Sciences] [Google Scholar]
- Kaastra, J. S. 2017, A&A, 605, A51 [NASA ADS] [CrossRef] [EDP Sciences] [Google Scholar]
- Kaastra, J. S., Detmers, R. G., Mehdipour, M., et al. 2012, A&A, 539, A117 [NASA ADS] [CrossRef] [EDP Sciences] [Google Scholar]
- Kaastra, J. S., Kriss, G. A., Cappi, M., et al. 2014, Science, 345, 64 [Google Scholar]
- Kaastra, J. S., Mehdipour, M., Behar, E., et al. 2018, A&A, 619, A112 [NASA ADS] [CrossRef] [EDP Sciences] [Google Scholar]
- Kara, E., Mehdipour, M., Kriss, G. A., et al. 2021, ApJ, 922, 151 [NASA ADS] [CrossRef] [Google Scholar]
- Kriss, G. A., De Rosa, G., Ely, J., et al. 2019a, ApJ, 881, 153 [NASA ADS] [CrossRef] [Google Scholar]
- Kriss, G. A., Mehdipour, M., Kaastra, J. S., et al. 2019b, A&A, 621, A12 [NASA ADS] [CrossRef] [EDP Sciences] [Google Scholar]
- Krolik, J. H., McKee, C. F., & Tarter, C. B. 1981, ApJ, 249, 422 [NASA ADS] [CrossRef] [Google Scholar]
- Laha, S., Reynolds, C. S., Reeves, J., et al. 2021, Nat. Astron., 5, 13 [NASA ADS] [CrossRef] [Google Scholar]
- Lamer, G., Uttley, P., & McHardy, I. M. 2003, MNRAS, 342, L41 [NASA ADS] [CrossRef] [Google Scholar]
- Landt, H., Ward, M. J., Steenbrugge, K. C., & Ferland, G. J. 2015, MNRAS, 449, 3795 [NASA ADS] [CrossRef] [Google Scholar]
- Landt, H., Ward, M. J., Kynoch, D., et al. 2019, MNRAS, 489, 1572 [NASA ADS] [CrossRef] [Google Scholar]
- Li, Y.-R., Wang, J.-M., Ho, L. C., Du, P., & Bai, J.-M. 2013, ApJ, 779, 110 [NASA ADS] [CrossRef] [Google Scholar]
- Lodders, K., Palme, H., & Gail, H. P. 2009, Landolt Börnstein, 4B, 712 [NASA ADS] [Google Scholar]
- Longinotti, A. L., Kriss, G., Krongold, Y., et al. 2019, ApJ, 875, 150 [Google Scholar]
- Mao, J., Kaastra, J. S., Mehdipour, M., et al. 2017, A&A, 607, A100 [NASA ADS] [CrossRef] [EDP Sciences] [Google Scholar]
- Mao, J., Kaastra, J. S., Mehdipour, M., et al. 2018, A&A, 612, A18 [NASA ADS] [CrossRef] [EDP Sciences] [Google Scholar]
- Mao, J., Mehdipour, M., Kaastra, J. S., et al. 2019, A&A, 621, A99 [NASA ADS] [CrossRef] [EDP Sciences] [Google Scholar]
- Markowitz, A. G., Krumpe, M., & Nikutta, R. 2014, MNRAS, 439, 1403 [Google Scholar]
- Matthews, J. H., Knigge, C., Higginbottom, N., et al. 2020, MNRAS, 492, 5540 [NASA ADS] [CrossRef] [Google Scholar]
- Mehdipour, M., Kaastra, J. S., Kriss, G. A., et al. 2016a, A&A, 588, A139 [NASA ADS] [CrossRef] [EDP Sciences] [Google Scholar]
- Mehdipour, M., Kaastra, J. S., & Kallman, T. 2016b, A&A, 596, A65 [NASA ADS] [CrossRef] [EDP Sciences] [Google Scholar]
- Mehdipour, M., Kaastra, J. S., Kriss, G. A., et al. 2017, A&A, 607, A28 [NASA ADS] [CrossRef] [EDP Sciences] [Google Scholar]
- Mehdipour, M., Kriss, G. A., Kaastra, J. S., et al. 2021, A&A, 652, A150, (Paper I) [NASA ADS] [CrossRef] [EDP Sciences] [Google Scholar]
- Miller, J. M., Zoghbi, A., Reynolds, M. T., et al. 2021, ApJ, 911, L12 [NASA ADS] [CrossRef] [Google Scholar]
- Murphy, E. M., Lockman, F. J., Laor, A., & Elvis, M. 1996, ApJS, 105, 369 [NASA ADS] [CrossRef] [Google Scholar]
- Nenkova, M., Sirocky, M. M., Nikutta, R., Ivezić, Ž., & Elitzur, M. 2008, ApJ, 685, 160 [Google Scholar]
- Netzer, H. 2015, ARA&A, 53, 365 [Google Scholar]
- Nicastro, F., Fiore, F., Perola, G. C., & Elvis, M. 1999, ApJ, 512, 184 [NASA ADS] [CrossRef] [Google Scholar]
- Padovani, P., Alexander, D. M., Assef, R. J., et al. 2017, A&ARv, 25, 2 [Google Scholar]
- Pancoast, A., Brewer, B. J., Treu, T., et al. 2014, MNRAS, 445, 3073 [Google Scholar]
- Parker, M. L., Longinotti, A. L., Schartel, N., et al. 2019, MNRAS, 490, 683 [NASA ADS] [CrossRef] [Google Scholar]
- Peterson, B. M. 2006, in The Broad-Line Region in Active Galactic Nuclei, ed. D. Alloin, 693, 77 [NASA ADS] [Google Scholar]
- Risaliti, G., Elvis, M., Fabbiano, G., et al. 2007, ApJ, 659, L111 [NASA ADS] [CrossRef] [Google Scholar]
- Risaliti, G., Nardini, E., Salvati, M., et al. 2011, MNRAS, 410, 1027 [Google Scholar]
- Saez, C., Brandt, W. N., Bauer, F. E., et al. 2021, MNRAS, 506, 343 [NASA ADS] [CrossRef] [Google Scholar]
- Serafinelli, R., Braito, V., Severgnini, P., et al. 2021, A&A, 654, A32 [NASA ADS] [CrossRef] [EDP Sciences] [Google Scholar]
- Silva, C. V., Uttley, P., & Costantini, E. 2016, A&A, 596, A79 [NASA ADS] [CrossRef] [EDP Sciences] [Google Scholar]
- Suganuma, M., Yoshii, Y., Kobayashi, Y., et al. 2006, ApJ, 639, 46 [NASA ADS] [CrossRef] [Google Scholar]
- Tarter, C. B., Tucker, W. H., & Salpeter, E. E. 1969, ApJ, 156, 943 [Google Scholar]
- Turner, T. J., George, I. M., Kallman, T., Yaqoob, T., & Zycki, P. T. 1996, ApJ, 472, 571 [NASA ADS] [CrossRef] [Google Scholar]
- Turner, T. J., Reeves, J. N., Braito, V., et al. 2018, MNRAS, 481, 2470 [NASA ADS] [CrossRef] [Google Scholar]
- Wang, Y., Kaastra, J., Mehdipour, M., et al. 2022, A&A, 657, A77, (Paper II) [NASA ADS] [CrossRef] [EDP Sciences] [Google Scholar]
- Whewell, M., Branduardi-Raymont, G., Kaastra, J. S., et al. 2015, A&A, 581, A79 [NASA ADS] [CrossRef] [EDP Sciences] [Google Scholar]
- Wildy, C., Landt, H., Ward, M. J., Czerny, B., & Kynoch, D. 2021, MNRAS, 500, 2063 [Google Scholar]
- XRISM Science Team 2020, ArXiv e-prints [arXiv:2003.04962] [Google Scholar]
All Tables
Distance of the obscurers to the black hole (Eq. (2)) with MBH = 5.96 × 10⁶ M⊙ (Bentz & Katz 2015). M14 and B15 are short for Markowitz et al. (2014) and Beuchert et al. (2015), respectively.
All Figures
|
Fig. 1. Archival Swift data for NGC 3227 from 2008-10-28 to 2020-12-27. The top panel is the UVW2 flux. The two middle panels are the count rates in the hard (H: 1.5 − 10 keV) and soft (S: 0.3 − 1.5 keV) X-ray bands. Statistical uncertainties are in general too small to be visible in the plot. The bottom panel shows the X-ray hardness ratio (H − S)/(H + S). The horizontal solid line in purple is the historical average hardness ratio before late 2020. Calendar dates are marked by the vertical dashed lines. The vertical dotted lines in blue mark the joint HST/COS, XMM-Newton, and NuSTAR observations in late 2019. |
| In the text | |
|
Fig. 2. Swift X-ray hardness ratio (H − S)/(H + S) for NGC 3227 in 2008 (top) and 2019 (bottom). The horizontal solid line in purple is the historical average hardness ratio before late 2020. The horizontal dashed line in purple, corresponding to (H − S)/(H + S)=0.4, is shown merely to guide the eye. Calendar dates are marked by the vertical dashed lines. The vertical dotted lines in blue mark the joint HST/COS, XMM-Newton, and NuSTAR observations in late 2019. |
| In the text | |
|
Fig. 3. Best-fit model (Model M1 in Tables 2 and 3) to the XMM-Newton (EPIC/pn and RGS) and NuSTAR spectra of NGC 3227 in late 2019. The top panels are the transmission of the X-ray obscurer (XO), de-ionized warm absorber (de-WA), and the Galactic absorption (MW). Data (colored curves with 1σ uncertainties in gray) and model (black curves) of each instrument are rebinned for clarity. |
| In the text | |
|
Fig. 4. Best-fit model (Model M1 in Tables 2 and 3) to the RGS spectra of NGC 3227 on 2019-11-15 (top) and 2019-12-05 (bottom). The warm emitter component is shown in red and is identical for both observations, while the continuum is shown in blue. The black curves are the total emission. |
| In the text | |
|
Fig. 5. X-ray spectra around ∼7.0 Å (or ∼1.77 keV) for EPIC/pn (100 ks, left), XRISM/Resolve (100 ks, middle), and Athena/X-IFU (50 ks, right). Data are shown in black with 1σ uncertainties shown in gray. Absorption lines from Si VI to Si XII and Mg XI are highlighted with vertical dashed lines in green. Three sets of models with different ionization parameters for the X-ray obscurer are shown: log ξ = −1.0 in orange and dashed lines, log ξ = 0.5 in blue and solid lines, log ξ = 2.0 in purple and dashed lines, respectively. Deviation (in percentage) among the three models is shown in the upper panels. |
| In the text | |
|
Fig. 6. Change in C-statistics (ΔC) for models with different ionization parameters for the X-ray obscurer. These are obtained by varying the ionization parameter of the obscurer (frozen to different values) of Models M1 in Tables 2 and 3 and re-fitting the observed 2019 spectra. |
| In the text | |
|
Fig. 7. Ionic column densities of the obscurer in NGC 3227 observed on 2019-11-15 (left) and 2019-12-05 (right). The shaded areas mark the 1σ range of the ionization parameters of the obscurer (Model M1 in Tables 2 and 3). |
| In the text | |
|
Fig. 8. C IV line profile in NGC 3227 observed with HST/COS on 2000-02-08 (blue), 2010-05-10 (pink), 2019-11-15 (green), and 2019-12-05 (purple). Local continua are subtracted here. Both the 2000-02-08 and 2019-11-15 line profiles are scaled by 0.6. The vertical dashed lines mark the C IVλλ1548, 1550 doublet. |
| In the text | |
|
Fig. 9. Distance and number density (nH) of obscurers in NGC 3227, assuming a spherical geometry (f = 1 in Table 4) for the obscurer. As the azimuthal to radial size ratio (f) increases, the estimated distance decreases while the density increases. M14 and B15 denotes obscuration events reported by Markowitz et al. (2014) and Beuchert et al. (2015), respectively. Shaded area in blue mark the distance of the BLR from M14 (2 − 6 ld), as well as the Hβ distance from Denney et al. (2009). Shaded area in grey mark the distance range of the inner radius of the dusty torus. The upper limit (∼107 ld) is obtained for small dust grains (Eq. (8) of Paper II). The lower limit (∼20 ld, Suganuma et al. 2006) is the reverberation measurement. Shaded area in green mark the distance of the inner most warm absorber (Paper II). When multiple obscuration events occur on the same day, we use lower case letters (a and b) to differentiate them. When the obscurer requires two components with different ionization parameters, upper case letters H and L refer to the high- and low-ionization component, respectively. |
| In the text | |
Current usage metrics show cumulative count of Article Views (full-text article views including HTML views, PDF and ePub downloads, according to the available data) and Abstracts Views on Vision4Press platform.
Data correspond to usage on the plateform after 2015. The current usage metrics is available 48-96 hours after online publication and is updated daily on week days.
Initial download of the metrics may take a while.